| Param | Original file | Final file |
|---|---|---|
| Filename | modeM0/AS1A10_103T06_9000005348_37811cztM0_level2.evt | modeM0/AS1A10_103T06_9000005348_37811cztM0_level2_quad_clean.evt |
| Size (bytes) | 411,612,480 | 93,202,560 |
| Size | 392.5 MB | 88.9 MB |
| Events in quadrant A | 2,956,225 | 629,823 |
| Events in quadrant B | 2,939,080 | 640,722 |
| Events in quadrant C | 2,621,999 | 630,215 |
| Events in quadrant D | 3,621,969 | 584,487 |
| Mode M9 | |||
|---|---|---|---|
| Quadrant | BADHDUFLAG | Total packets | Discarded packets |
| A | 0 | 37 | 0 |
| B | 0 | 37 | 0 |
| C | 0 | 37 | 0 |
| D | 0 | 38 | 0 |
| Mode M0 | |||
|---|---|---|---|
| Quadrant | BADHDUFLAG | Total packets | Discarded packets |
| A | 0 | 11824 | 3 |
| B | 0 | 11834 | 2 |
| C | 0 | 10596 | 2 |
| D | 0 | 13794 | 2 |
| Mode SS | |||
|---|---|---|---|
| Quadrant | BADHDUFLAG | Total packets | Discarded packets |
| A | 0 | 98 | 0 |
| B | 0 | 98 | 0 |
| C | 0 | 98 | 0 |
| D | 0 | 98 | 0 |
| Quadrant | Total seconds | Saturated seconds | Saturation percentage |
|---|---|---|---|
| A | 4807 | 24 | 0.499272% |
| B | 4807 | 27 | 0.561681% |
| C | 4807 | 30 | 0.624090% |
| D | 4807 | 317 | 6.594550% |
Noise dominated data is calculated using 1-second bins in cleaned event files. If a bin has >2000 counts, and if more than 50% of those come from <1% of pixels, then it is considered to be noise-dominated and hence unusable.
| Quadrant | # 1 sec bins | Bins with >0 counts | Bins with >2000 counts | High rate bins dominated by noise | Noise dominated (total time) | Noise dominated (detector-on time) | Marked lightcurve |
|---|---|---|---|---|---|---|---|
| A | 6960 | 4808 | 4 | 4 | 0.06% | 0.08% | 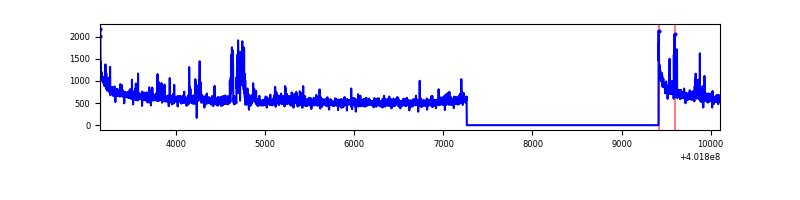 |
| B | 6960 | 4808 | 14 | 14 | 0.20% | 0.29% | 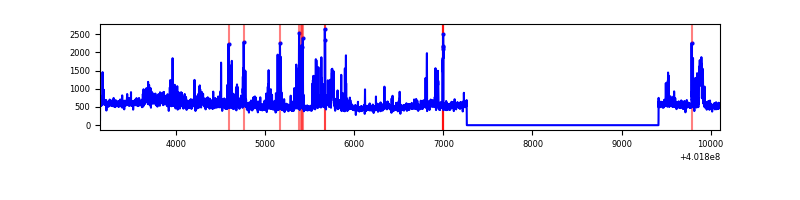 |
| C | 6960 | 4808 | 18 | 18 | 0.26% | 0.37% | 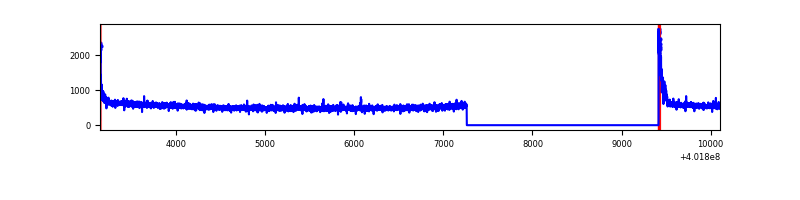 |
| D | 6960 | 4808 | 305 | 305 | 4.38% | 6.34% | 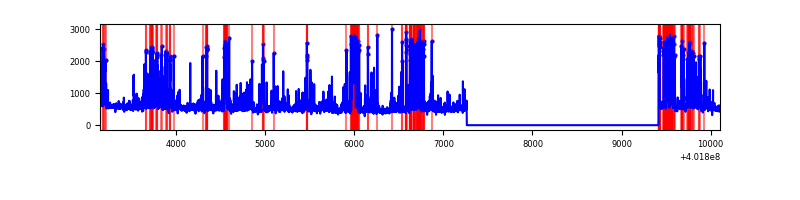 |
Top three noisy pixels from each quadrant. If the there are fewer than three noisy pixels in the level2.evt file, extra rows are filled as -1
| Pixel properties | Quadrant properties | ||||||
|---|---|---|---|---|---|---|---|
| Quadrant | DetID | PixID | Counts | Sigma | Mean | Median | Sigma |
| A | 10 | 83 | 319776 | 2579.79 | 616 | 607 | 123.7 |
| A | 15 | 222 | 190216 | 1532.58 | 616 | 607 | 123.7 |
| A | 9 | 143 | 19101 | 149.48 | 616 | 607 | 123.7 |
| B | 5 | 172 | 140104 | 1208.04 | 608 | 595 | 115.5 |
| B | 0 | 213 | 89217 | 767.4 | 608 | 595 | 115.5 |
| B | 10 | 246 | 83722 | 719.82 | 608 | 595 | 115.5 |
| C | 15 | 214 | 220385 | 1626.19 | 587 | 594 | 135.2 |
| C | 0 | 10 | 102635 | 754.98 | 587 | 594 | 135.2 |
| C | 15 | 159 | 5090 | 33.27 | 587 | 594 | 135.2 |
| D | 2 | 249 | 708655 | 5013.89 | 583 | 570 | 141.2 |
| D | 1 | 52 | 196748 | 1389.12 | 583 | 570 | 141.2 |
| D | 10 | 199 | 174042 | 1228.34 | 583 | 570 | 141.2 |
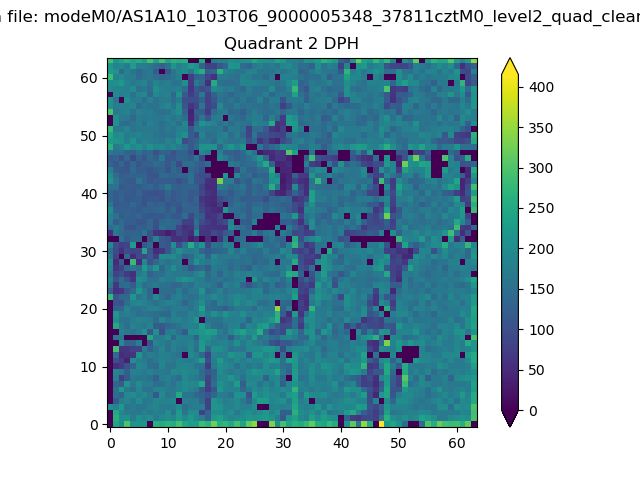
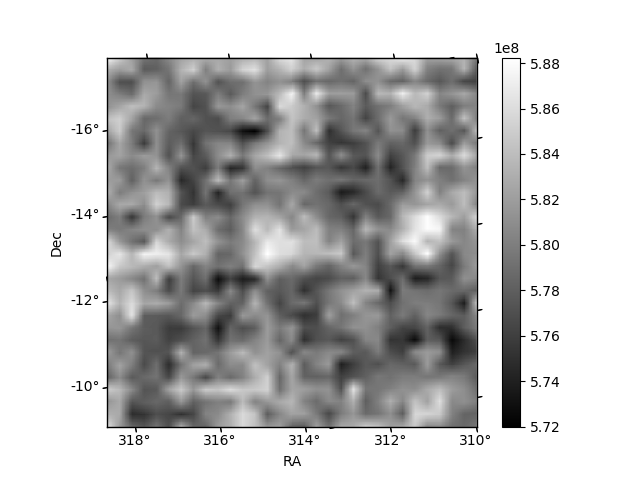
Histogram calculated using DETX and DETY for each event in the final _common_clean file
| Quadrant A | 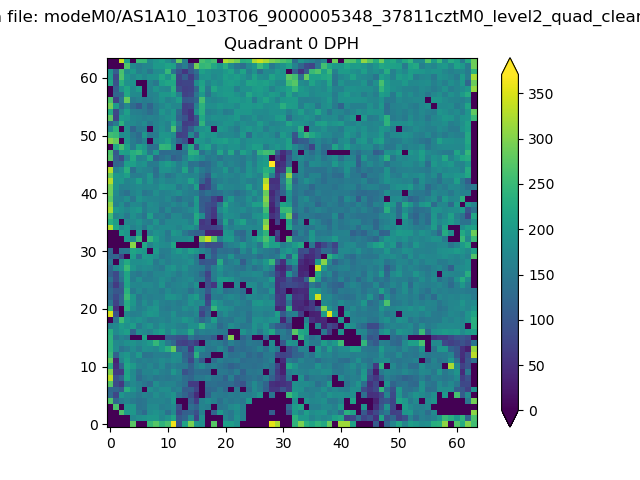 |
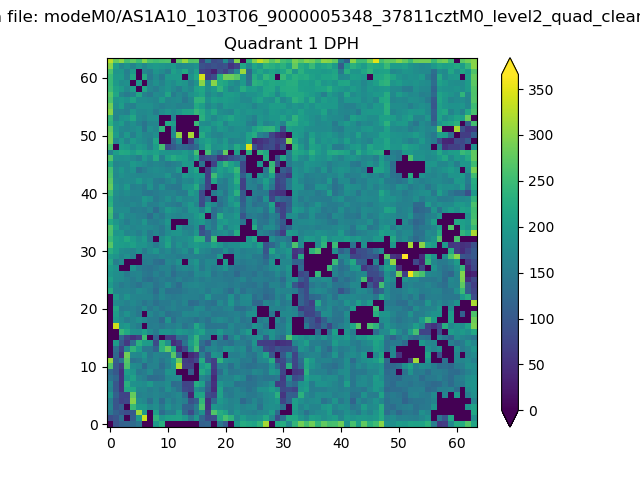 |
Quadrant B |
|---|---|---|---|
| Quadrant D | 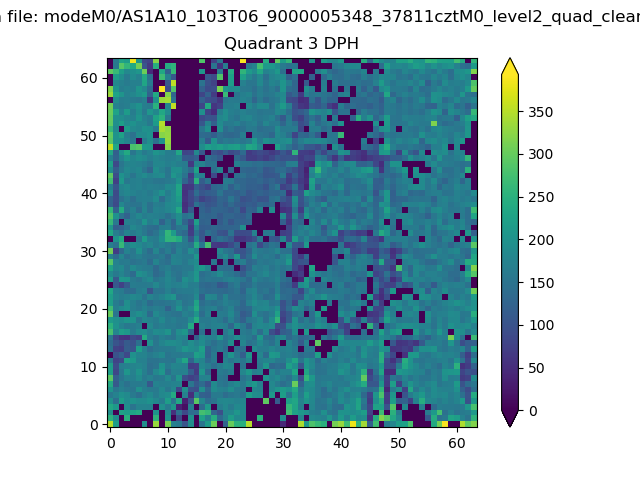 |
 |
Quadrant C |
| Plot type | Count rate plots | Images |
|---|---|---|
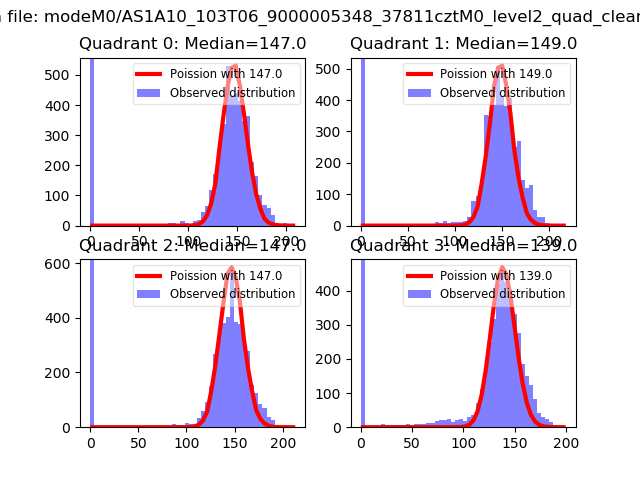
| Comparison with Poisson distribution Blue bars denote a histogram of data divided into 1 sec bins. Red curve is a Poisson curve with rate = median count rate of data. |
 |
 |
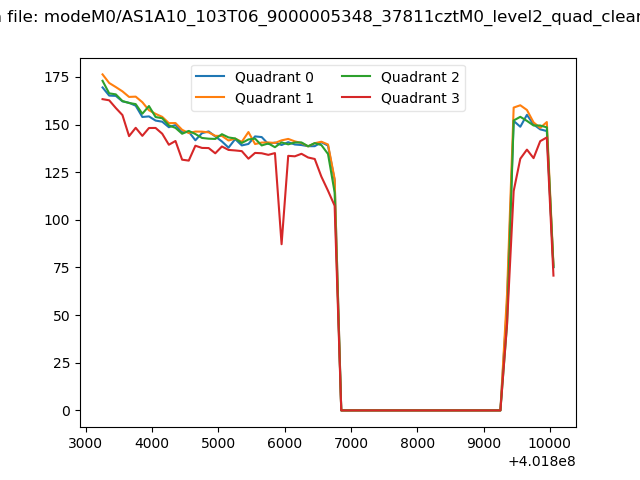
| Quadrant-wise count rates Data is divided into 100 sec bins |
 |
|
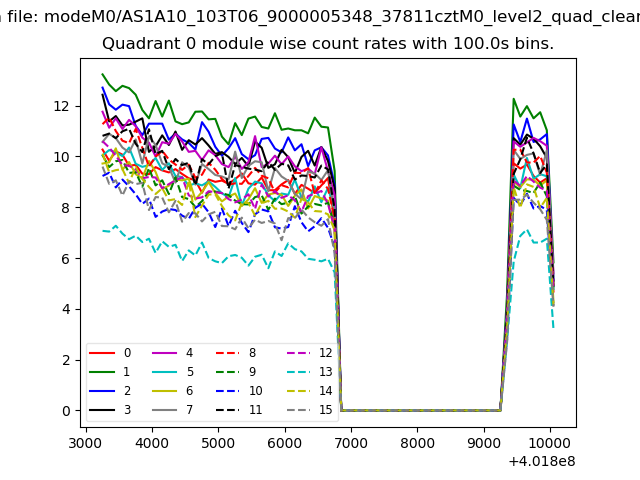
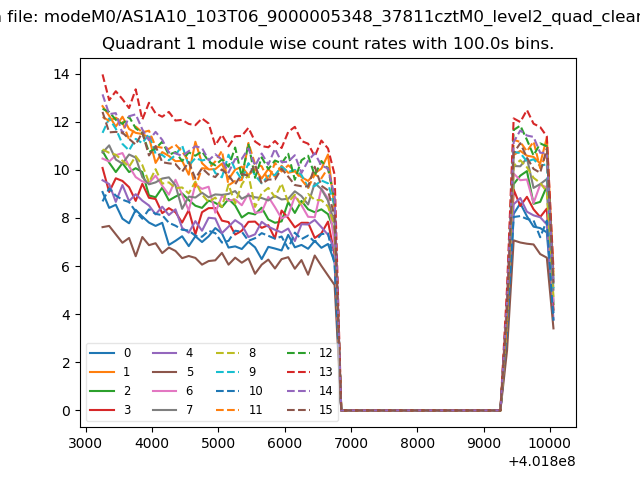
| Module-wise count rates for Quadrant A Data is divided into 100 sec bins |
 |
 |
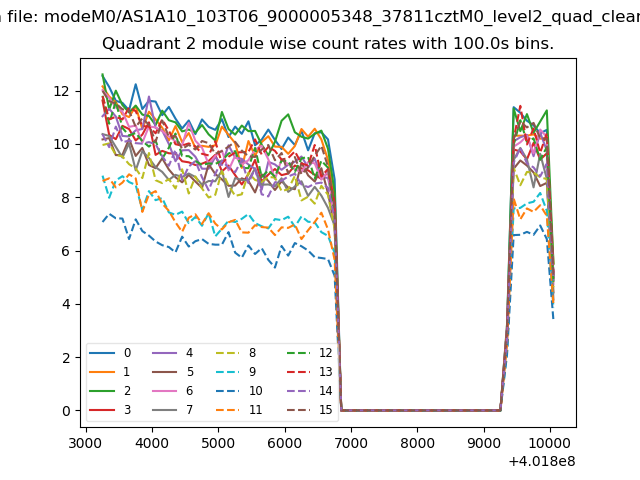
| Module-wise count rates for Quadrant B Data is divided into 100 sec bins |
 |
 |
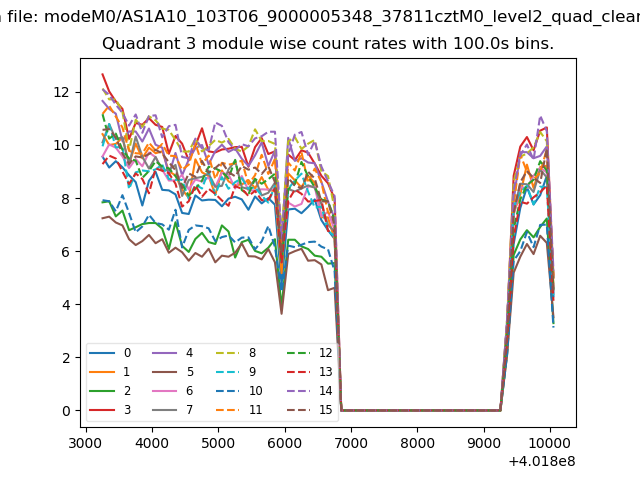
| Module-wise count rates for Quadrant C Data is divided into 100 sec bins |
 |
 |
| Module-wise count rates for Quadrant D Data is divided into 100 sec bins |
 |
 |
| Parameter | Plot |
|---|---|
| CZT HV Monitor | 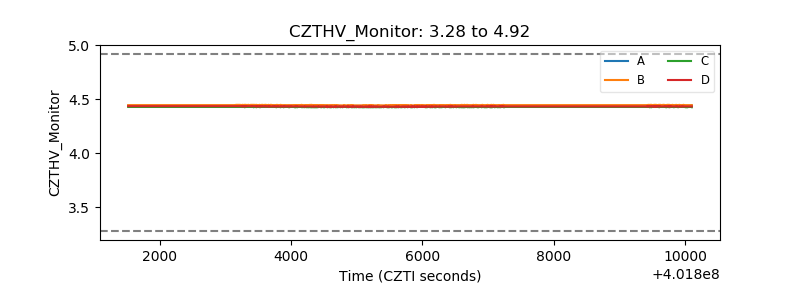 |
| D_VDD | 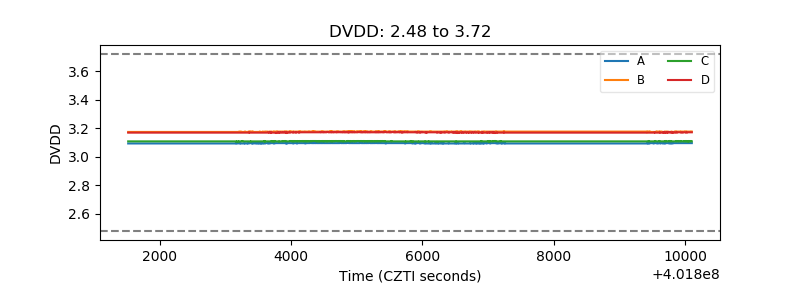 |
| Temperature 1 | 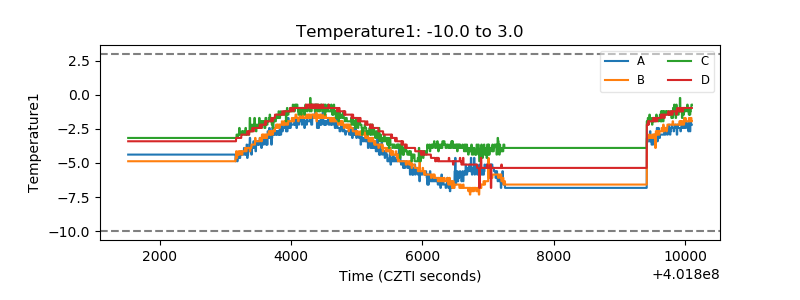 |
| Veto HV Monitor | 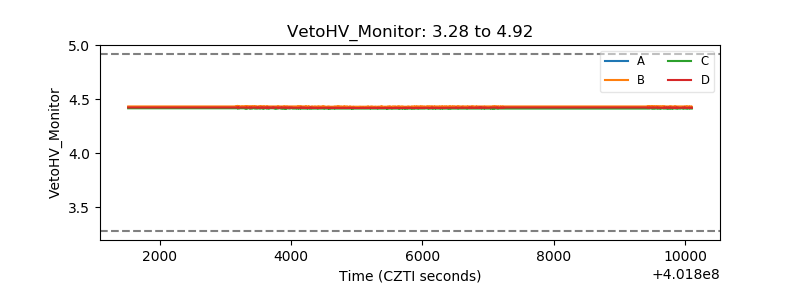 |
| Veto LLD | 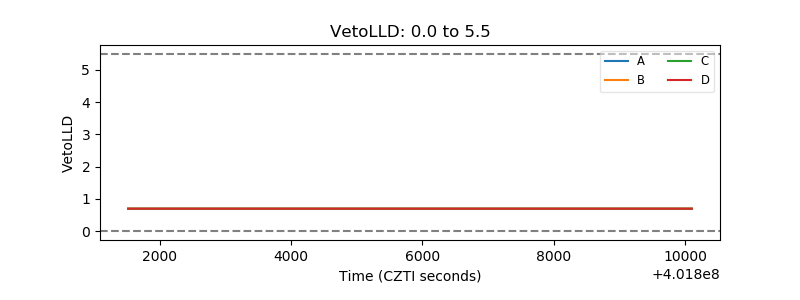 |
| Alpha Counter | 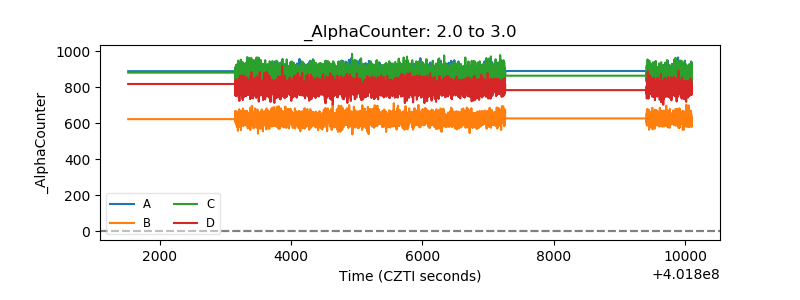 |
| _CPM_Rate | 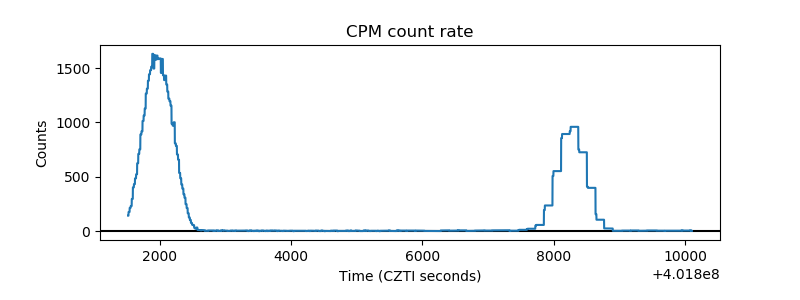 |
| CZT Counter |  |
| +2.5 Volts monitor | 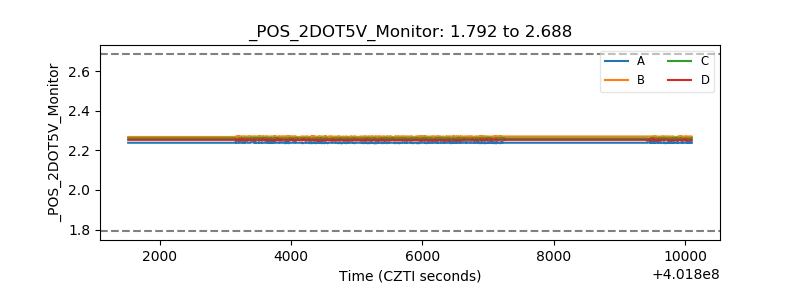 |
| +5 Volts monitor | 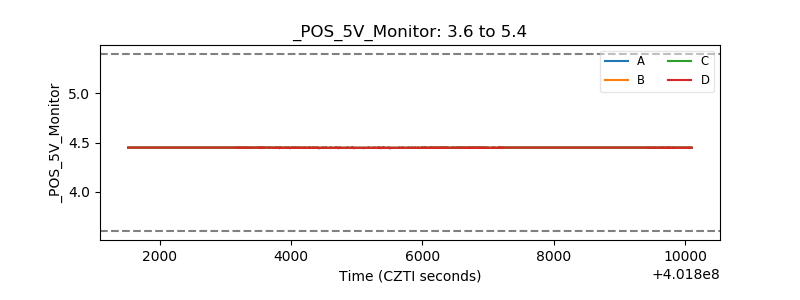 |
| _ROLL_ROT | 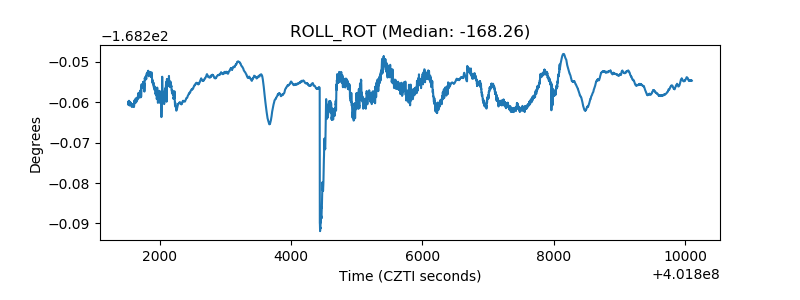 |
| _Roll_DEC | 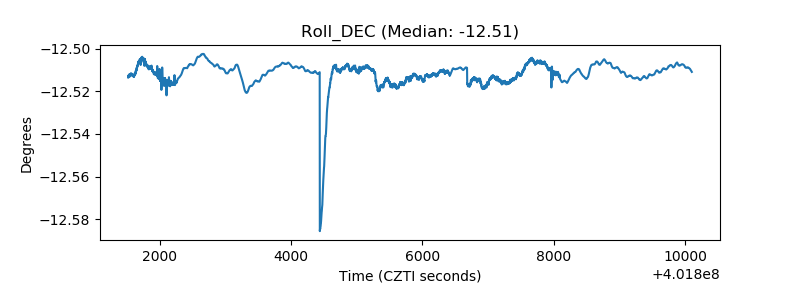 |
| _Roll_RA | 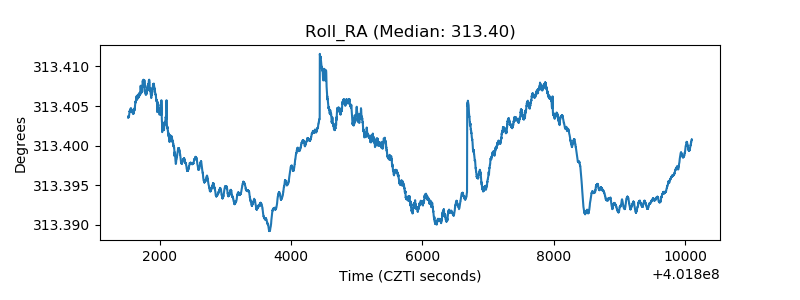 |
| Veto Counter | 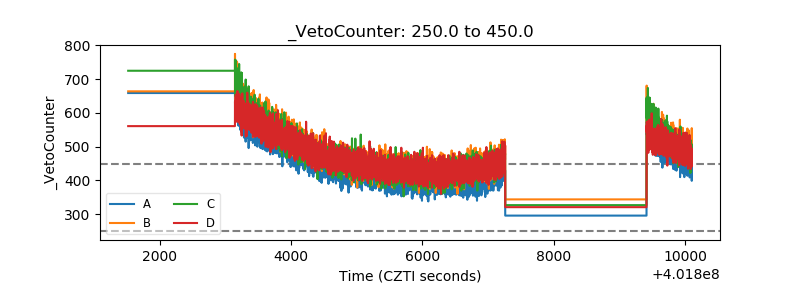 |