| Param | Original file | Final file |
|---|---|---|
| Filename | modeM0/AS1A10_103T06_9000005348_37812cztM0_level2.evt | modeM0/AS1A10_103T06_9000005348_37812cztM0_level2_quad_clean.evt |
| Size (bytes) | 389,828,160 | 83,252,160 |
| Size | 371.8 MB | 79.4 MB |
| Events in quadrant A | 2,810,669 | 552,127 |
| Events in quadrant B | 2,942,007 | 553,059 |
| Events in quadrant C | 2,575,116 | 551,352 |
| Events in quadrant D | 3,144,970 | 520,798 |
| Mode M9 | |||
|---|---|---|---|
| Quadrant | BADHDUFLAG | Total packets | Discarded packets |
| A | 0 | 42 | 0 |
| B | 0 | 42 | 0 |
| C | 0 | 42 | 0 |
| D | 0 | 42 | 0 |
| Mode M0 | |||
|---|---|---|---|
| Quadrant | BADHDUFLAG | Total packets | Discarded packets |
| A | 0 | 11421 | 3 |
| B | 0 | 11736 | 2 |
| C | 0 | 10487 | 2 |
| D | 0 | 12564 | 2 |
| Mode SS | |||
|---|---|---|---|
| Quadrant | BADHDUFLAG | Total packets | Discarded packets |
| A | 0 | 102 | 0 |
| B | 0 | 102 | 0 |
| C | 0 | 102 | 0 |
| D | 0 | 102 | 0 |
| Quadrant | Total seconds | Saturated seconds | Saturation percentage |
|---|---|---|---|
| A | 4899 | 32 | 0.653195% |
| B | 4899 | 100 | 2.041233% |
| C | 4899 | 32 | 0.653195% |
| D | 4899 | 190 | 3.878343% |
Noise dominated data is calculated using 1-second bins in cleaned event files. If a bin has >2000 counts, and if more than 50% of those come from <1% of pixels, then it is considered to be noise-dominated and hence unusable.
| Quadrant | # 1 sec bins | Bins with >0 counts | Bins with >2000 counts | High rate bins dominated by noise | Noise dominated (total time) | Noise dominated (detector-on time) | Marked lightcurve |
|---|---|---|---|---|---|---|---|
| A | 9175 | 4901 | 18 | 18 | 0.20% | 0.37% |  |
| B | 9175 | 4901 | 79 | 79 | 0.86% | 1.61% |  |
| C | 9175 | 4901 | 18 | 18 | 0.20% | 0.37% |  |
| D | 9175 | 4901 | 173 | 173 | 1.89% | 3.53% |  |
Top three noisy pixels from each quadrant. If the there are fewer than three noisy pixels in the level2.evt file, extra rows are filled as -1
| Pixel properties | Quadrant properties | ||||||
|---|---|---|---|---|---|---|---|
| Quadrant | DetID | PixID | Counts | Sigma | Mean | Median | Sigma |
| A | 10 | 83 | 325080 | 2705.19 | 596 | 587 | 120.0 |
| A | 9 | 143 | 85072 | 704.32 | 596 | 587 | 120.0 |
| A | 15 | 222 | 39165 | 321.61 | 596 | 587 | 120.0 |
| B | 5 | 172 | 426882 | 3814.48 | 582 | 567 | 111.8 |
| B | 10 | 246 | 87947 | 781.84 | 582 | 567 | 111.8 |
| B | 4 | 232 | 48426 | 428.22 | 582 | 567 | 111.8 |
| C | 15 | 214 | 224858 | 1694.86 | 569 | 574 | 132.3 |
| C | 0 | 10 | 111311 | 836.81 | 569 | 574 | 132.3 |
| C | 0 | 207 | 10138 | 72.27 | 569 | 574 | 132.3 |
| D | 10 | 199 | 217756 | 1578.78 | 568 | 555 | 137.6 |
| D | 1 | 52 | 217111 | 1574.1 | 568 | 555 | 137.6 |
| D | 2 | 249 | 194098 | 1406.82 | 568 | 555 | 137.6 |
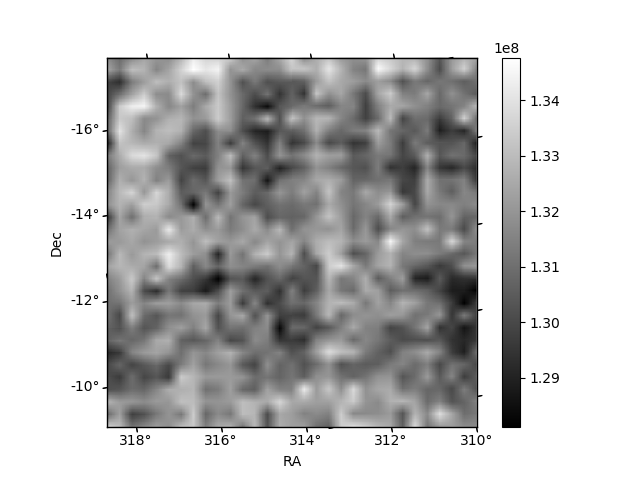
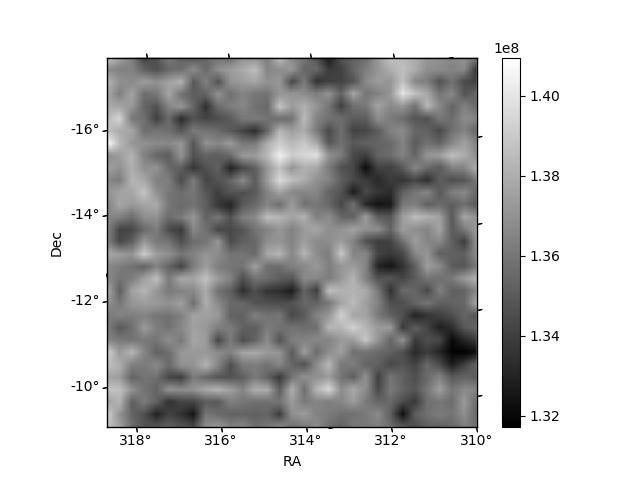
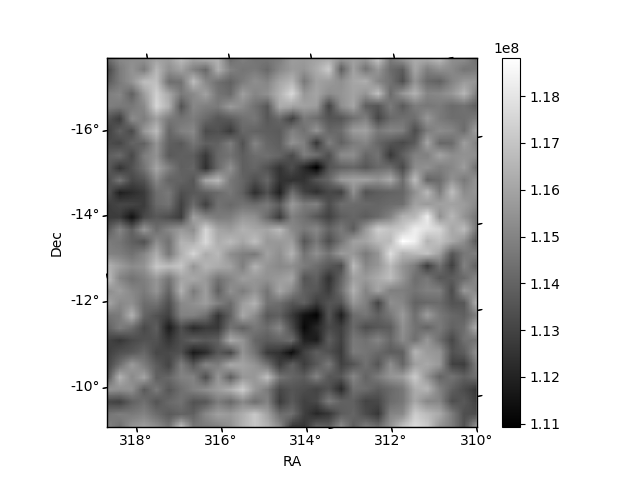
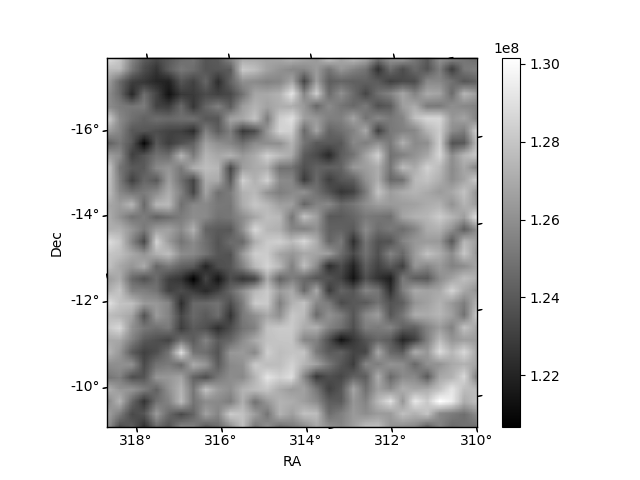
Histogram calculated using DETX and DETY for each event in the final _common_clean file
| Quadrant A | 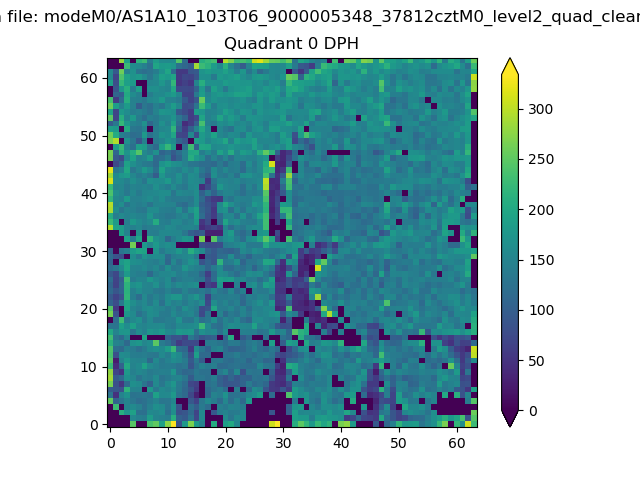 |
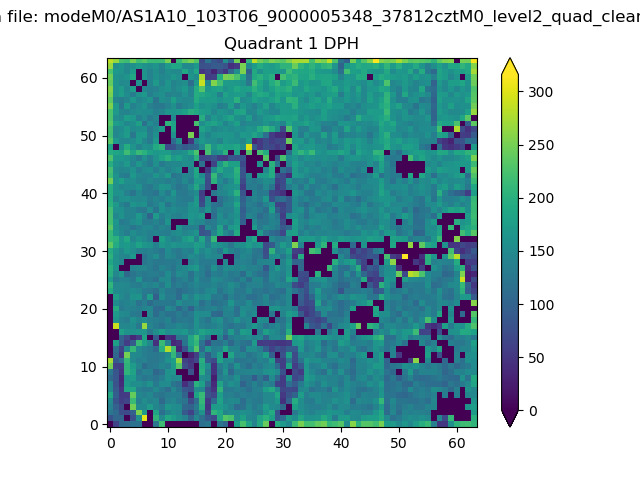 |
Quadrant B |
|---|---|---|---|
| Quadrant D | 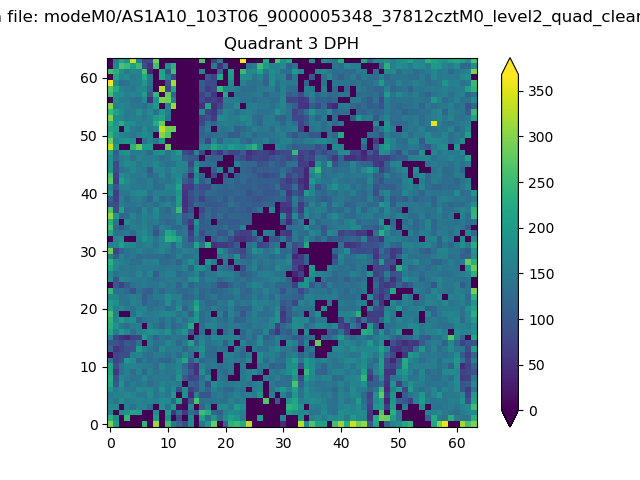 |
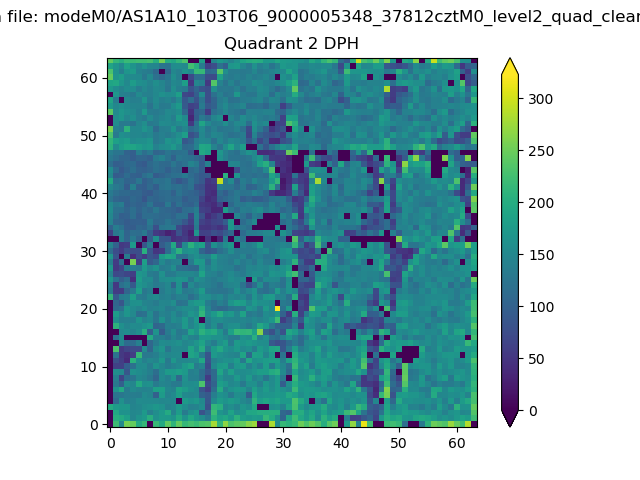 |
Quadrant C |
| Plot type | Count rate plots | Images |
|---|---|---|
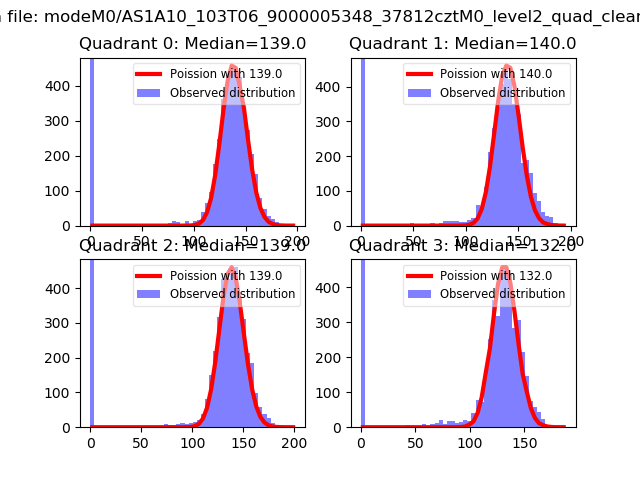
| Comparison with Poisson distribution Blue bars denote a histogram of data divided into 1 sec bins. Red curve is a Poisson curve with rate = median count rate of data. |
 |
 |
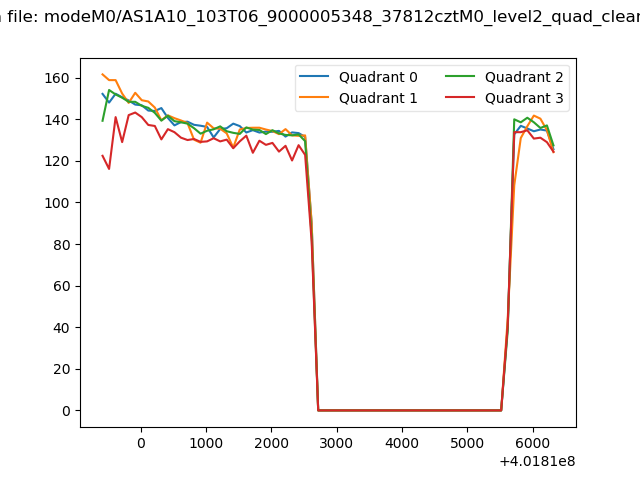
| Quadrant-wise count rates Data is divided into 100 sec bins |
 |
|
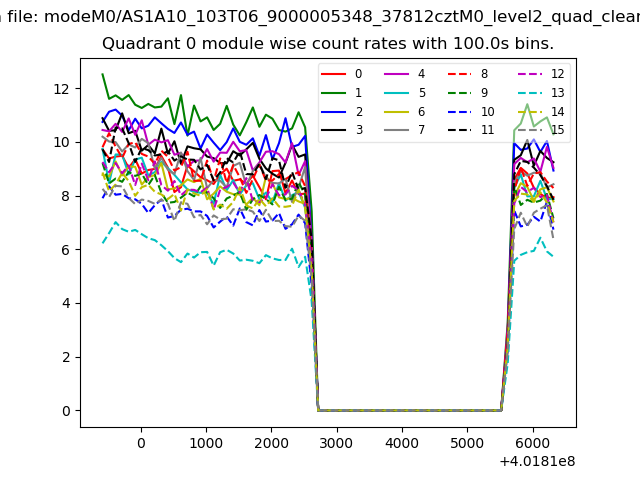
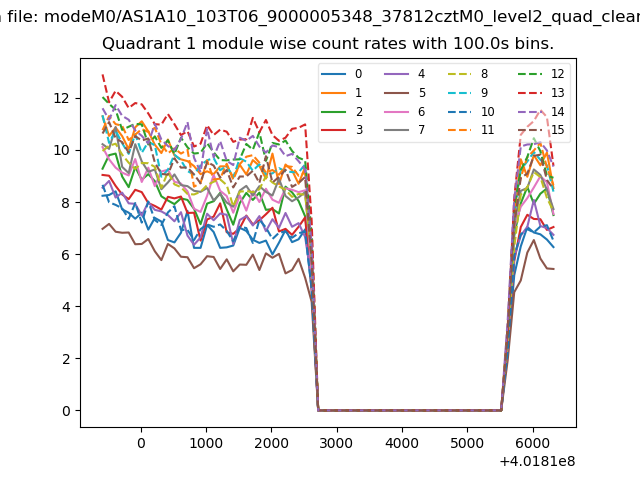
| Module-wise count rates for Quadrant A Data is divided into 100 sec bins |
 |
 |
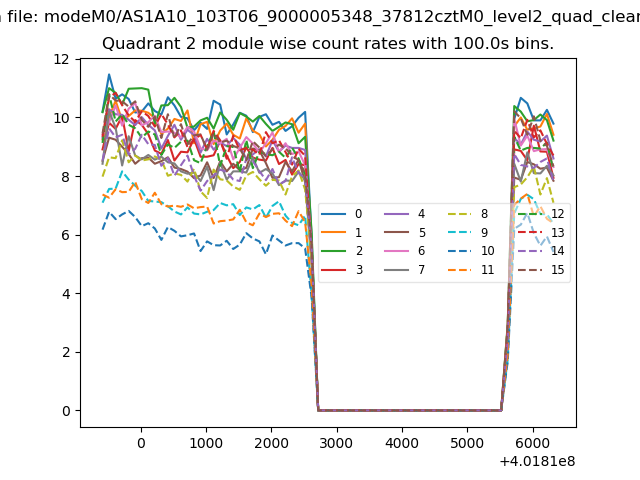
| Module-wise count rates for Quadrant B Data is divided into 100 sec bins |
 |
 |
| Module-wise count rates for Quadrant C Data is divided into 100 sec bins |
 |
 |
| Module-wise count rates for Quadrant D Data is divided into 100 sec bins |
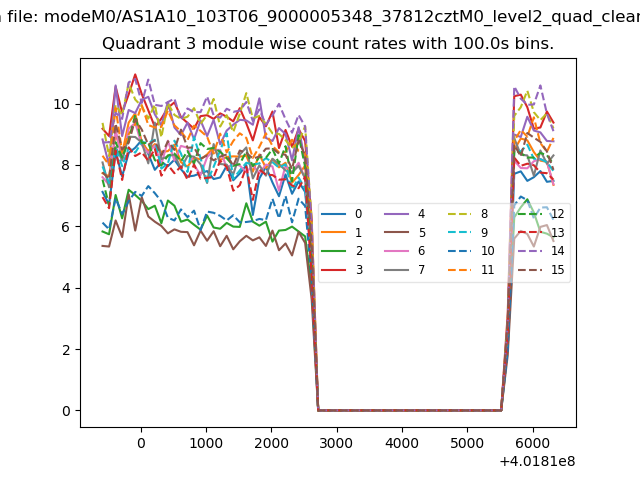 |
 |
| Parameter | Plot |
|---|---|
| CZT HV Monitor | 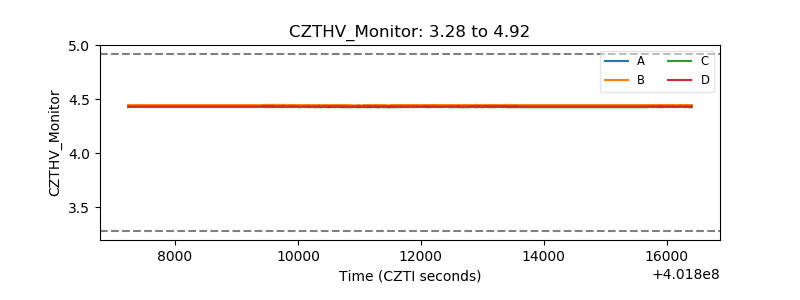 |
| D_VDD | 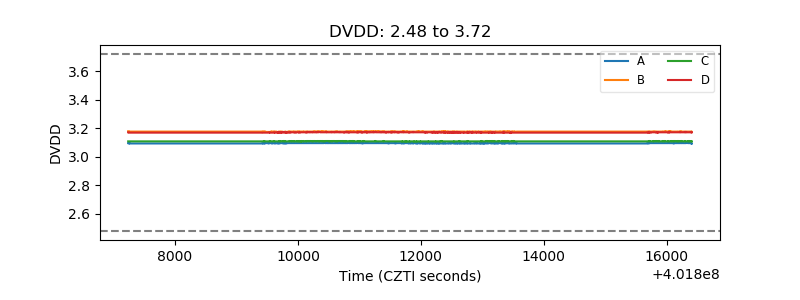 |
| Temperature 1 | 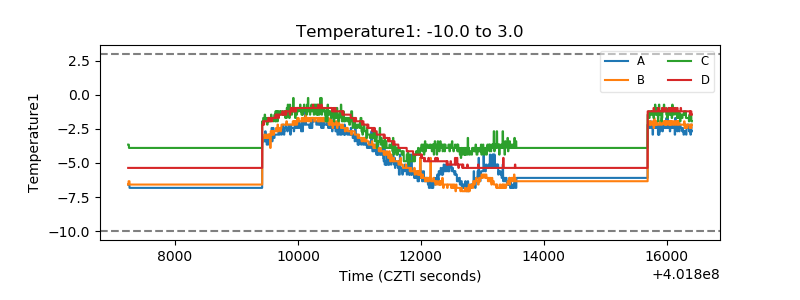 |
| Veto HV Monitor | 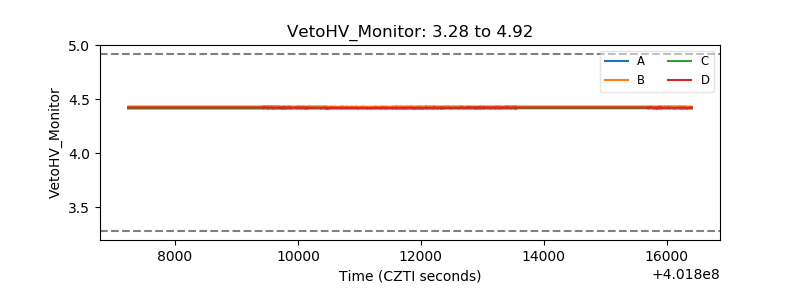 |
| Veto LLD | 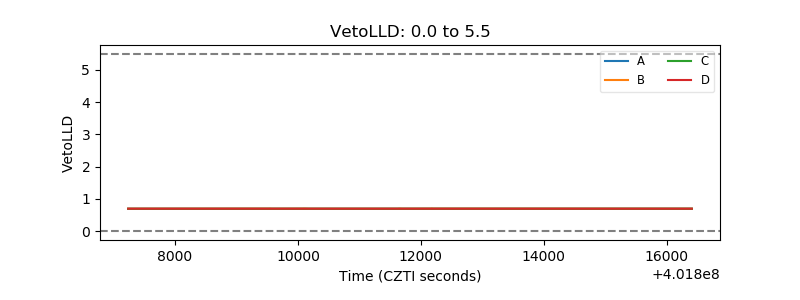 |
| Alpha Counter | 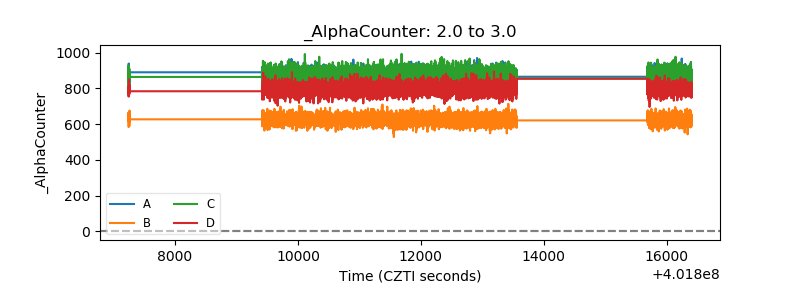 |
| _CPM_Rate | 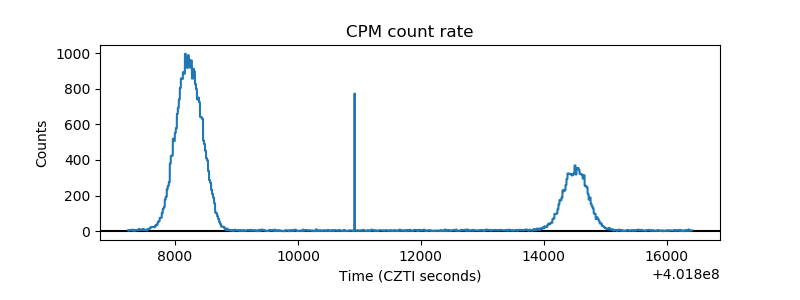 |
| CZT Counter | 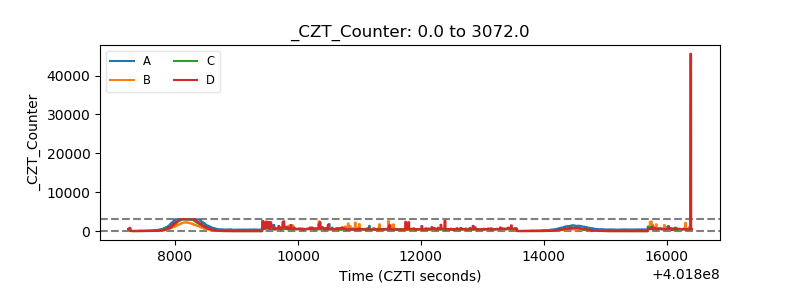 |
| +2.5 Volts monitor | 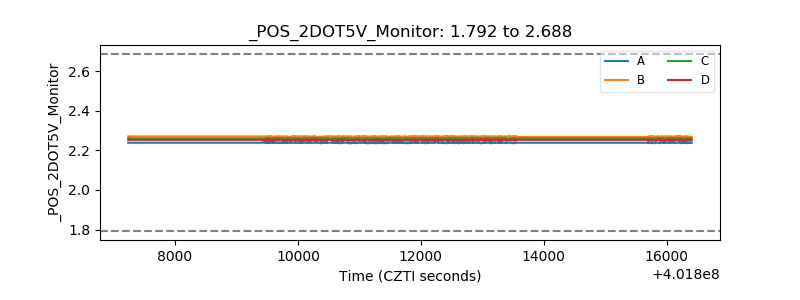 |
| +5 Volts monitor | 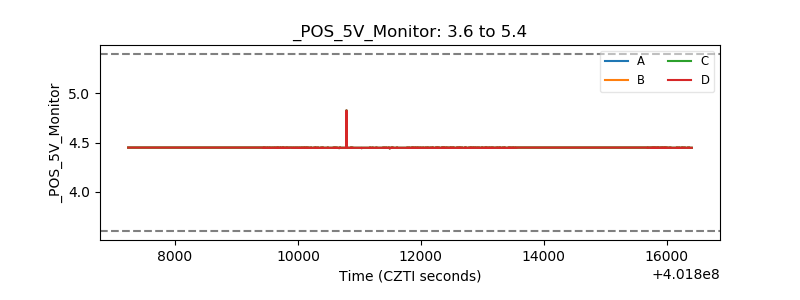 |
| _ROLL_ROT | 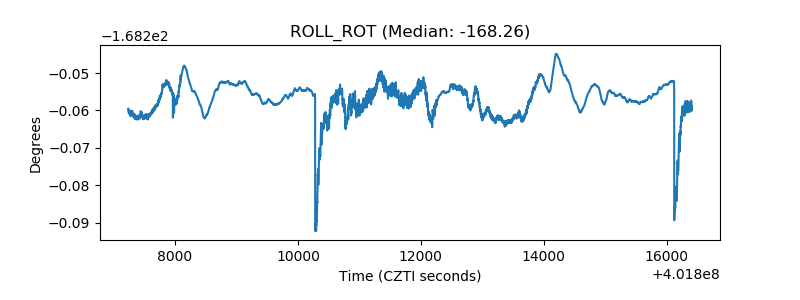 |
| _Roll_DEC | 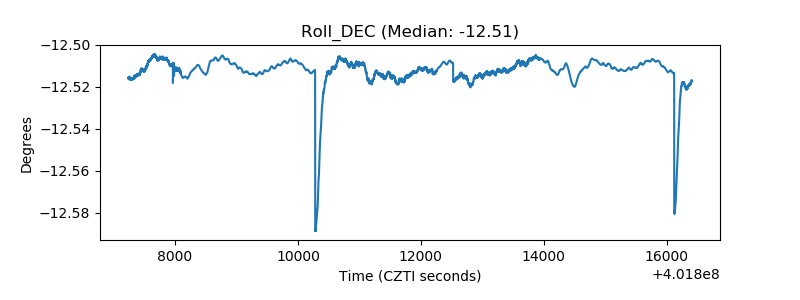 |
| _Roll_RA | 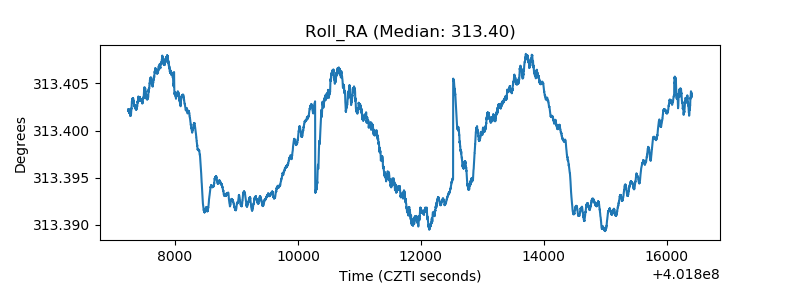 |
| Veto Counter | 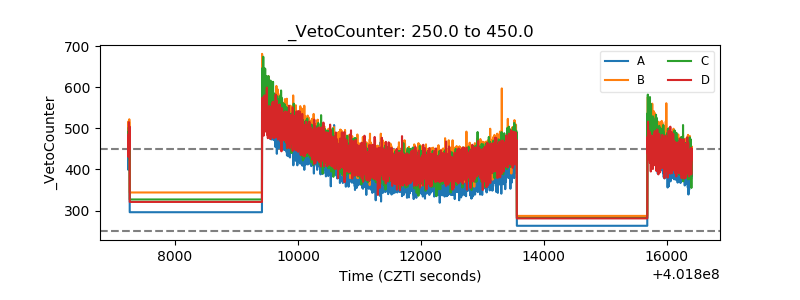 |