| Param | Original file | Final file |
|---|---|---|
| Filename | modeM0/AS1A10_103T06_9000005348_37813cztM0_level2.evt | modeM0/AS1A10_103T06_9000005348_37813cztM0_level2_quad_clean.evt |
| Size (bytes) | 198,650,880 | 35,173,440 |
| Size | 189.4 MB | 33.5 MB |
| Events in quadrant A | 1,129,230 | 244,625 |
| Events in quadrant B | 1,766,635 | 231,494 |
| Events in quadrant C | 932,655 | 248,513 |
| Events in quadrant D | 2,057,974 | 202,861 |
| Mode M9 | |||
|---|---|---|---|
| Quadrant | BADHDUFLAG | Total packets | Discarded packets |
| A | 0 | 3 | 0 |
| B | 0 | 3 | 0 |
| C | 0 | 3 | 0 |
| D | 0 | 4 | 0 |
| Mode M0 | |||
|---|---|---|---|
| Quadrant | BADHDUFLAG | Total packets | Discarded packets |
| A | 0 | 4570 | 1 |
| B | 0 | 6480 | 1 |
| C | 0 | 3919 | 1 |
| D | 0 | 7294 | 1 |
| Mode SS | |||
|---|---|---|---|
| Quadrant | BADHDUFLAG | Total packets | Discarded packets |
| A | 0 | 38 | 0 |
| B | 0 | 38 | 0 |
| C | 0 | 38 | 0 |
| D | 0 | 38 | 0 |
| Quadrant | Total seconds | Saturated seconds | Saturation percentage |
|---|---|---|---|
| A | 1876 | 26 | 1.385928% |
| B | 1876 | 284 | 15.138593% |
| C | 1876 | 7 | 0.373134% |
| D | 1876 | 431 | 22.974414% |
Noise dominated data is calculated using 1-second bins in cleaned event files. If a bin has >2000 counts, and if more than 50% of those come from <1% of pixels, then it is considered to be noise-dominated and hence unusable.
| Quadrant | # 1 sec bins | Bins with >0 counts | Bins with >2000 counts | High rate bins dominated by noise | Noise dominated (total time) | Noise dominated (detector-on time) | Marked lightcurve |
|---|---|---|---|---|---|---|---|
| A | 1876 | 1876 | 20 | 20 | 1.07% | 1.07% | 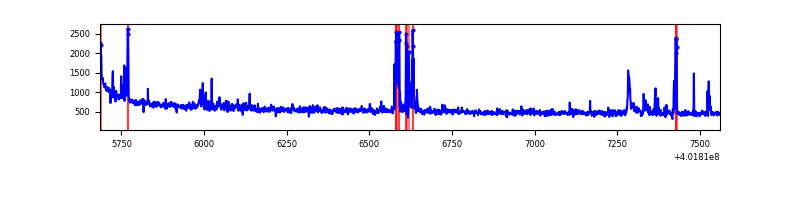 |
| B | 1876 | 1876 | 273 | 273 | 14.55% | 14.55% | 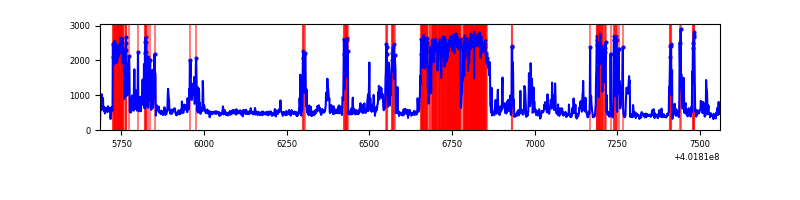 |
| C | 1876 | 1876 | 4 | 4 | 0.21% | 0.21% | 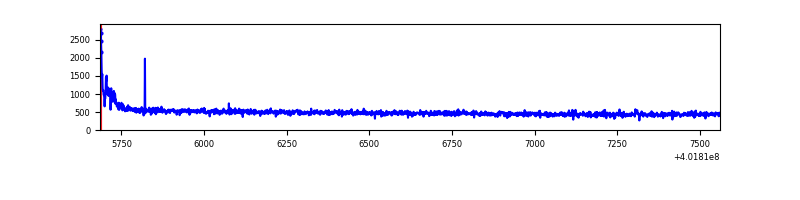 |
| D | 1876 | 1876 | 447 | 447 | 23.83% | 23.83% | 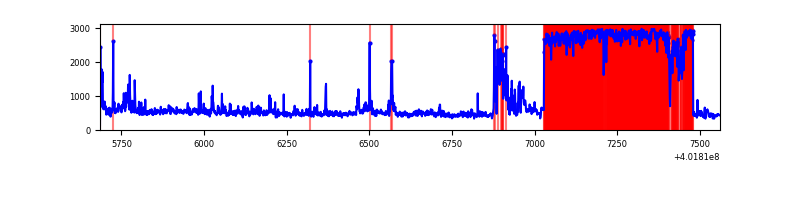 |
Top three noisy pixels from each quadrant. If the there are fewer than three noisy pixels in the level2.evt file, extra rows are filled as -1
| Pixel properties | Quadrant properties | ||||||
|---|---|---|---|---|---|---|---|
| Quadrant | DetID | PixID | Counts | Sigma | Mean | Median | Sigma |
| A | 10 | 83 | 147847 | 3221.5 | 218 | 213 | 45.8 |
| A | 9 | 143 | 105702 | 2301.86 | 218 | 213 | 45.8 |
| A | 15 | 222 | 8695 | 185.08 | 218 | 213 | 45.8 |
| B | 5 | 172 | 859617 | 21006.3 | 202 | 197 | 40.9 |
| B | 10 | 246 | 50585 | 1231.6 | 202 | 197 | 40.9 |
| B | 0 | 229 | 15913 | 384.14 | 202 | 197 | 40.9 |
| C | 15 | 214 | 87476 | 1759.63 | 206 | 208 | 49.6 |
| C | 0 | 10 | 35965 | 720.99 | 206 | 208 | 49.6 |
| C | 0 | 207 | 2067 | 37.48 | 206 | 208 | 49.6 |
| D | 13 | 249 | 1219349 | 26006.52 | 186 | 182 | 46.9 |
| D | 10 | 199 | 30165 | 639.58 | 186 | 182 | 46.9 |
| D | 2 | 249 | 19914 | 420.91 | 186 | 182 | 46.9 |
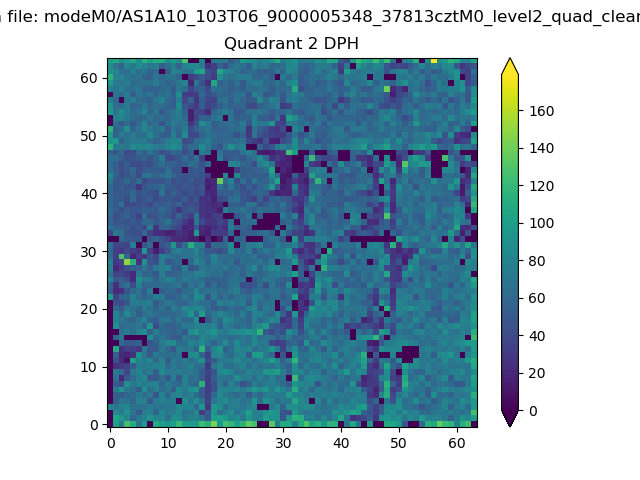
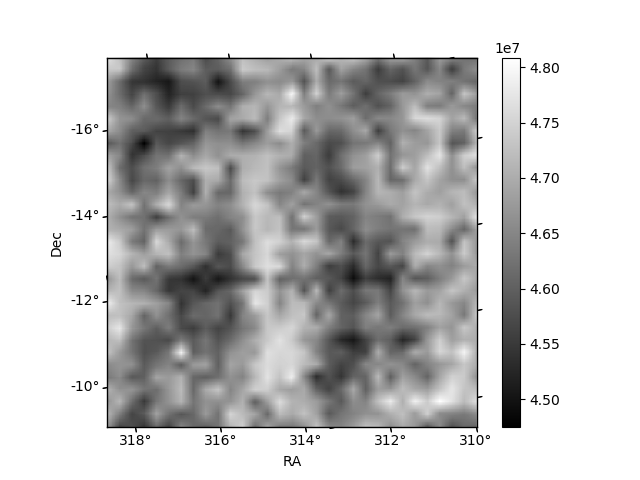
Histogram calculated using DETX and DETY for each event in the final _common_clean file
| Quadrant A | 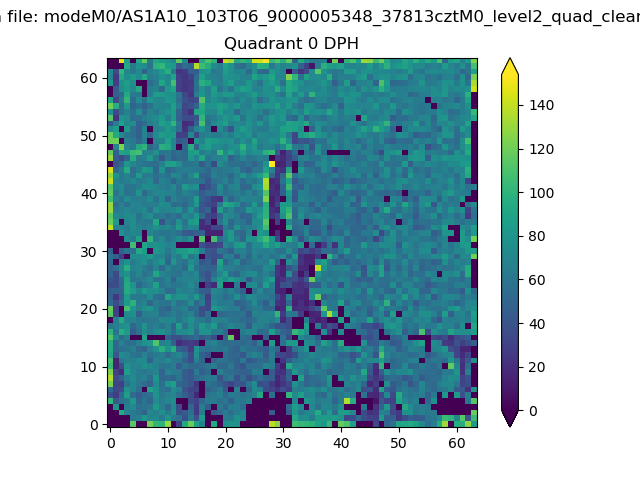 |
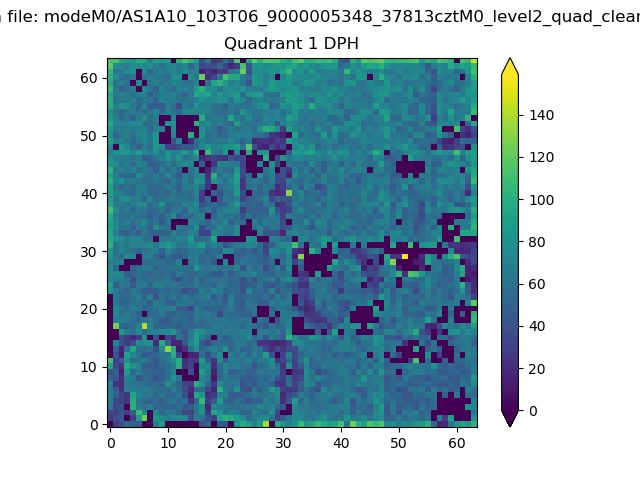 |
Quadrant B |
|---|---|---|---|
| Quadrant D | 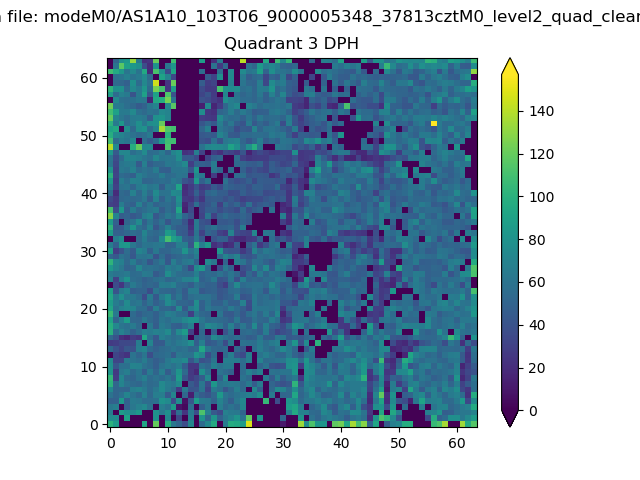 |
 |
Quadrant C |
| Plot type | Count rate plots | Images |
|---|---|---|
| Comparison with Poisson distribution Blue bars denote a histogram of data divided into 1 sec bins. Red curve is a Poisson curve with rate = median count rate of data. |
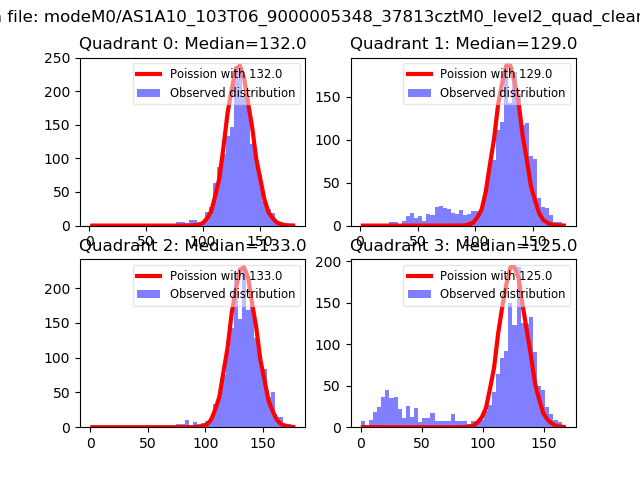 |
 |
| Quadrant-wise count rates Data is divided into 100 sec bins |
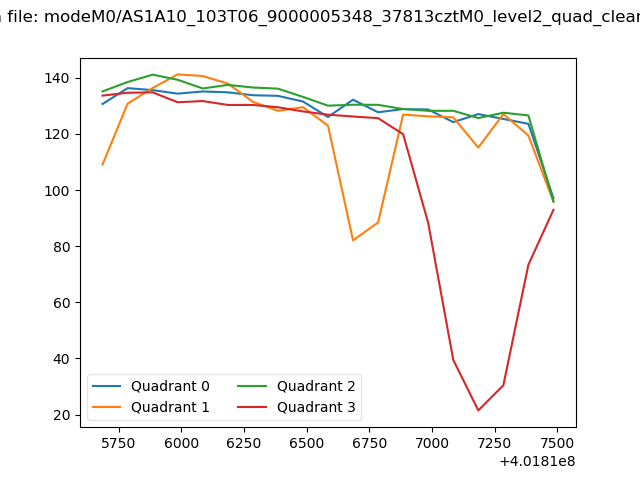 |
|
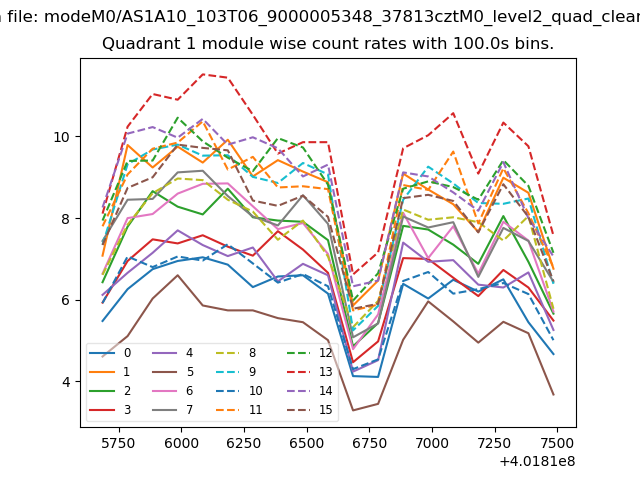
| Module-wise count rates for Quadrant A Data is divided into 100 sec bins |
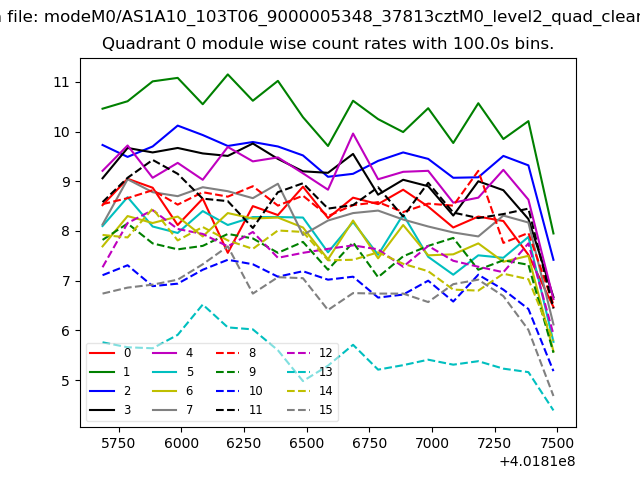 |
 |
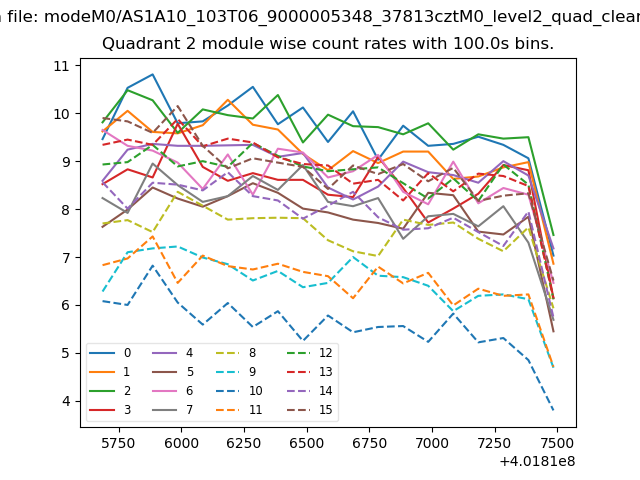
| Module-wise count rates for Quadrant B Data is divided into 100 sec bins |
 |
 |
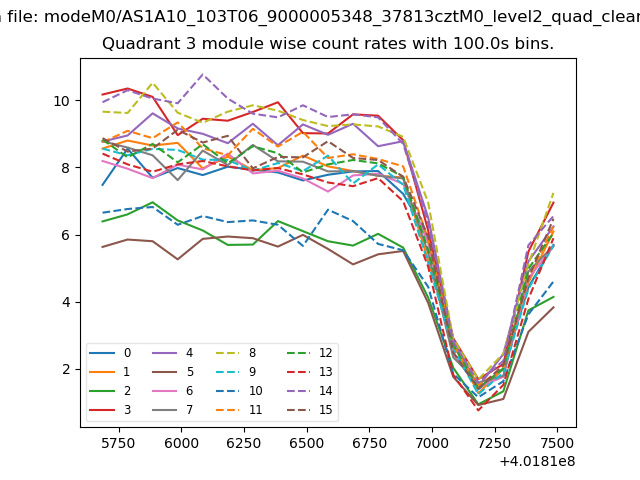
| Module-wise count rates for Quadrant C Data is divided into 100 sec bins |
 |
 |
| Module-wise count rates for Quadrant D Data is divided into 100 sec bins |
 |
 |
| Parameter | Plot |
|---|---|
| CZT HV Monitor | 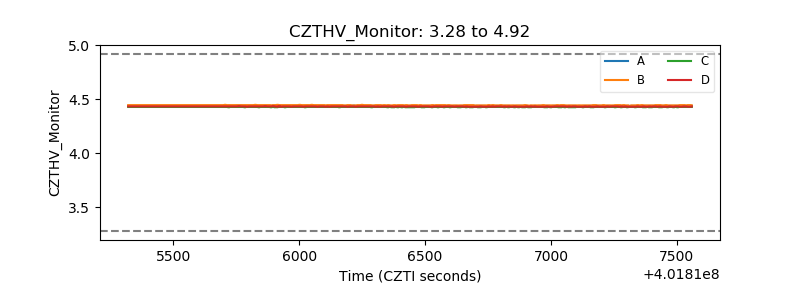 |
| D_VDD | 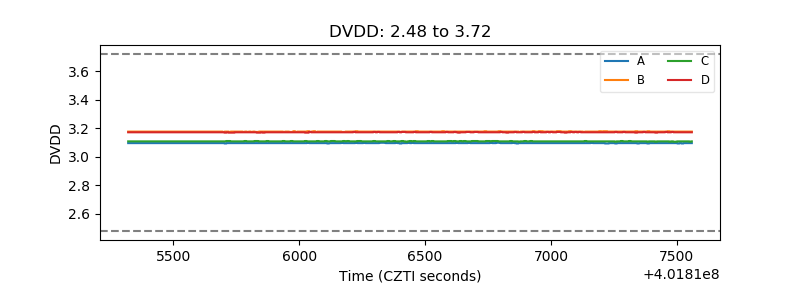 |
| Temperature 1 | 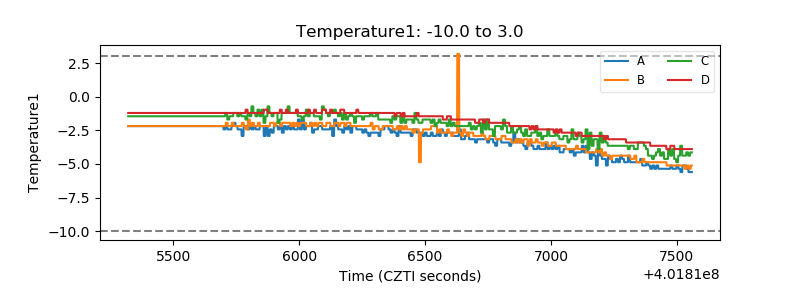 |
| Veto HV Monitor | 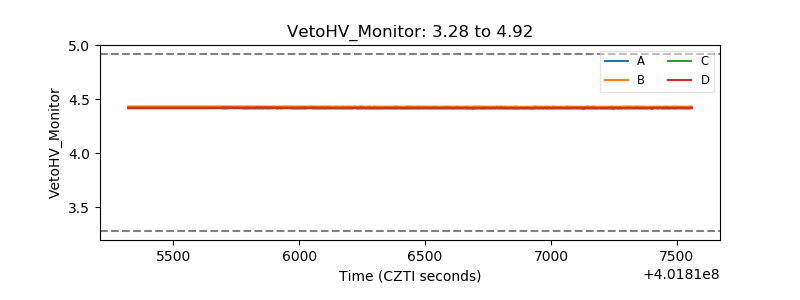 |
| Veto LLD | 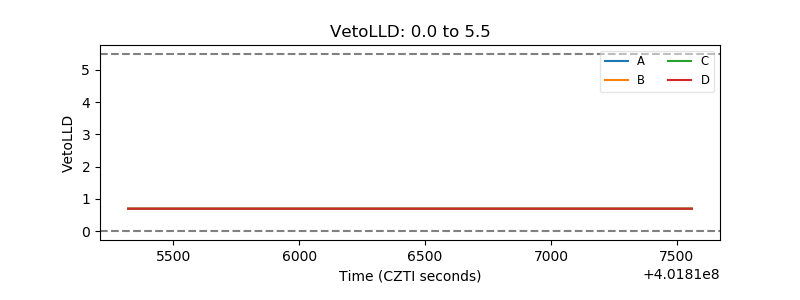 |
| Alpha Counter | 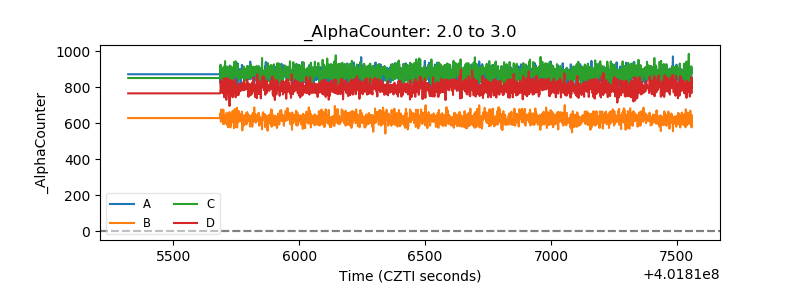 |
| _CPM_Rate | 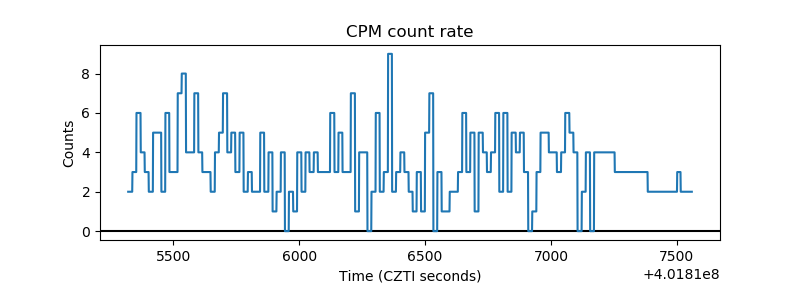 |
| CZT Counter | 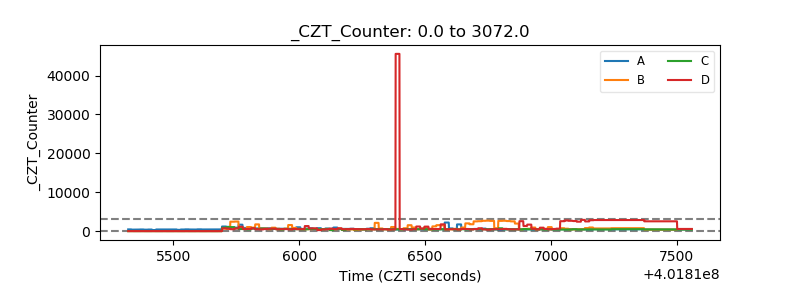 |
| +2.5 Volts monitor | 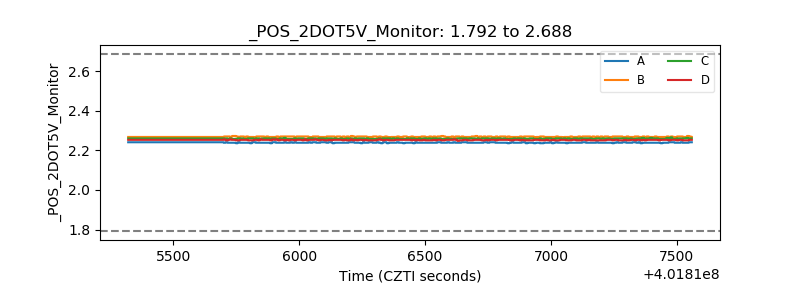 |
| +5 Volts monitor | 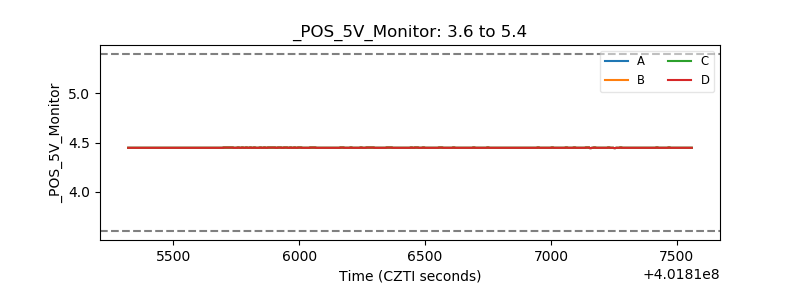 |
| _ROLL_ROT | 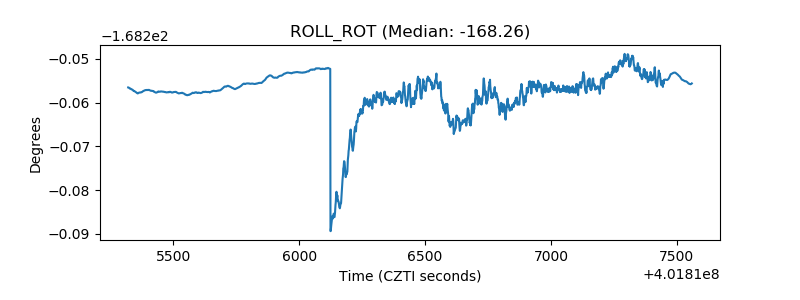 |
| _Roll_DEC | 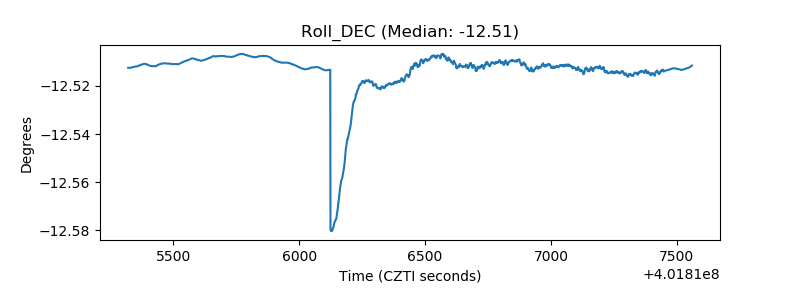 |
| _Roll_RA |  |
| Veto Counter | 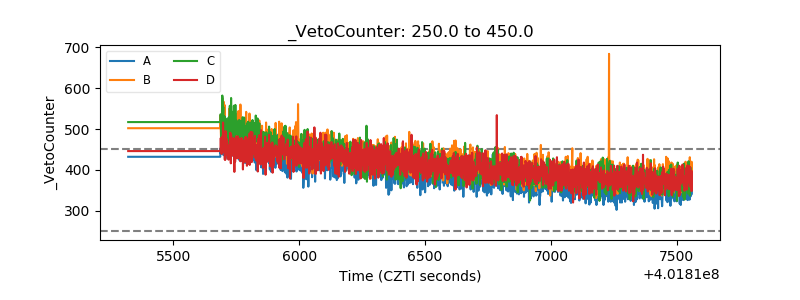 |