| Param | Original file | Final file |
|---|---|---|
| Filename | modeM0/AS1T05_054T01_9000005350cztM0_level2.fits | modeM0/AS1T05_054T01_9000005350cztM0_level2_quad_clean.evt |
| Size (bytes) | 553,314,240 | 602,282,880 |
| Size | 527.7 MB | 574.4 MB |
| Events in quadrant A | 3,404,472 | 3,752,346 |
| Events in quadrant B | 3,197,010 | 3,627,852 |
| Events in quadrant C | 3,298,156 | 3,640,005 |
| Events in quadrant D | 2,832,672 | 3,196,641 |
| Mode M9 | |||
|---|---|---|---|
| Quadrant | BADHDUFLAG | Total packets | Discarded packets |
| A | 0 | 221 | 0 |
| B | 0 | 221 | 0 |
| C | 0 | 221 | 0 |
| D | 0 | 221 | 0 |
| Mode SS | |||
|---|---|---|---|
| Quadrant | BADHDUFLAG | Total packets | Discarded packets |
| A | 0 | 1200 | 0 |
| B | 0 | 1200 | 0 |
| C | 0 | 1200 | 0 |
| D | 0 | 1200 | 0 |
| Mode M0 | |||
|---|---|---|---|
| Quadrant | BADHDUFLAG | Total packets | Discarded packets |
| A | 0 | 126719 | 0 |
| B | 0 | 149496 | 0 |
| C | 0 | 125607 | 0 |
| D | 0 | 158015 | 0 |
| Quadrant | Total seconds | Saturated seconds | Saturation percentage |
|---|---|---|---|
| A | 58656 | 233 | 0.397231% |
| B | 58656 | 1892 | 3.225586% |
| C | 58656 | 281 | 0.479064% |
| D | 58656 | 2841 | 4.843494% |
Noise dominated data is calculated using 1-second bins in cleaned event files. If a bin has >2000 counts, and if more than 50% of those come from <1% of pixels, then it is considered to be noise-dominated and hence unusable.
| Quadrant | # 1 sec bins | Bins with >0 counts | Bins with >2000 counts | High rate bins dominated by noise | Noise dominated (total time) | Noise dominated (detector-on time) | Marked lightcurve |
|---|---|---|---|---|---|---|---|
| A | 80795 | 58648 | 0 | 0 | 0.00% | 0.00% | 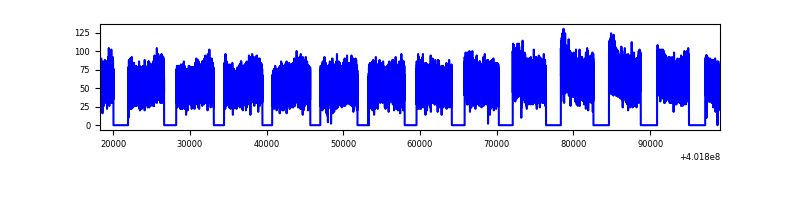 |
| B | 80795 | 58621 | 0 | 0 | 0.00% | 0.00% | 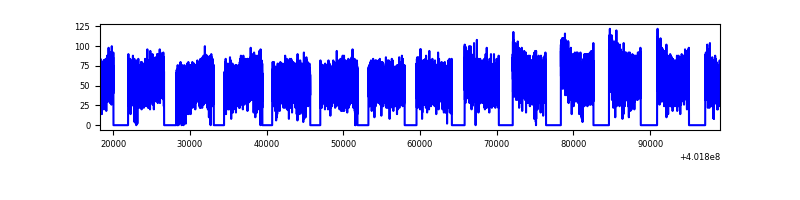 |
| C | 80795 | 58648 | 0 | 0 | 0.00% | 0.00% |  |
| D | 80795 | 58577 | 0 | 0 | 0.00% | 0.00% | 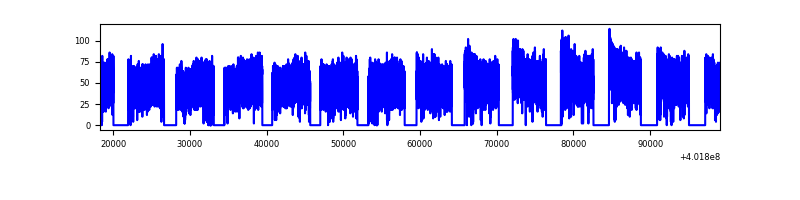 |
Top three noisy pixels from each quadrant. If the there are fewer than three noisy pixels in the level2.evt file, extra rows are filled as -1
| Pixel properties | Quadrant properties | ||||||
|---|---|---|---|---|---|---|---|
| Quadrant | DetID | PixID | Counts | Sigma | Mean | Median | Sigma |
| A | 0 | 29 | 2870 | 9.35 | 891 | 841 | 216.9 |
| A | 7 | 110 | 2736 | 8.74 | 891 | 841 | 216.9 |
| A | 9 | 19 | 2724 | 8.68 | 891 | 841 | 216.9 |
| B | 2 | 9 | 2680 | 11.45 | 847 | 815 | 162.9 |
| B | 3 | 80 | 2429 | 9.91 | 847 | 815 | 162.9 |
| B | 5 | 128 | 2236 | 8.72 | 847 | 815 | 162.9 |
| C | 1 | 81 | 2860 | 9.23 | 872 | 822 | 220.9 |
| C | 1 | 80 | 2726 | 8.62 | 872 | 822 | 220.9 |
| C | 3 | 202 | 2662 | 8.33 | 872 | 822 | 220.9 |
| D | 4 | 160 | 2197 | 6.7 | 811 | 742 | 217.1 |
| D | 6 | 62 | 2084 | 6.18 | 811 | 742 | 217.1 |
| D | 10 | 189 | 2076 | 6.15 | 811 | 742 | 217.1 |
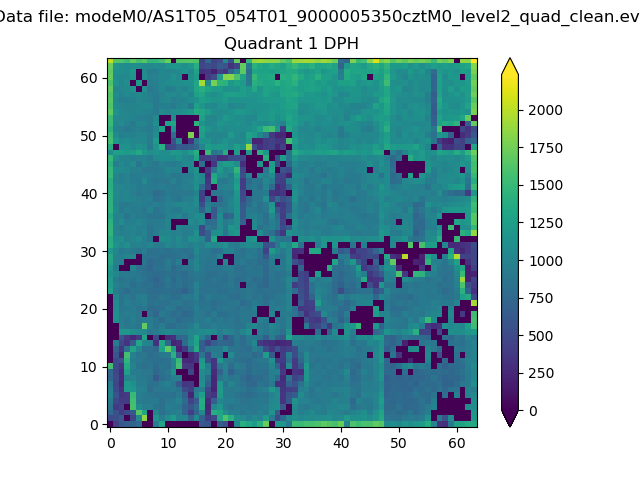
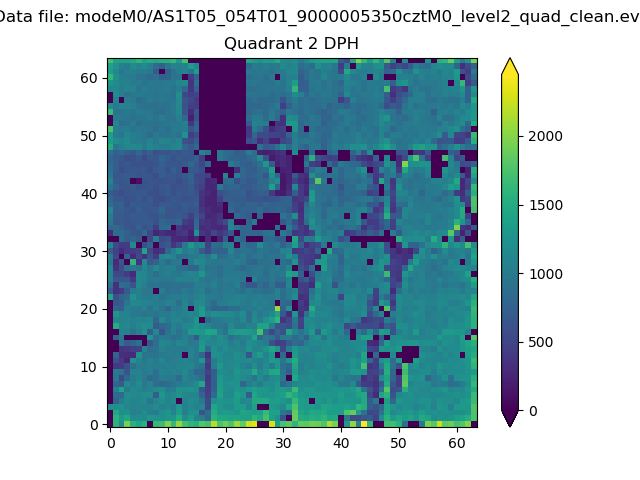
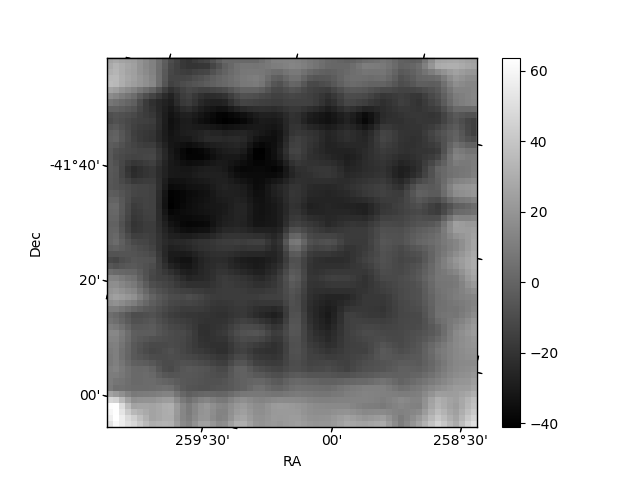
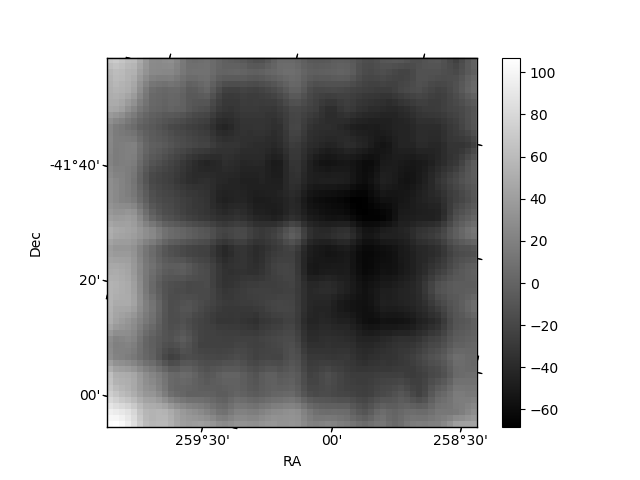
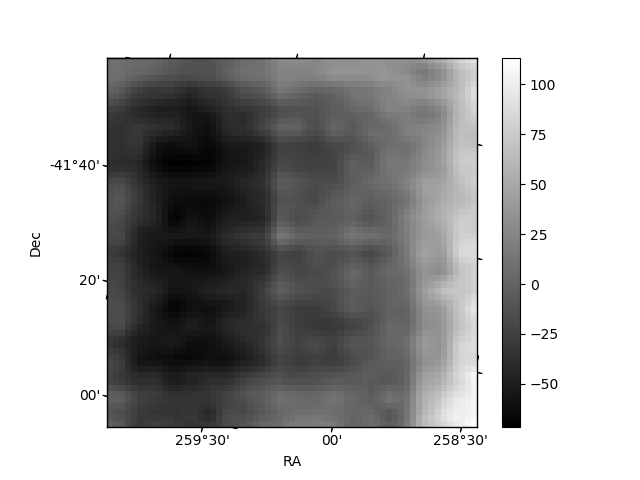
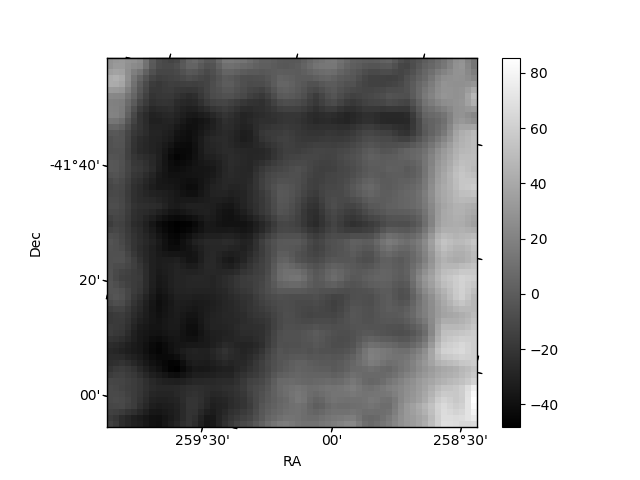
Histogram calculated using DETX and DETY for each event in the final _common_clean file
| Quadrant A | 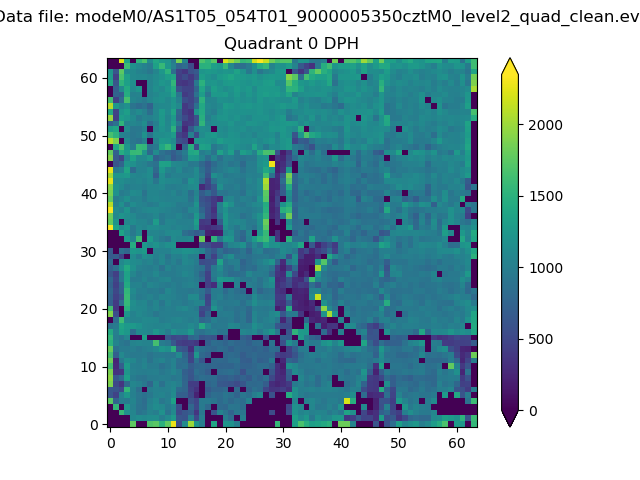 |
 |
Quadrant B |
|---|---|---|---|
| Quadrant D | 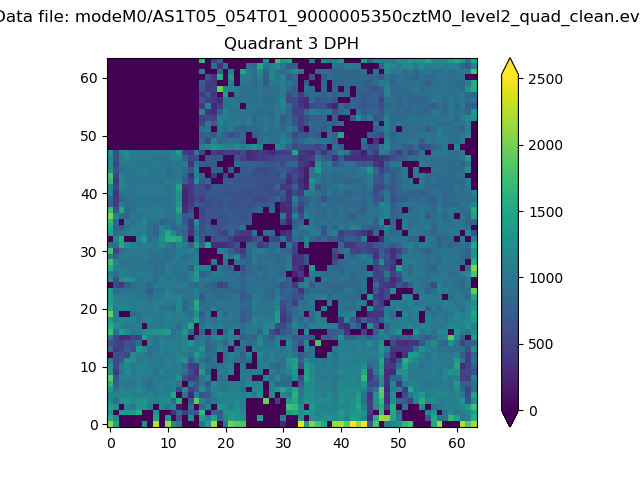 |
 |
Quadrant C |
| Plot type | Count rate plots | Images |
|---|---|---|
| Comparison with Poisson distribution Blue bars denote a histogram of data divided into 1 sec bins. Red curve is a Poisson curve with rate = median count rate of data. |
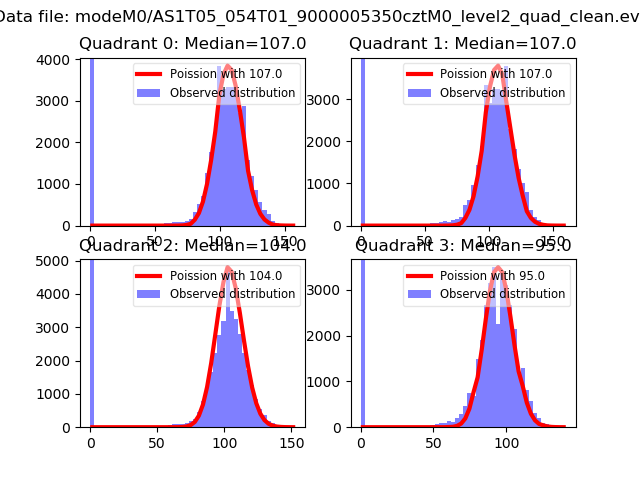 |
 |
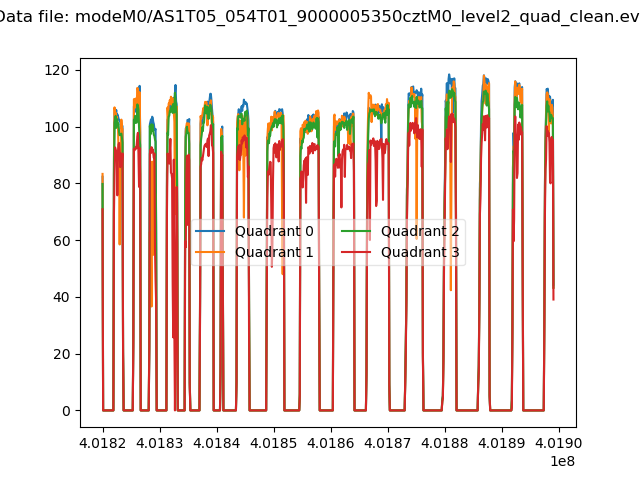
| Quadrant-wise count rates Data is divided into 100 sec bins |
 |
|
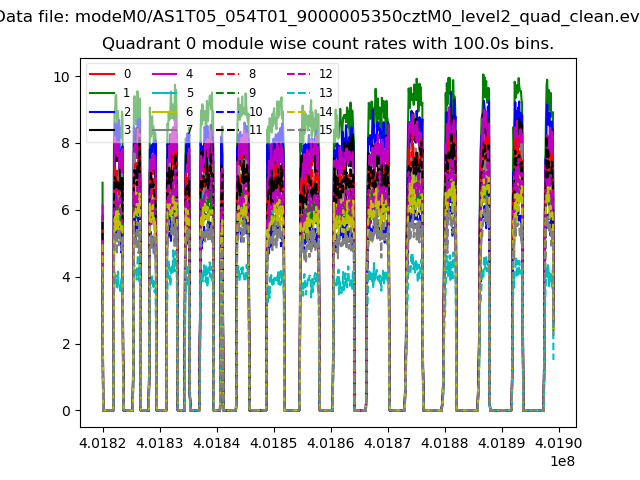
| Module-wise count rates for Quadrant A Data is divided into 100 sec bins |
 |
 |
| Module-wise count rates for Quadrant B Data is divided into 100 sec bins |
 |
 |
| Module-wise count rates for Quadrant C Data is divided into 100 sec bins |
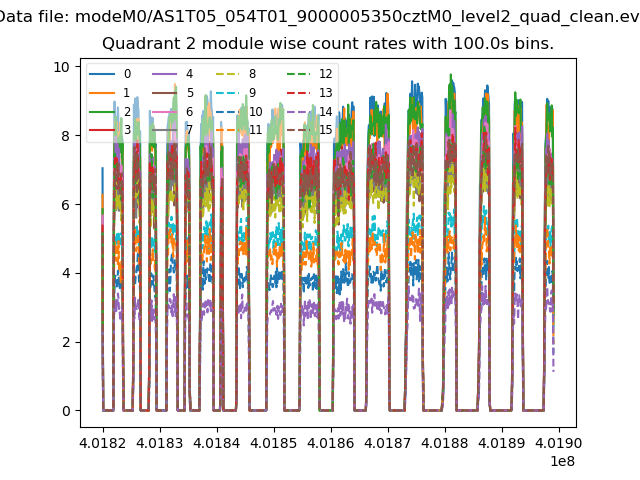 |
 |
| Module-wise count rates for Quadrant D Data is divided into 100 sec bins |
 |
 |
| Parameter | Plot |
|---|---|
| CZT HV Monitor |  |
| D_VDD | 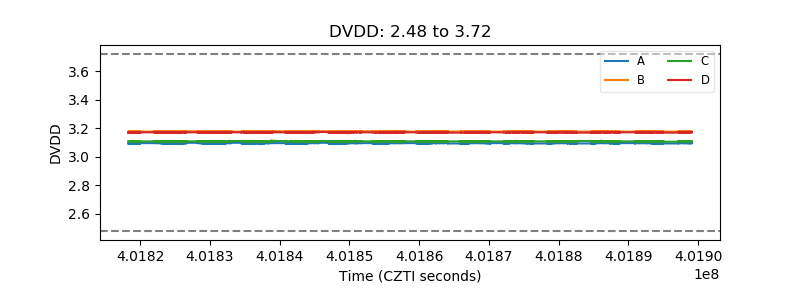 |
| Temperature 1 | 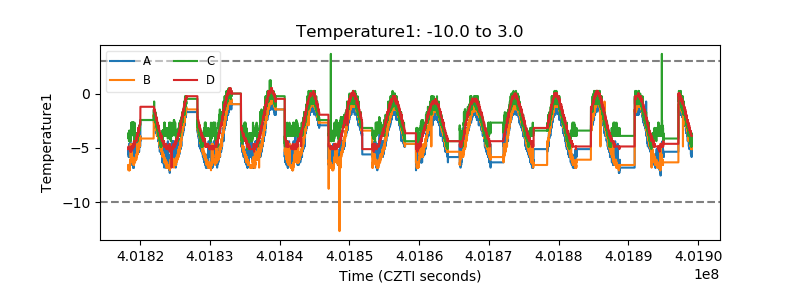 |
| Veto HV Monitor | 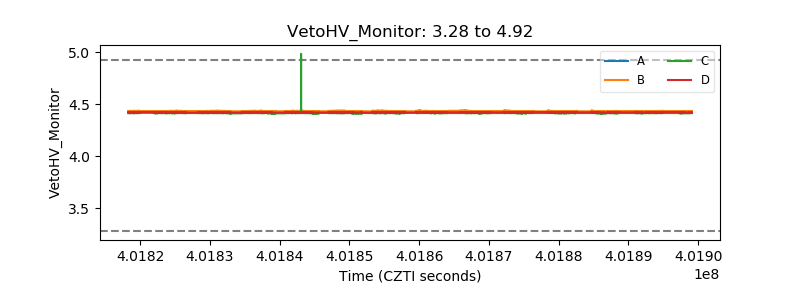 |
| Veto LLD | 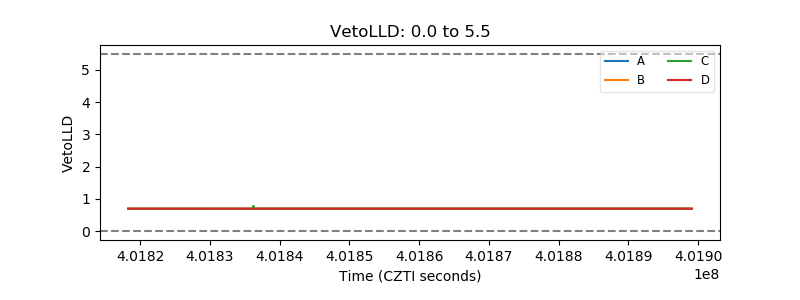 |
| Alpha Counter | 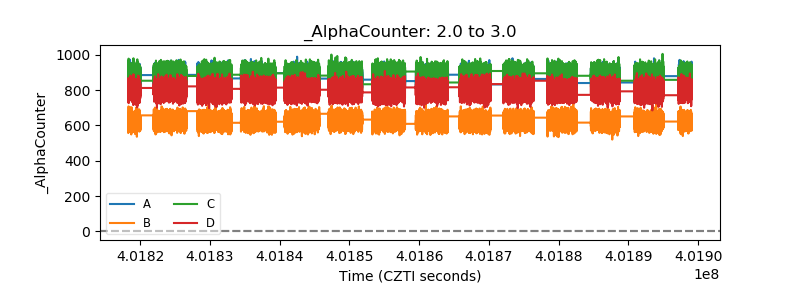 |
| _CPM_Rate |  |
| CZT Counter | 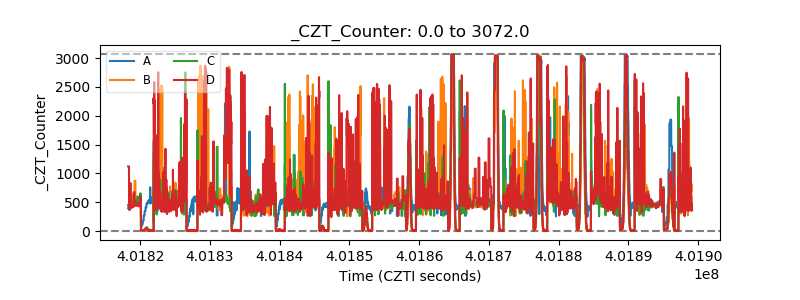 |
| +2.5 Volts monitor | 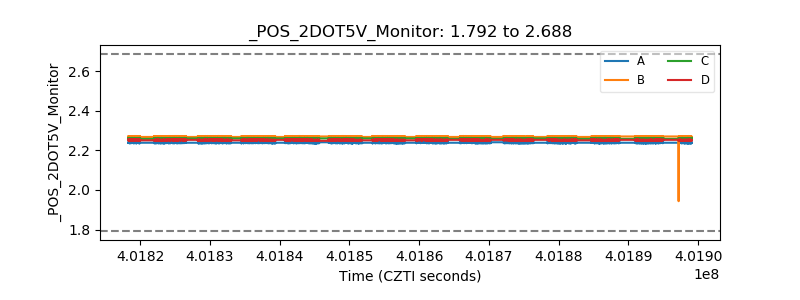 |
| +5 Volts monitor | 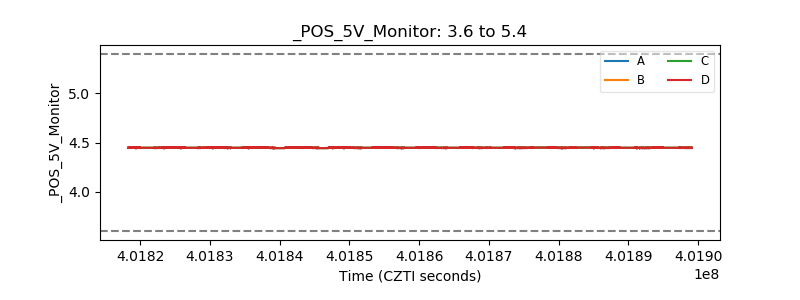 |
| _ROLL_ROT | 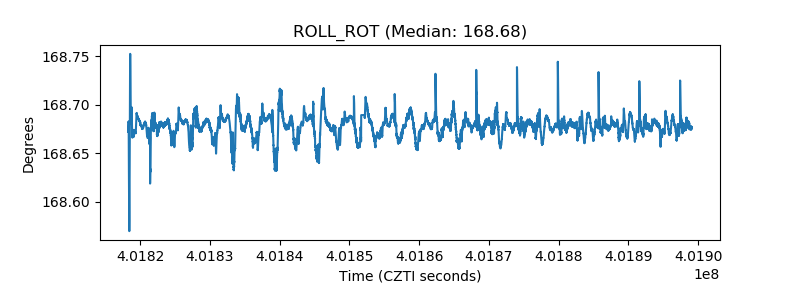 |
| _Roll_DEC | 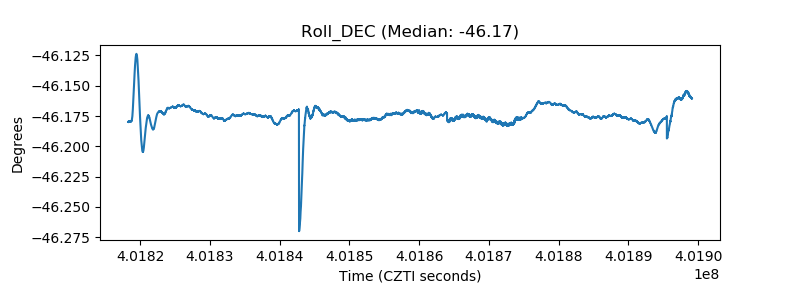 |
| _Roll_RA | 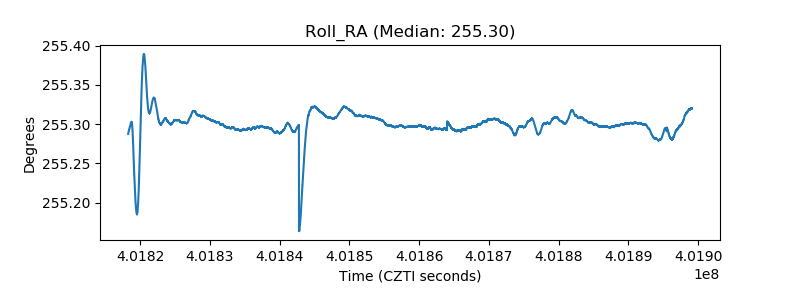 |
| Veto Counter |  |