| Param | Original file | Final file |
|---|---|---|
| Filename | modeM0/AS1T05_054T01_9000005350_37813cztM0_level2.evt | modeM0/AS1T05_054T01_9000005350_37813cztM0_level2_quad_clean.evt |
| Size (bytes) | 206,256,960 | 26,858,880 |
| Size | 196.7 MB | 25.6 MB |
| Events in quadrant A | 1,386,078 | 159,970 |
| Events in quadrant B | 1,410,061 | 162,210 |
| Events in quadrant C | 1,347,459 | 160,606 |
| Events in quadrant D | 1,929,929 | 149,187 |
| Mode M9 | |||
|---|---|---|---|
| Quadrant | BADHDUFLAG | Total packets | Discarded packets |
| A | 0 | 19 | 0 |
| B | 0 | 19 | 0 |
| C | 0 | 19 | 0 |
| D | 0 | 19 | 0 |
| Mode SS | |||
|---|---|---|---|
| Quadrant | BADHDUFLAG | Total packets | Discarded packets |
| A | 0 | 54 | 0 |
| B | 0 | 54 | 0 |
| C | 0 | 54 | 0 |
| D | 0 | 54 | 0 |
| Mode M0 | |||
|---|---|---|---|
| Quadrant | BADHDUFLAG | Total packets | Discarded packets |
| A | 0 | 5586 | 2 |
| B | 0 | 5705 | 1 |
| C | 0 | 5453 | 1 |
| D | 0 | 7348 | 1 |
| Quadrant | Total seconds | Saturated seconds | Saturation percentage |
|---|---|---|---|
| A | 2512 | 11 | 0.437898% |
| B | 2512 | 18 | 0.716561% |
| C | 2512 | 13 | 0.517516% |
| D | 2512 | 182 | 7.245223% |
Noise dominated data is calculated using 1-second bins in cleaned event files. If a bin has >2000 counts, and if more than 50% of those come from <1% of pixels, then it is considered to be noise-dominated and hence unusable.
| Quadrant | # 1 sec bins | Bins with >0 counts | Bins with >2000 counts | High rate bins dominated by noise | Noise dominated (total time) | Noise dominated (detector-on time) | Marked lightcurve |
|---|---|---|---|---|---|---|---|
| A | 4425 | 2513 | 7 | 7 | 0.16% | 0.28% | 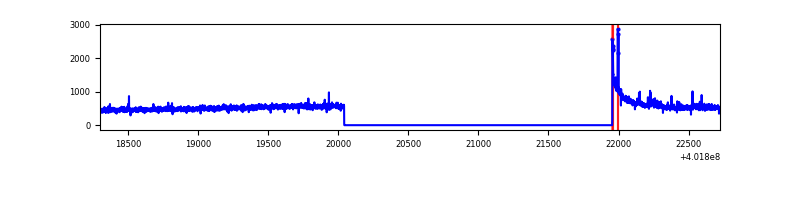 |
| B | 4425 | 2513 | 12 | 12 | 0.27% | 0.48% | 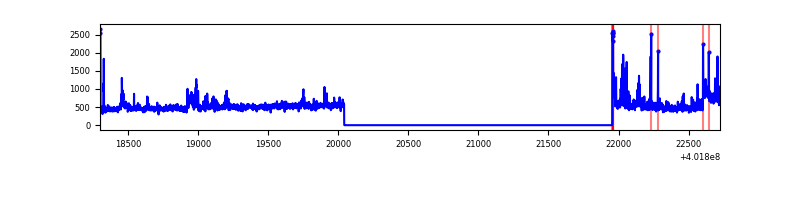 |
| C | 4425 | 2513 | 14 | 14 | 0.32% | 0.56% | 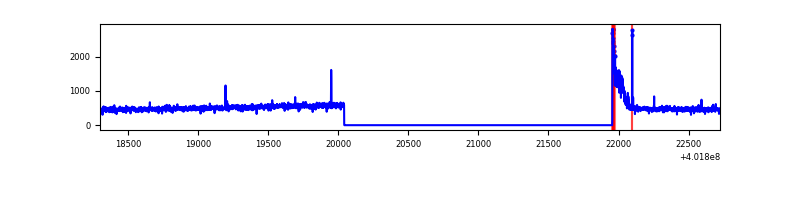 |
| D | 4425 | 2513 | 184 | 184 | 4.16% | 7.32% | 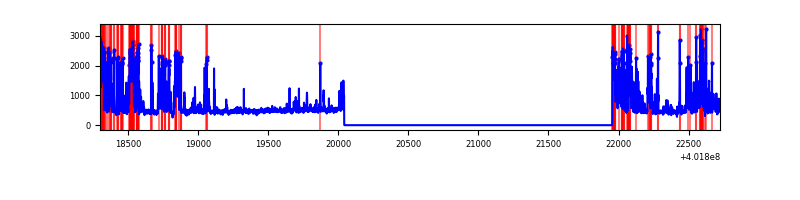 |
Top three noisy pixels from each quadrant. If the there are fewer than three noisy pixels in the level2.evt file, extra rows are filled as -1
| Pixel properties | Quadrant properties | ||||||
|---|---|---|---|---|---|---|---|
| Quadrant | DetID | PixID | Counts | Sigma | Mean | Median | Sigma |
| A | 10 | 83 | 169444 | 2718.02 | 298 | 293 | 62.2 |
| A | 15 | 222 | 28128 | 447.27 | 298 | 293 | 62.2 |
| A | 9 | 143 | 18654 | 295.04 | 298 | 293 | 62.2 |
| B | 0 | 189 | 68269 | 1170.92 | 296 | 288 | 58.1 |
| B | 0 | 229 | 43723 | 748.13 | 296 | 288 | 58.1 |
| B | 5 | 172 | 38413 | 656.67 | 296 | 288 | 58.1 |
| C | 15 | 214 | 114007 | 1649.94 | 288 | 290 | 68.9 |
| C | 0 | 10 | 90666 | 1311.28 | 288 | 290 | 68.9 |
| C | 0 | 207 | 13395 | 190.14 | 288 | 290 | 68.9 |
| D | 13 | 249 | 284921 | 4033.04 | 280 | 272 | 70.6 |
| D | 12 | 233 | 239090 | 3383.69 | 280 | 272 | 70.6 |
| D | 2 | 249 | 152732 | 2160.13 | 280 | 272 | 70.6 |
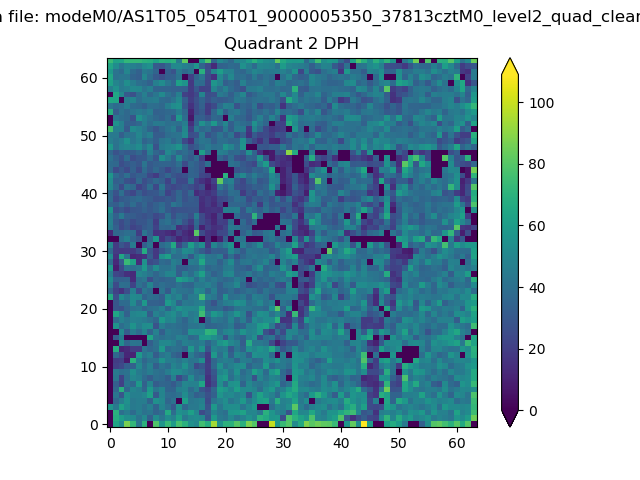
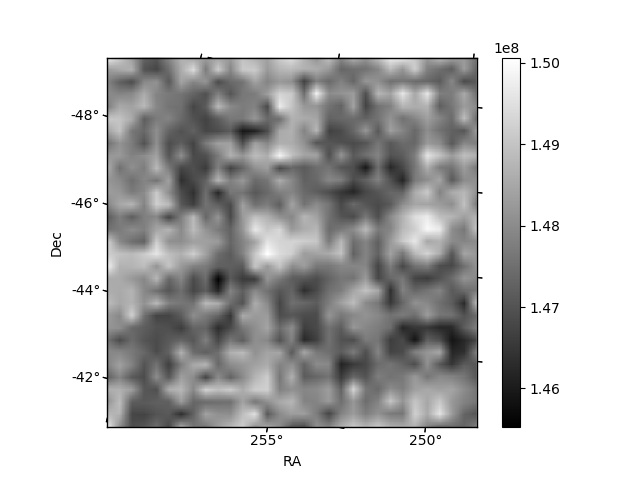
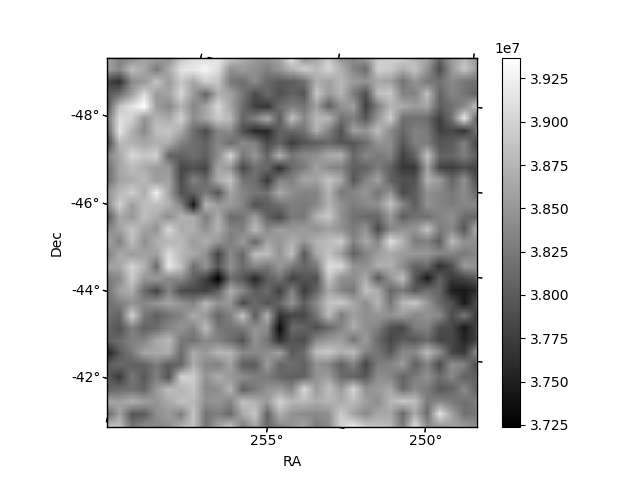
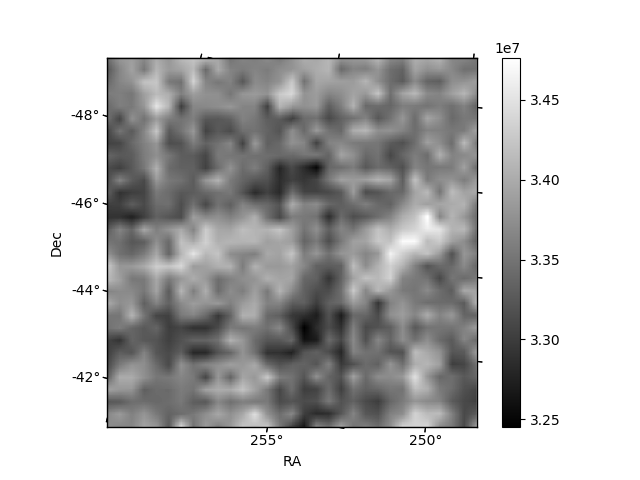
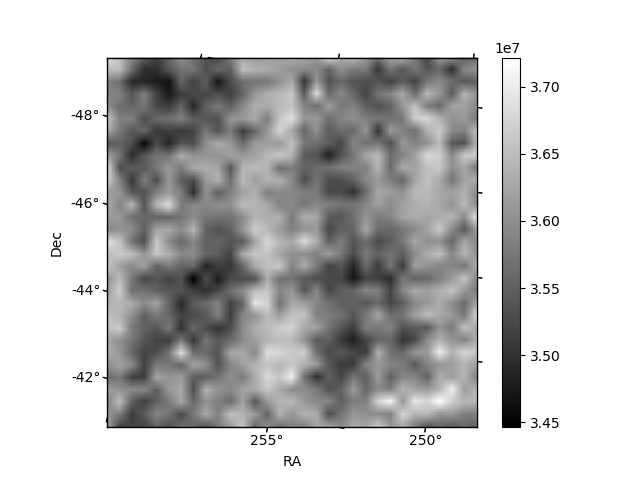
Histogram calculated using DETX and DETY for each event in the final _common_clean file
| Quadrant A | 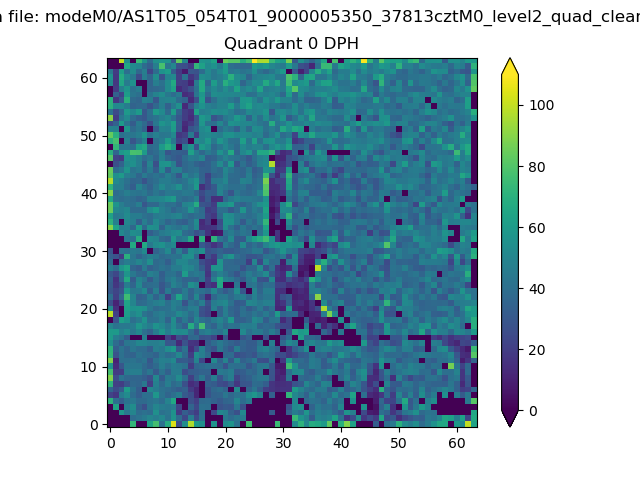 |
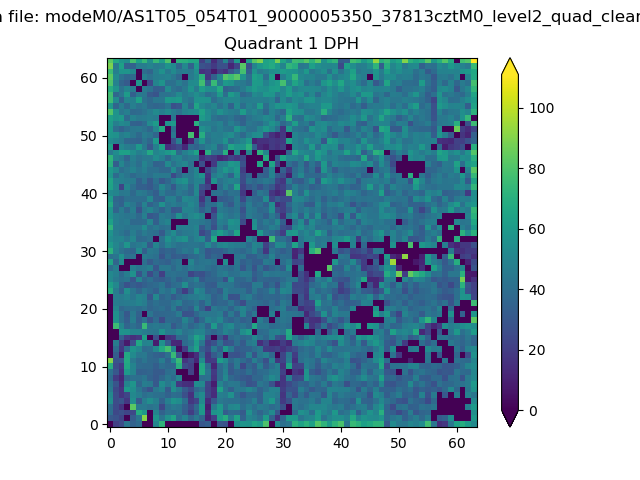 |
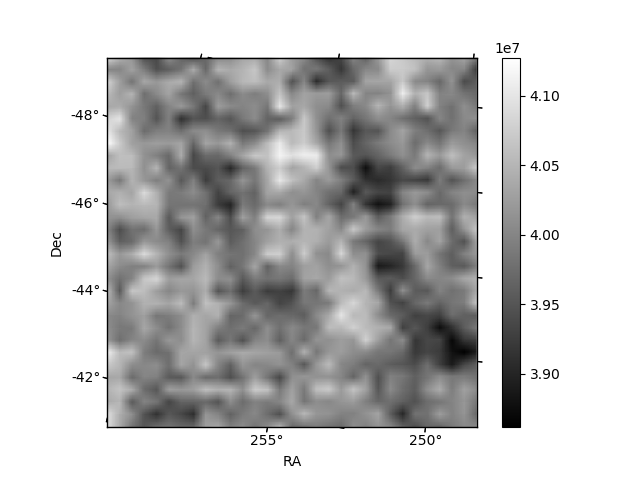
Quadrant B |
|---|---|---|---|
| Quadrant D | 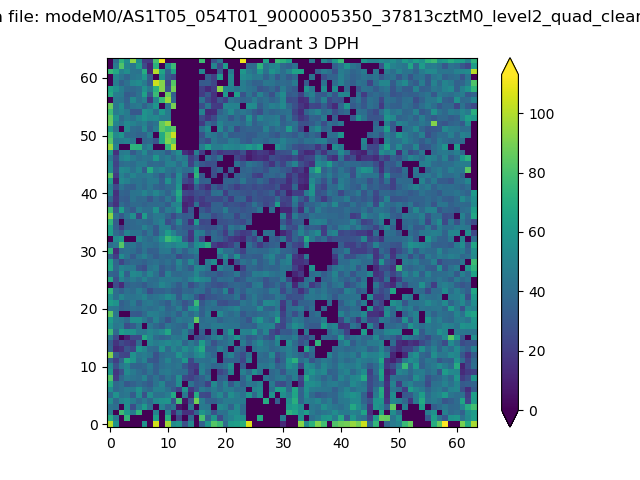 |
 |
Quadrant C |
| Plot type | Count rate plots | Images |
|---|---|---|
| Comparison with Poisson distribution Blue bars denote a histogram of data divided into 1 sec bins. Red curve is a Poisson curve with rate = median count rate of data. |
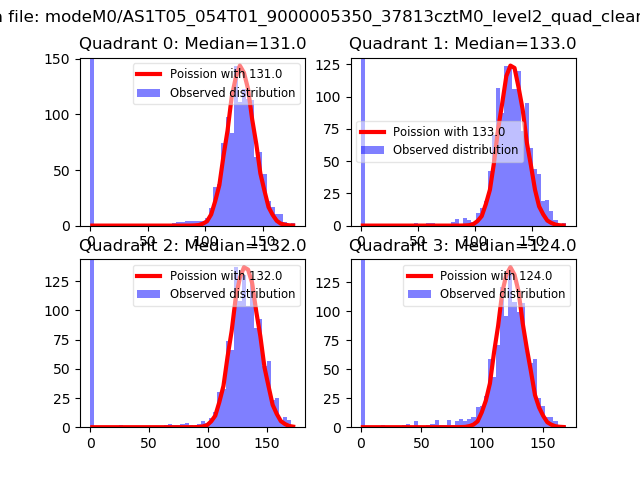 |
 |
| Quadrant-wise count rates Data is divided into 100 sec bins |
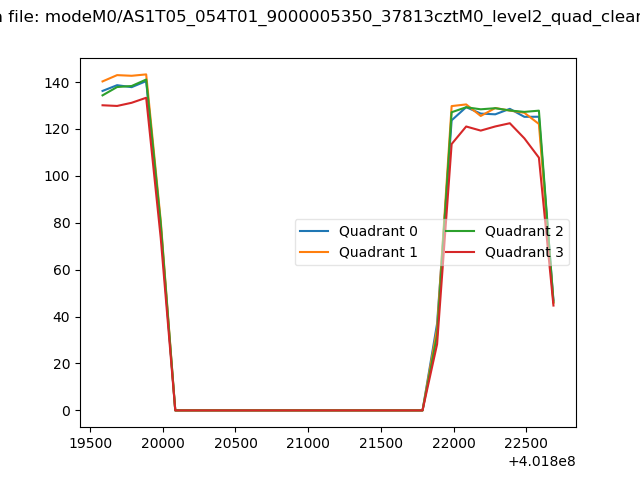 |
|
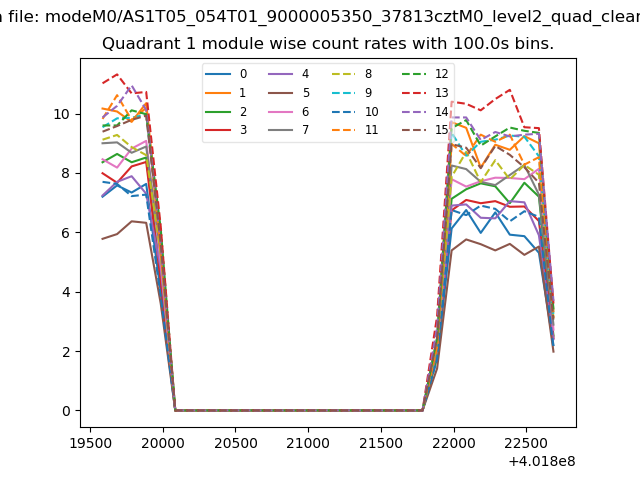
| Module-wise count rates for Quadrant A Data is divided into 100 sec bins |
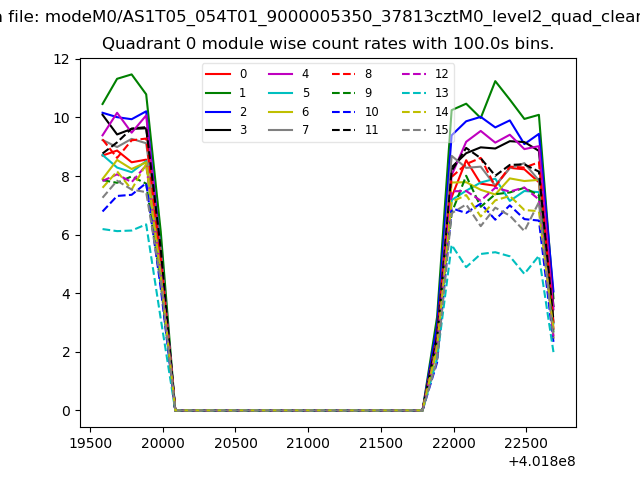 |
 |
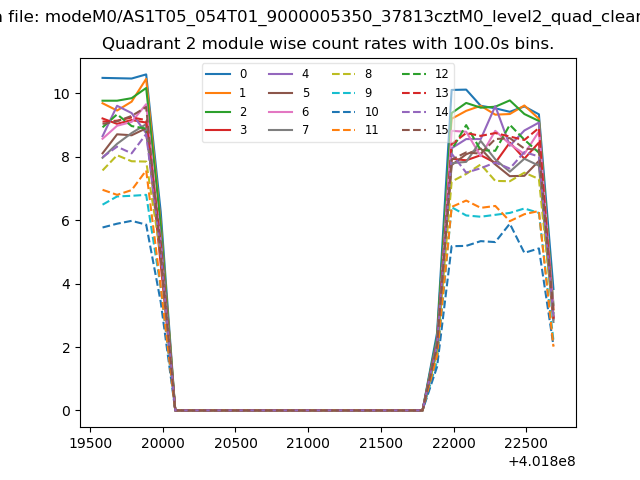
| Module-wise count rates for Quadrant B Data is divided into 100 sec bins |
 |
 |
| Module-wise count rates for Quadrant C Data is divided into 100 sec bins |
 |
 |
| Module-wise count rates for Quadrant D Data is divided into 100 sec bins |
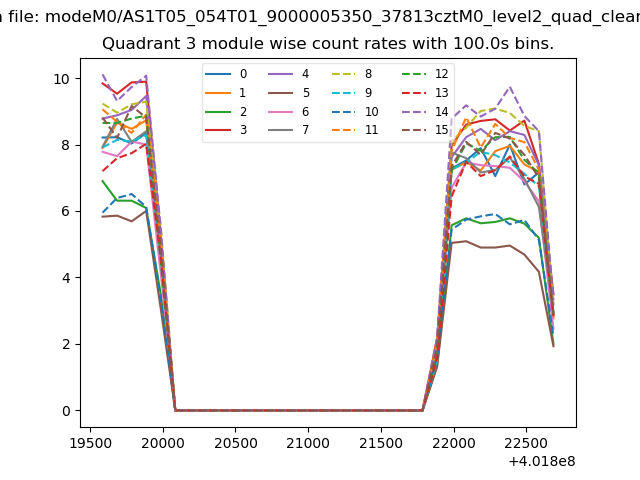 |
 |
| Parameter | Plot |
|---|---|
| CZT HV Monitor | 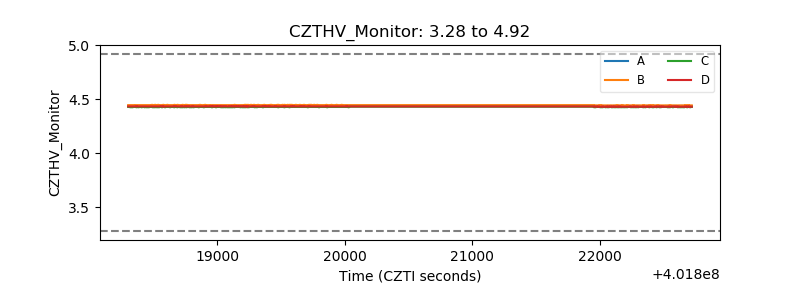 |
| D_VDD | 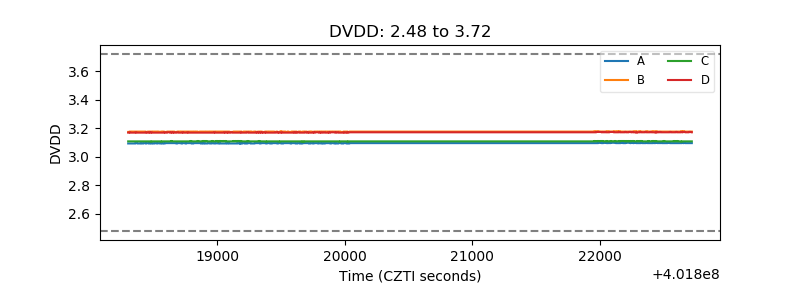 |
| Temperature 1 | 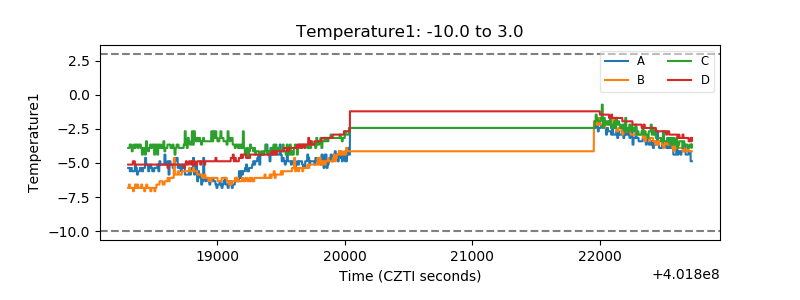 |
| Veto HV Monitor | 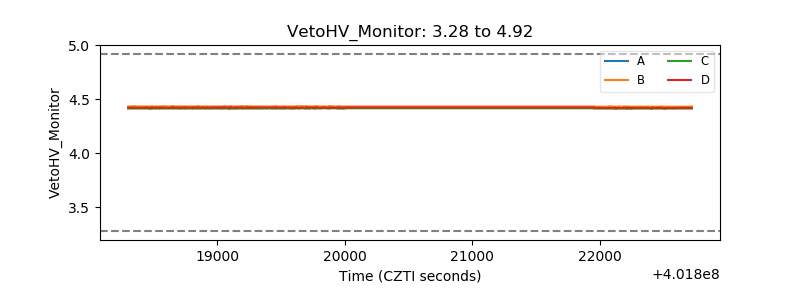 |
| Veto LLD | 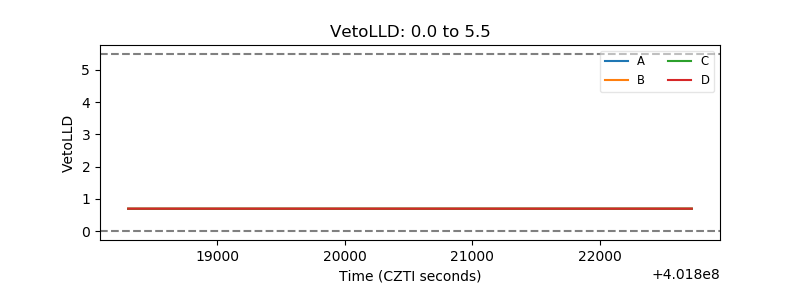 |
| Alpha Counter | 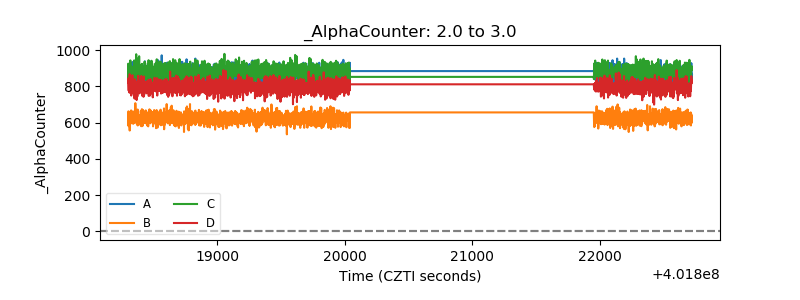 |
| _CPM_Rate | 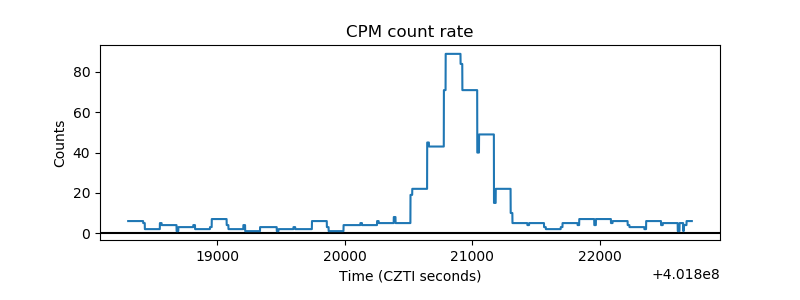 |
| CZT Counter | 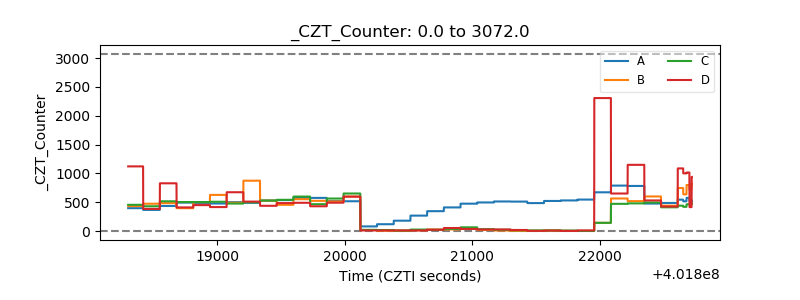 |
| +2.5 Volts monitor | 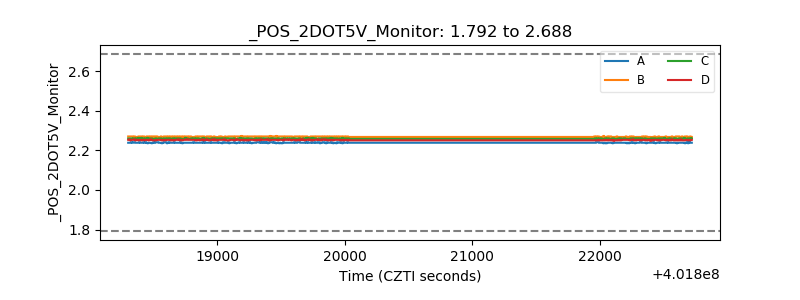 |
| +5 Volts monitor | 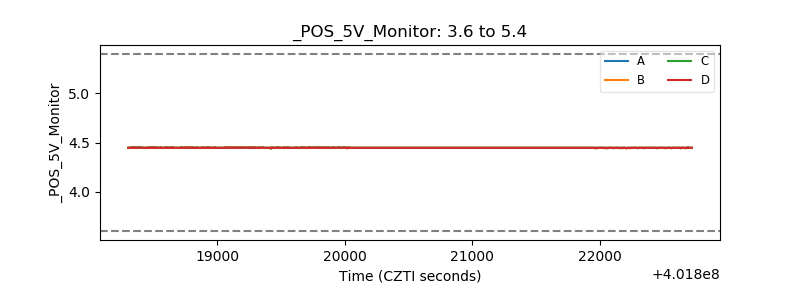 |
| _ROLL_ROT | 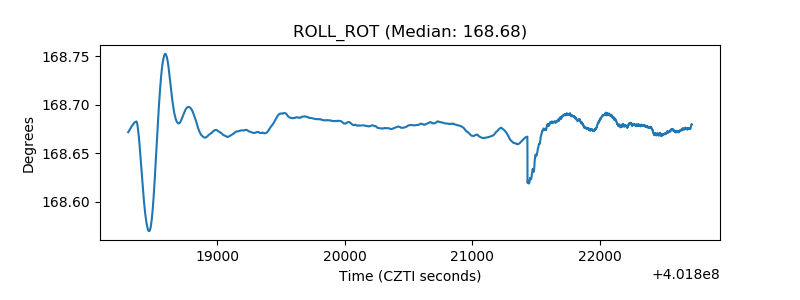 |
| _Roll_DEC | 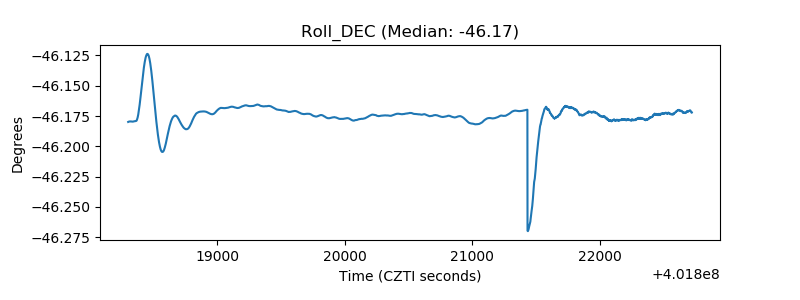 |
| _Roll_RA | 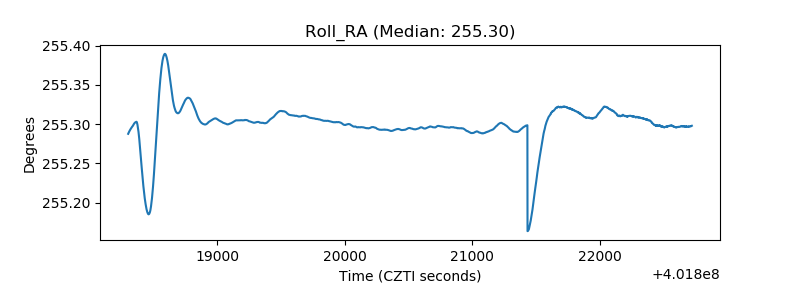 |
| Veto Counter | 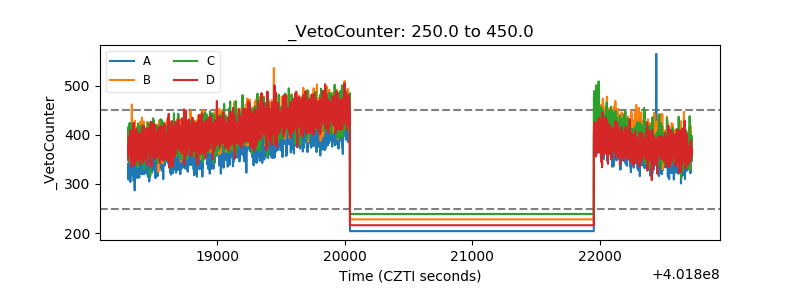 |