| Param | Original file | Final file |
|---|---|---|
| Filename | modeM0/AS1T05_054T01_9000005350_37814cztM0_level2.evt | modeM0/AS1T05_054T01_9000005350_37814cztM0_level2_quad_clean.evt |
| Size (bytes) | 434,223,360 | 70,914,240 |
| Size | 414.1 MB | 67.6 MB |
| Events in quadrant A | 2,855,206 | 452,916 |
| Events in quadrant B | 3,959,994 | 432,211 |
| Events in quadrant C | 2,772,236 | 454,193 |
| Events in quadrant D | 3,195,012 | 428,675 |
| Mode M9 | |||
|---|---|---|---|
| Quadrant | BADHDUFLAG | Total packets | Discarded packets |
| A | 0 | 17 | 0 |
| B | 0 | 17 | 0 |
| C | 0 | 17 | 0 |
| D | 0 | 18 | 0 |
| Mode SS | |||
|---|---|---|---|
| Quadrant | BADHDUFLAG | Total packets | Discarded packets |
| A | 0 | 110 | 0 |
| B | 0 | 110 | 0 |
| C | 0 | 110 | 0 |
| D | 0 | 110 | 0 |
| Mode M0 | |||
|---|---|---|---|
| Quadrant | BADHDUFLAG | Total packets | Discarded packets |
| A | 0 | 11848 | 3 |
| B | 0 | 15315 | 2 |
| C | 0 | 11622 | 2 |
| D | 0 | 13298 | 2 |
| Quadrant | Total seconds | Saturated seconds | Saturation percentage |
|---|---|---|---|
| A | 5416 | 25 | 0.461595% |
| B | 5416 | 456 | 8.419498% |
| C | 5416 | 42 | 0.775480% |
| D | 5416 | 132 | 2.437223% |
Noise dominated data is calculated using 1-second bins in cleaned event files. If a bin has >2000 counts, and if more than 50% of those come from <1% of pixels, then it is considered to be noise-dominated and hence unusable.
| Quadrant | # 1 sec bins | Bins with >0 counts | Bins with >2000 counts | High rate bins dominated by noise | Noise dominated (total time) | Noise dominated (detector-on time) | Marked lightcurve |
|---|---|---|---|---|---|---|---|
| A | 6999 | 5417 | 11 | 11 | 0.16% | 0.20% | 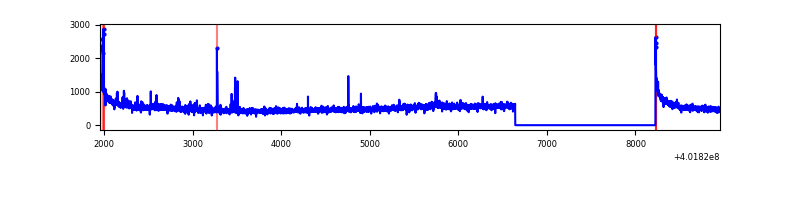 |
| B | 6999 | 5417 | 438 | 438 | 6.26% | 8.09% | 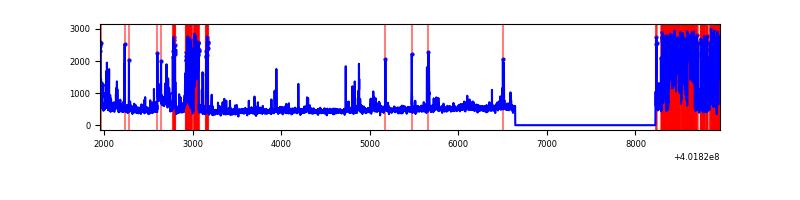 |
| C | 6999 | 5417 | 42 | 42 | 0.60% | 0.78% | 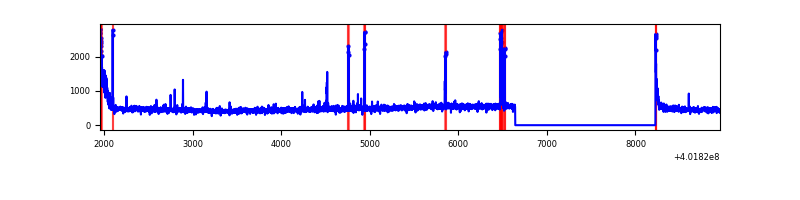 |
| D | 6999 | 5416 | 131 | 131 | 1.87% | 2.42% | 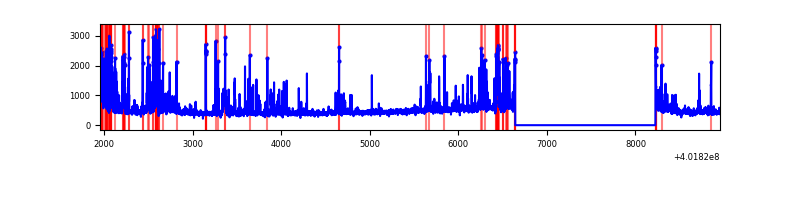 |
Top three noisy pixels from each quadrant. If the there are fewer than three noisy pixels in the level2.evt file, extra rows are filled as -1
| Pixel properties | Quadrant properties | ||||||
|---|---|---|---|---|---|---|---|
| Quadrant | DetID | PixID | Counts | Sigma | Mean | Median | Sigma |
| A | 10 | 83 | 352593 | 2839.19 | 610 | 599 | 124.0 |
| A | 15 | 222 | 49459 | 394.11 | 610 | 599 | 124.0 |
| A | 9 | 143 | 31757 | 251.32 | 610 | 599 | 124.0 |
| B | 10 | 246 | 939769 | 8313.46 | 589 | 574 | 113.0 |
| B | 5 | 172 | 404312 | 3573.76 | 589 | 574 | 113.0 |
| B | 0 | 189 | 79446 | 698.15 | 589 | 574 | 113.0 |
| C | 15 | 214 | 244176 | 1770.91 | 590 | 593 | 137.5 |
| C | 0 | 10 | 120111 | 868.93 | 590 | 593 | 137.5 |
| C | 0 | 207 | 85264 | 615.58 | 590 | 593 | 137.5 |
| D | 12 | 233 | 329013 | 2291.53 | 585 | 570 | 143.3 |
| D | 2 | 249 | 208724 | 1452.28 | 585 | 570 | 143.3 |
| D | 13 | 249 | 93211 | 646.35 | 585 | 570 | 143.3 |
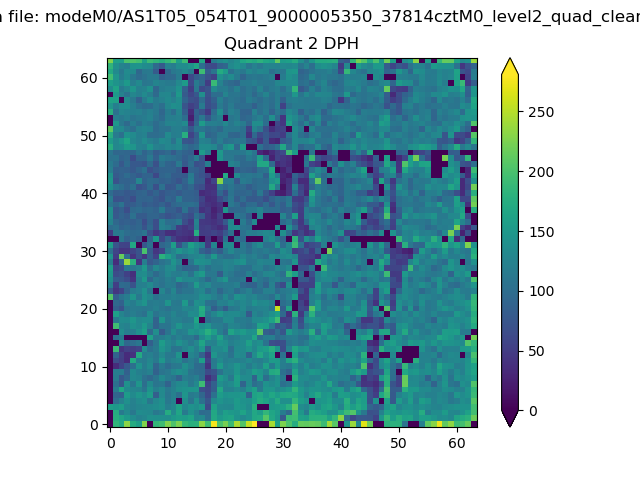
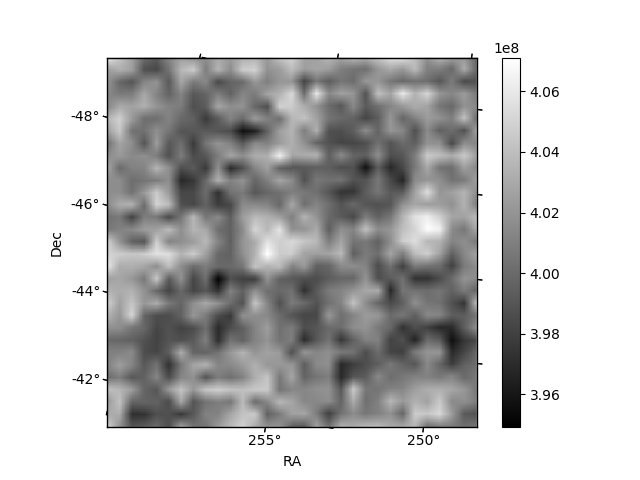
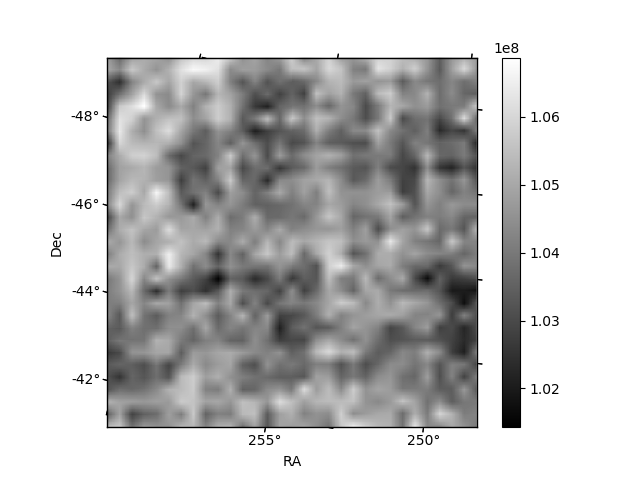
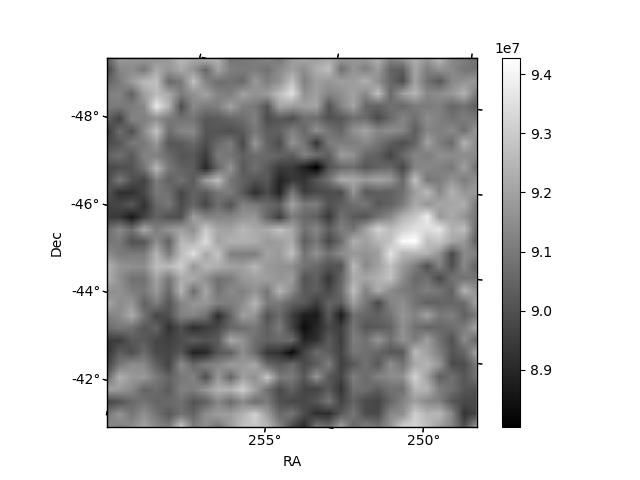
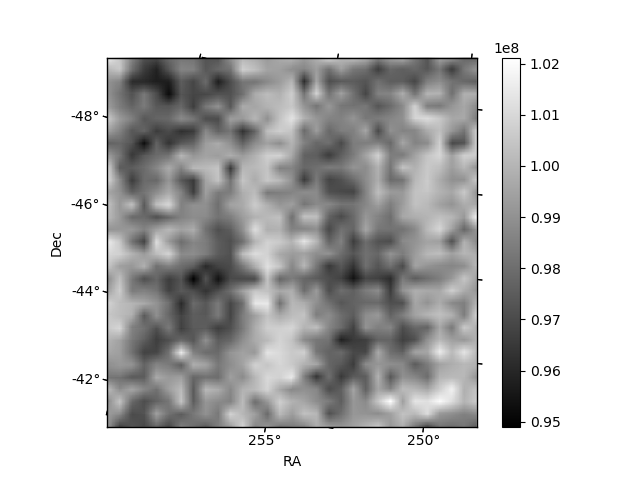
Histogram calculated using DETX and DETY for each event in the final _common_clean file
| Quadrant A | 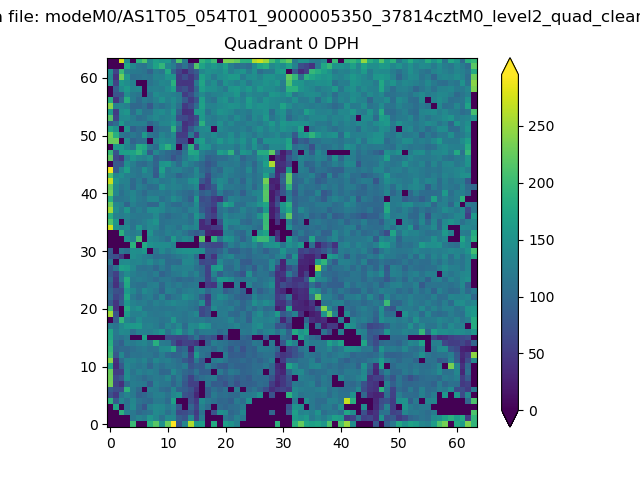 |
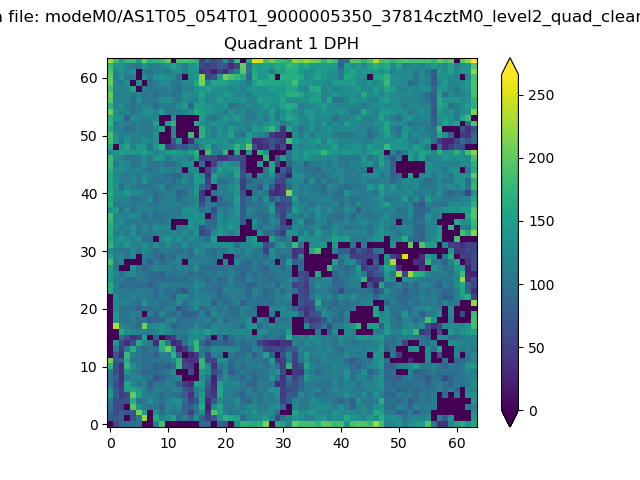 |
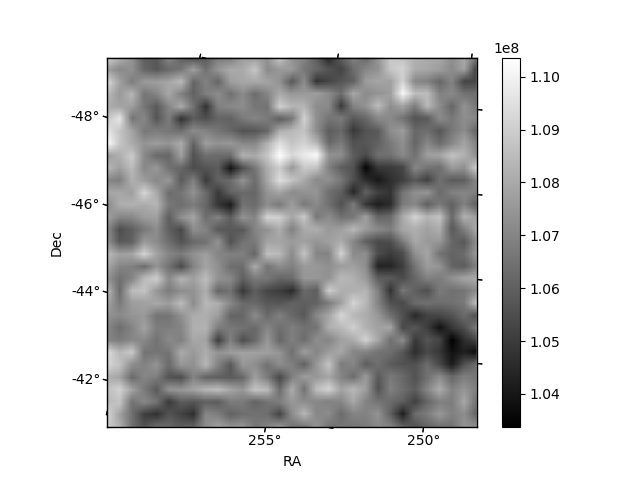
Quadrant B |
|---|---|---|---|
| Quadrant D | 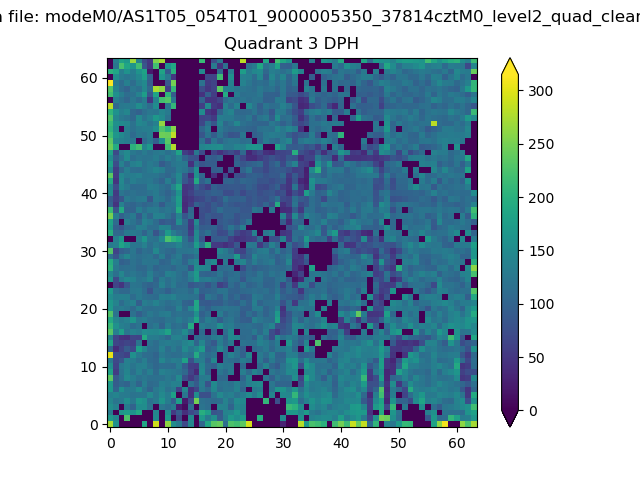 |
 |
Quadrant C |
| Plot type | Count rate plots | Images |
|---|---|---|
| Comparison with Poisson distribution Blue bars denote a histogram of data divided into 1 sec bins. Red curve is a Poisson curve with rate = median count rate of data. |
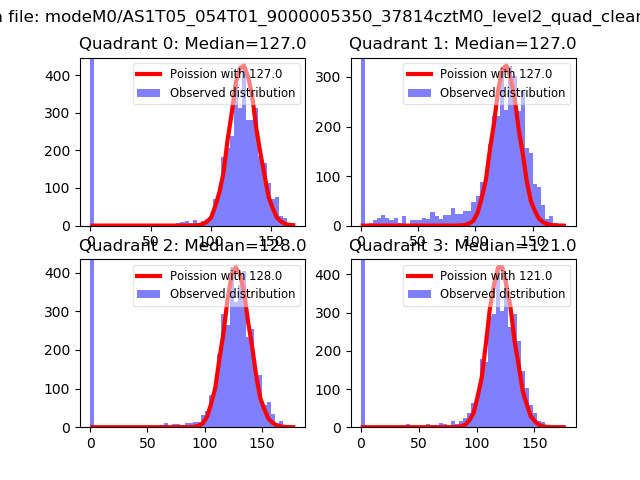 |
 |
| Quadrant-wise count rates Data is divided into 100 sec bins |
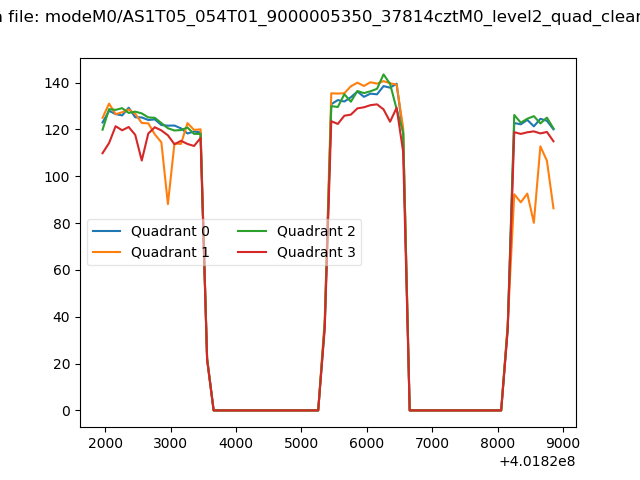 |
|
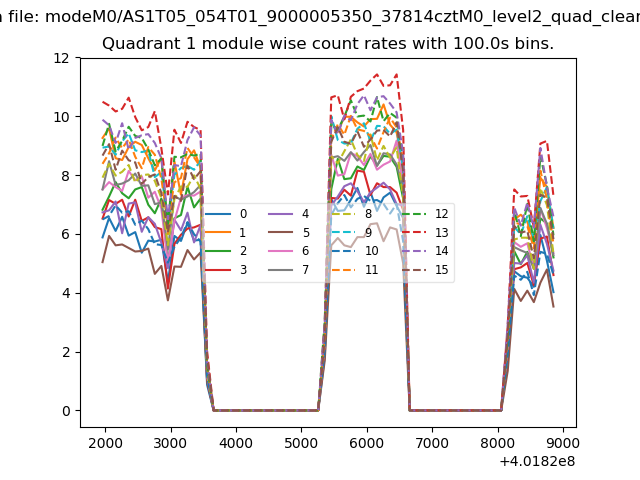
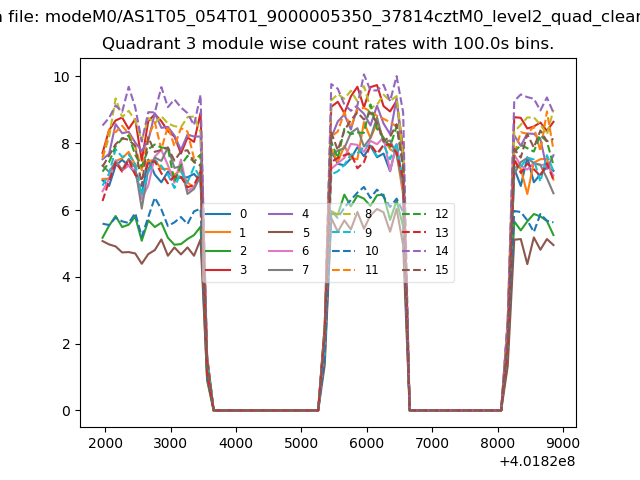
| Module-wise count rates for Quadrant A Data is divided into 100 sec bins |
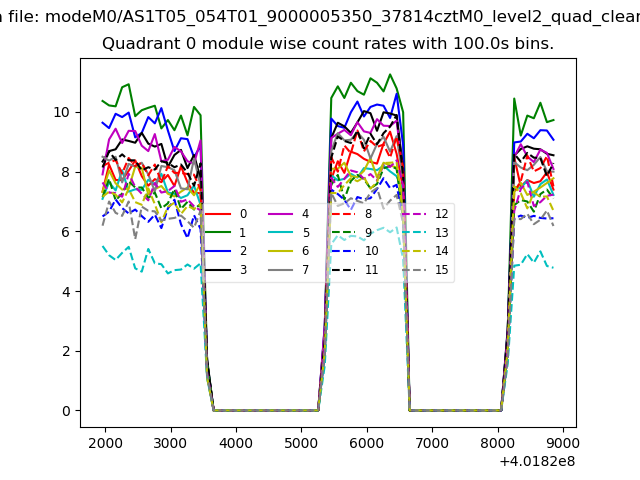 |
 |
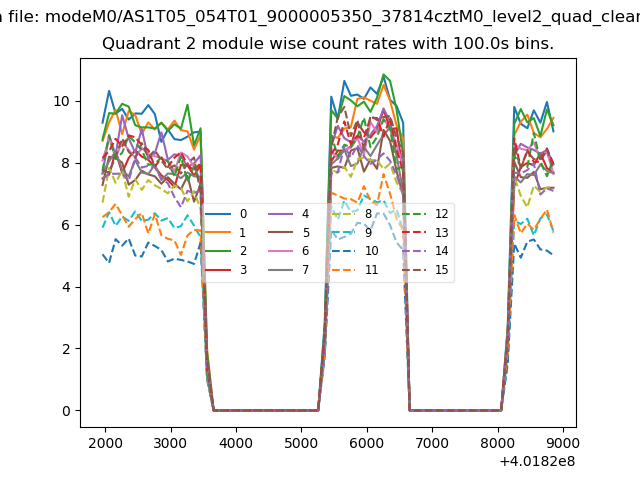
| Module-wise count rates for Quadrant B Data is divided into 100 sec bins |
 |
 |
| Module-wise count rates for Quadrant C Data is divided into 100 sec bins |
 |
 |
| Module-wise count rates for Quadrant D Data is divided into 100 sec bins |
 |
 |
| Parameter | Plot |
|---|---|
| CZT HV Monitor | 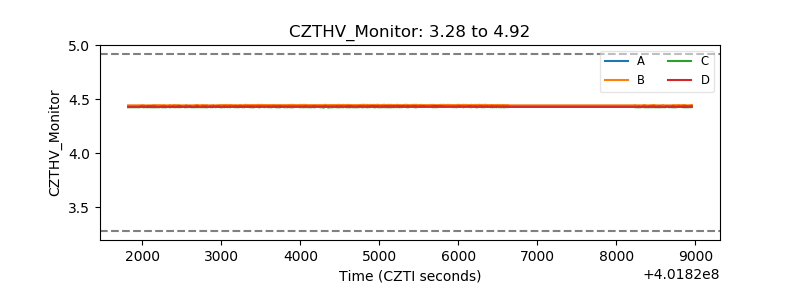 |
| D_VDD | 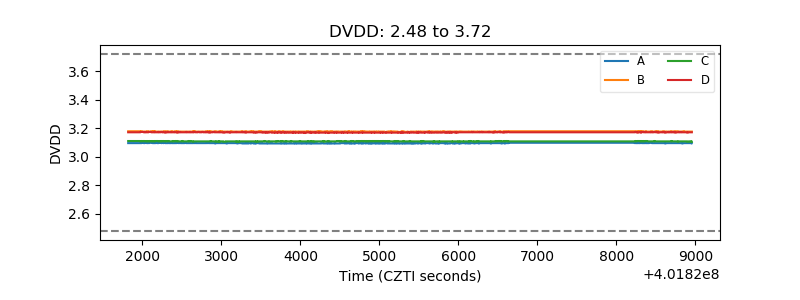 |
| Temperature 1 | 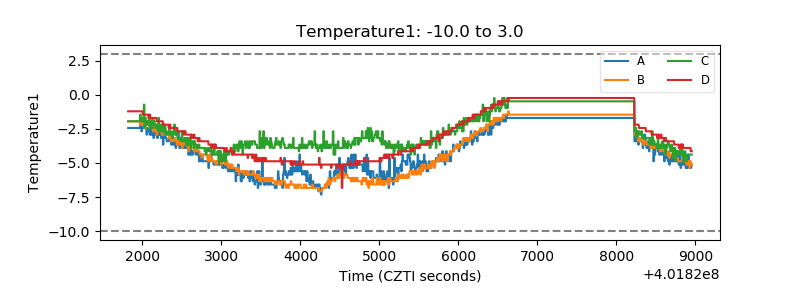 |
| Veto HV Monitor | 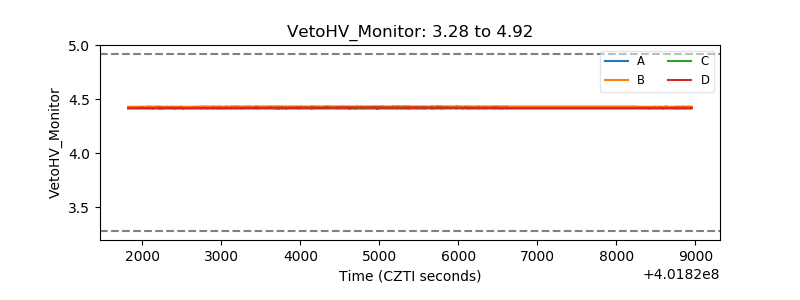 |
| Veto LLD | 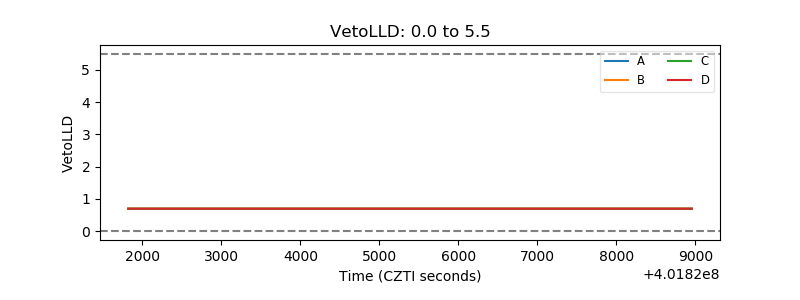 |
| Alpha Counter | 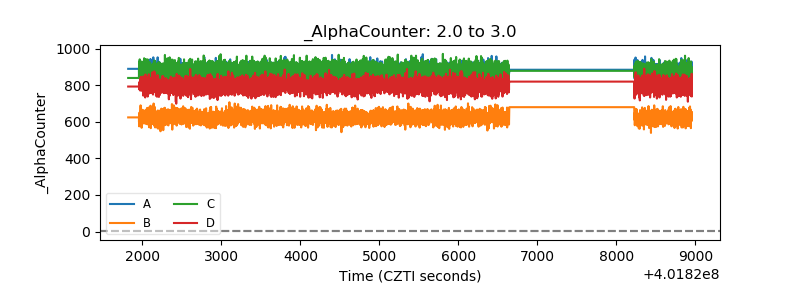 |
| _CPM_Rate | 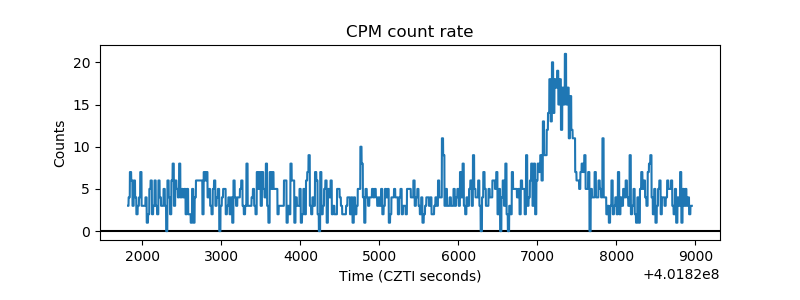 |
| CZT Counter | 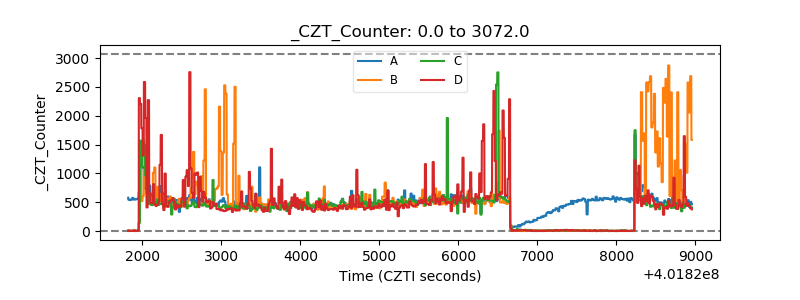 |
| +2.5 Volts monitor | 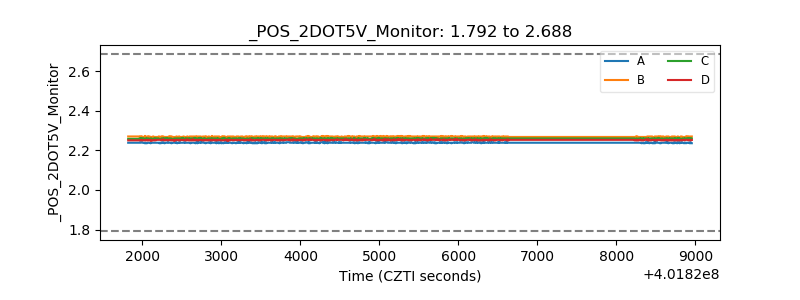 |
| +5 Volts monitor | 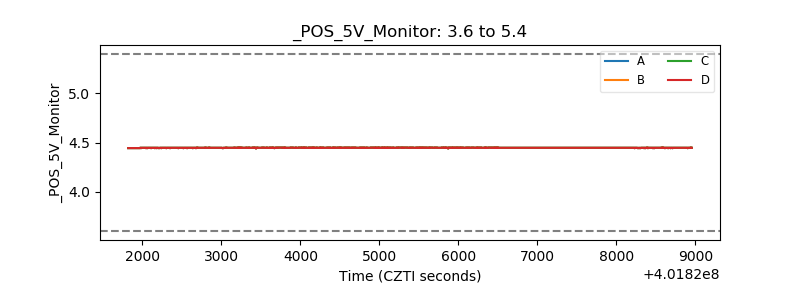 |
| _ROLL_ROT | 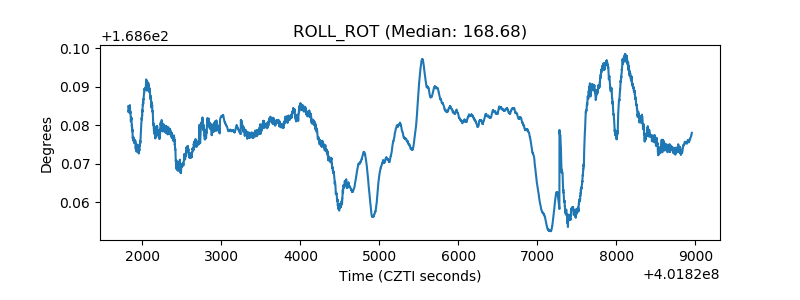 |
| _Roll_DEC | 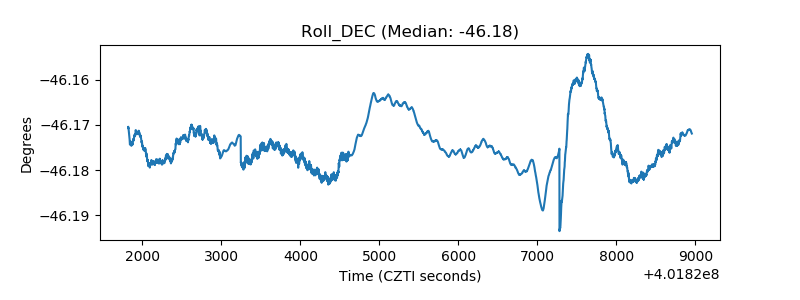 |
| _Roll_RA | 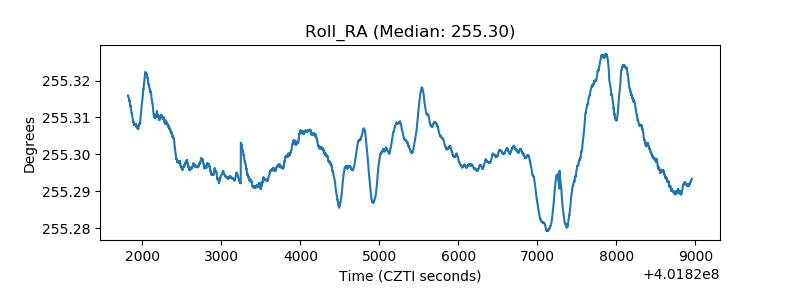 |
| Veto Counter | 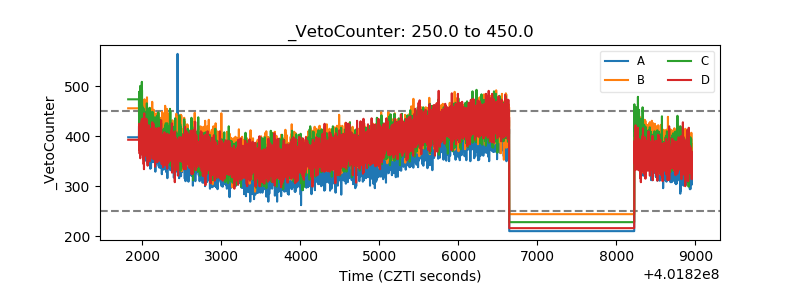 |