| Param | Original file | Final file |
|---|---|---|
| Filename | modeM0/AS1T05_054T01_9000005350_37815cztM0_level2.evt | modeM0/AS1T05_054T01_9000005350_37815cztM0_level2_quad_clean.evt |
| Size (bytes) | 541,549,440 | 74,122,560 |
| Size | 516.5 MB | 70.7 MB |
| Events in quadrant A | 2,973,684 | 485,677 |
| Events in quadrant B | 4,934,872 | 456,739 |
| Events in quadrant C | 2,878,997 | 489,769 |
| Events in quadrant D | 5,222,560 | 408,660 |
| Mode M9 | |||
|---|---|---|---|
| Quadrant | BADHDUFLAG | Total packets | Discarded packets |
| A | 0 | 17 | 0 |
| B | 0 | 17 | 0 |
| C | 0 | 17 | 0 |
| D | 0 | 18 | 0 |
| Mode SS | |||
|---|---|---|---|
| Quadrant | BADHDUFLAG | Total packets | Discarded packets |
| A | 0 | 118 | 0 |
| B | 0 | 118 | 0 |
| C | 0 | 118 | 0 |
| D | 0 | 118 | 0 |
| Mode M0 | |||
|---|---|---|---|
| Quadrant | BADHDUFLAG | Total packets | Discarded packets |
| A | 0 | 12401 | 3 |
| B | 0 | 18456 | 2 |
| C | 0 | 12168 | 2 |
| D | 0 | 19484 | 2 |
| Quadrant | Total seconds | Saturated seconds | Saturation percentage |
|---|---|---|---|
| A | 5762 | 21 | 0.364457% |
| B | 5762 | 631 | 10.951059% |
| C | 5762 | 16 | 0.277681% |
| D | 5762 | 823 | 14.283235% |
Noise dominated data is calculated using 1-second bins in cleaned event files. If a bin has >2000 counts, and if more than 50% of those come from <1% of pixels, then it is considered to be noise-dominated and hence unusable.
| Quadrant | # 1 sec bins | Bins with >0 counts | Bins with >2000 counts | High rate bins dominated by noise | Noise dominated (total time) | Noise dominated (detector-on time) | Marked lightcurve |
|---|---|---|---|---|---|---|---|
| A | 7106 | 5763 | 11 | 11 | 0.15% | 0.19% |  |
| B | 7106 | 5762 | 581 | 581 | 8.18% | 10.08% |  |
| C | 7106 | 5763 | 12 | 12 | 0.17% | 0.21% | 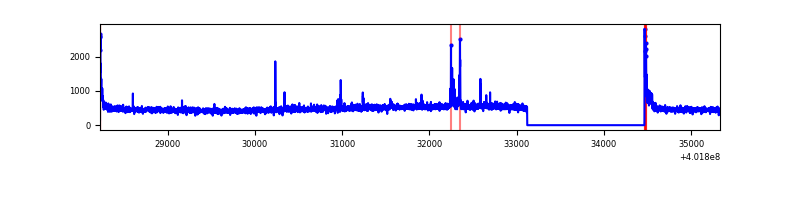 |
| D | 7106 | 5763 | 817 | 817 | 11.50% | 14.18% | 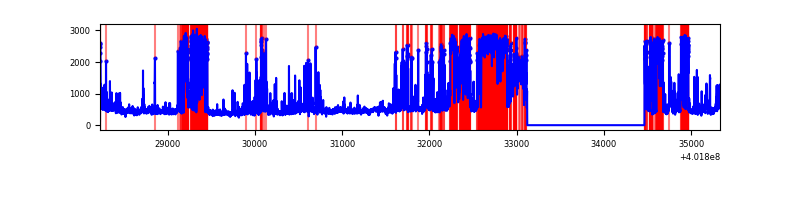 |
Top three noisy pixels from each quadrant. If the there are fewer than three noisy pixels in the level2.evt file, extra rows are filled as -1
| Pixel properties | Quadrant properties | ||||||
|---|---|---|---|---|---|---|---|
| Quadrant | DetID | PixID | Counts | Sigma | Mean | Median | Sigma |
| A | 10 | 83 | 361264 | 2729.61 | 649 | 638 | 132.1 |
| A | 9 | 143 | 39796 | 296.39 | 649 | 638 | 132.1 |
| A | 12 | 189 | 15675 | 113.82 | 649 | 638 | 132.1 |
| B | 10 | 246 | 1634098 | 13602.32 | 619 | 602 | 120.1 |
| B | 5 | 172 | 228850 | 1900.65 | 619 | 602 | 120.1 |
| B | 0 | 189 | 227275 | 1887.53 | 619 | 602 | 120.1 |
| C | 15 | 214 | 260210 | 1760.53 | 630 | 634 | 147.4 |
| C | 0 | 10 | 82563 | 555.67 | 630 | 634 | 147.4 |
| C | 14 | 254 | 51825 | 347.19 | 630 | 634 | 147.4 |
| D | 2 | 249 | 2458207 | 17253.87 | 582 | 568 | 142.4 |
| D | 13 | 249 | 106061 | 740.61 | 582 | 568 | 142.4 |
| D | 12 | 233 | 84269 | 587.62 | 582 | 568 | 142.4 |
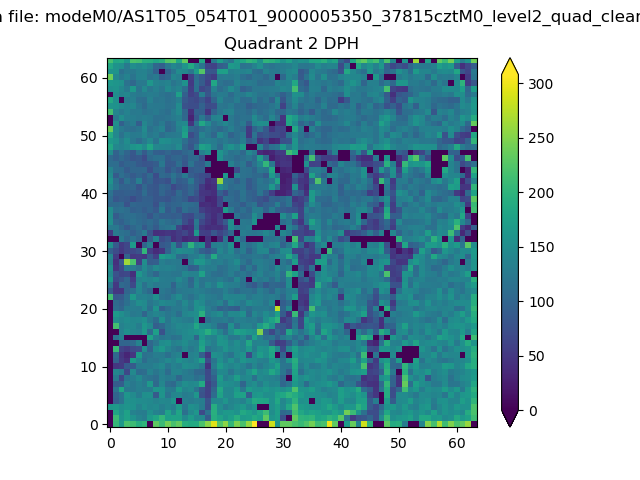
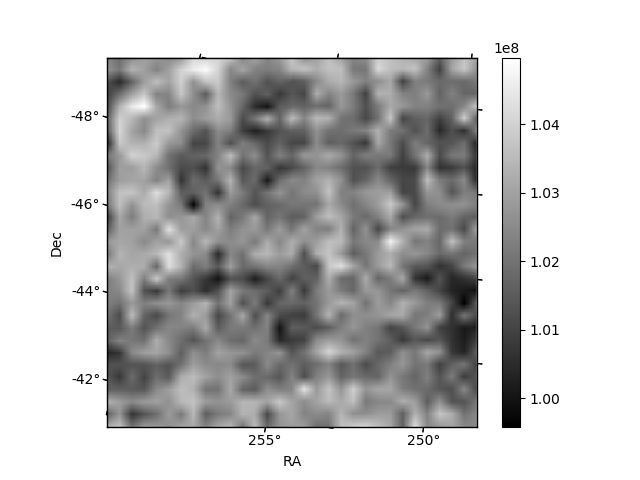
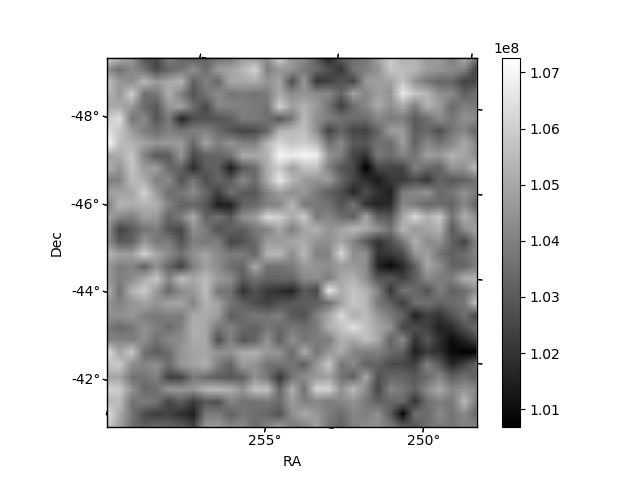
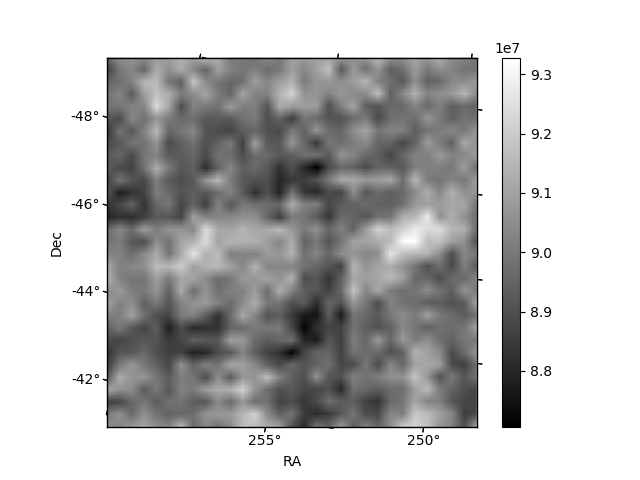
Histogram calculated using DETX and DETY for each event in the final _common_clean file
| Quadrant A | 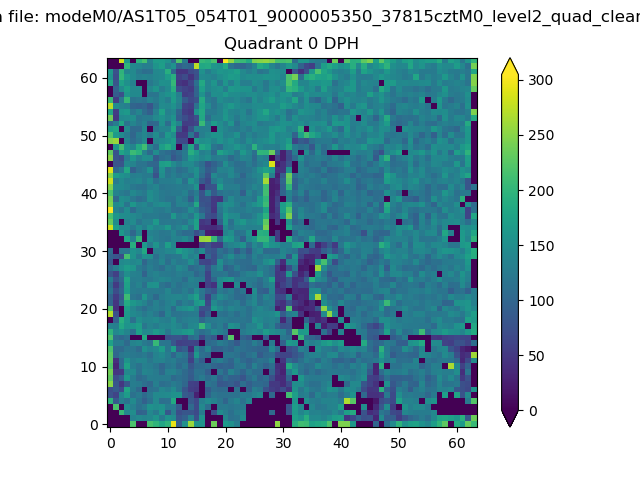 |
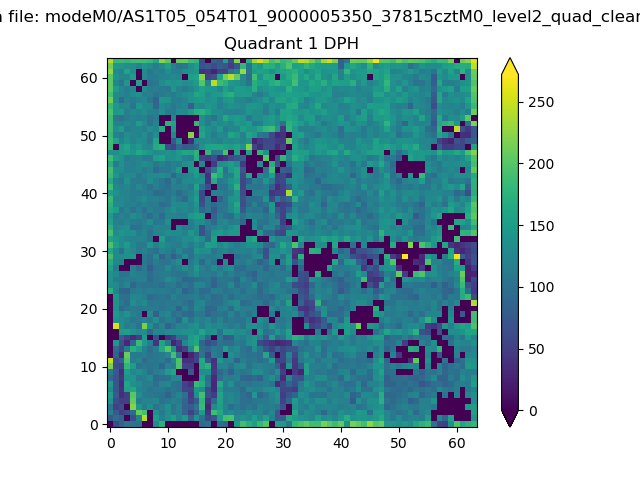 |
Quadrant B |
|---|---|---|---|
| Quadrant D |  |
 |
Quadrant C |
| Plot type | Count rate plots | Images |
|---|---|---|
| Comparison with Poisson distribution Blue bars denote a histogram of data divided into 1 sec bins. Red curve is a Poisson curve with rate = median count rate of data. |
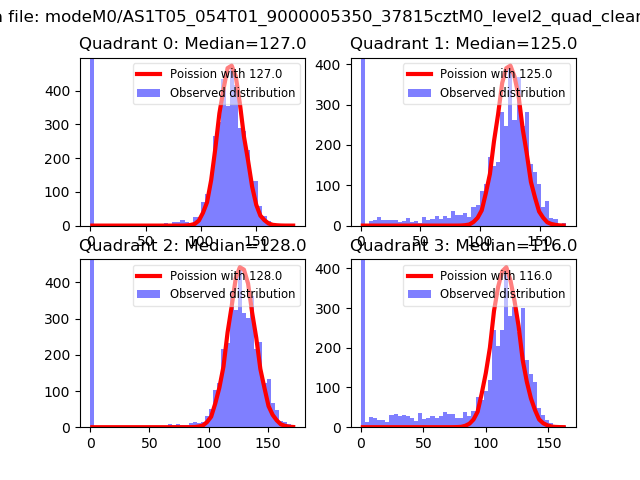 |
 |
| Quadrant-wise count rates Data is divided into 100 sec bins |
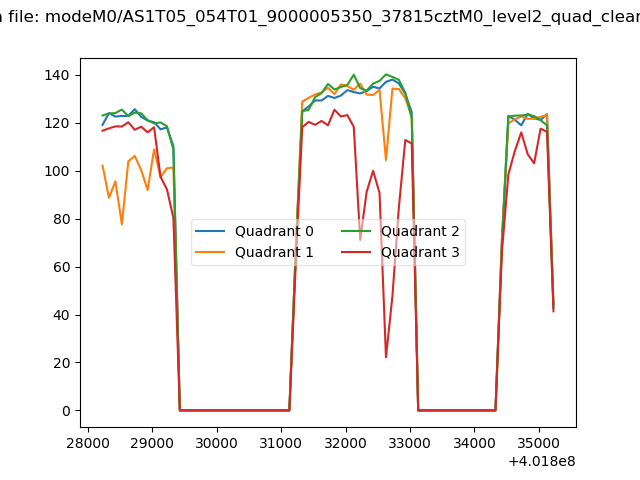 |
|
| Module-wise count rates for Quadrant A Data is divided into 100 sec bins |
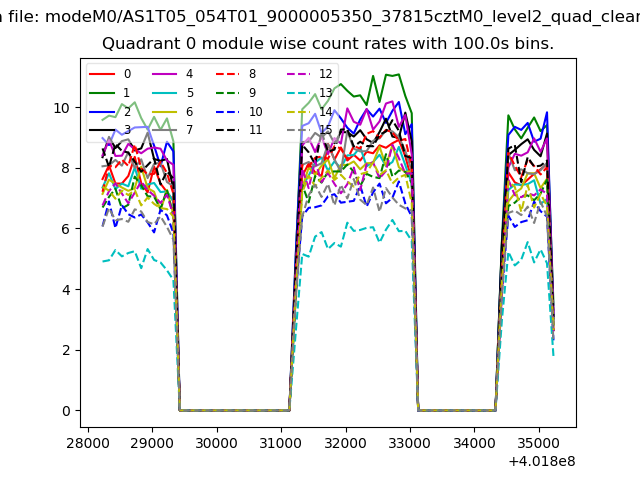 |
 |
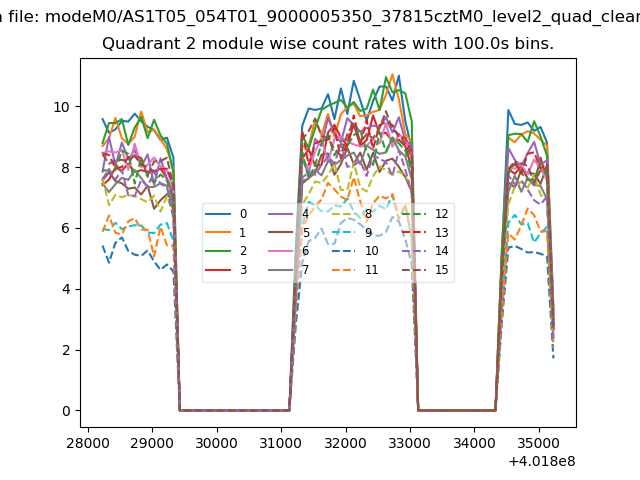
| Module-wise count rates for Quadrant B Data is divided into 100 sec bins |
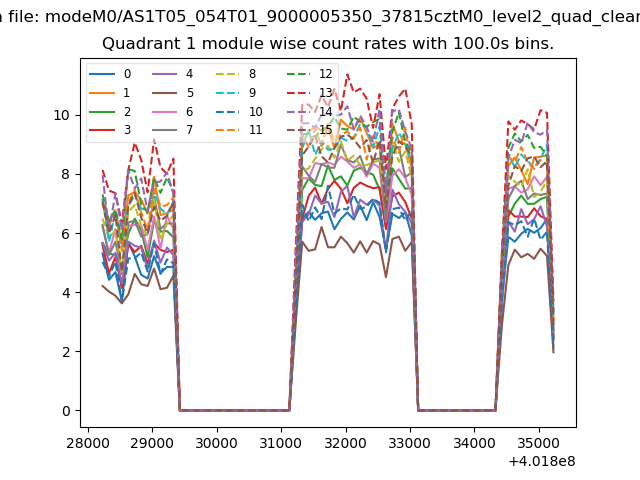 |
 |
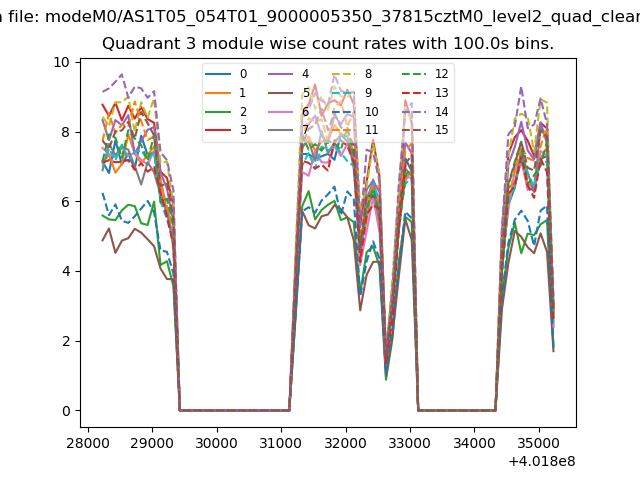
| Module-wise count rates for Quadrant C Data is divided into 100 sec bins |
 |
 |
| Module-wise count rates for Quadrant D Data is divided into 100 sec bins |
 |
 |
| Parameter | Plot |
|---|---|
| CZT HV Monitor |  |
| D_VDD | 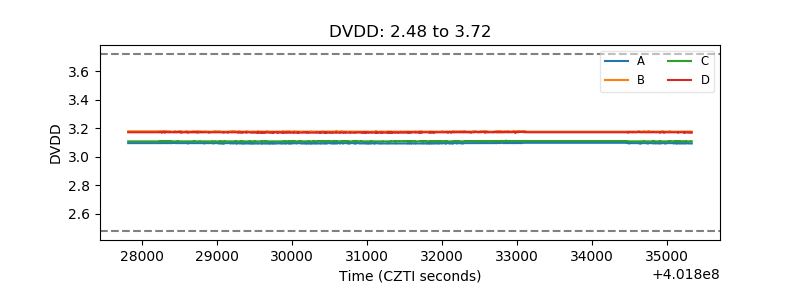 |
| Temperature 1 | 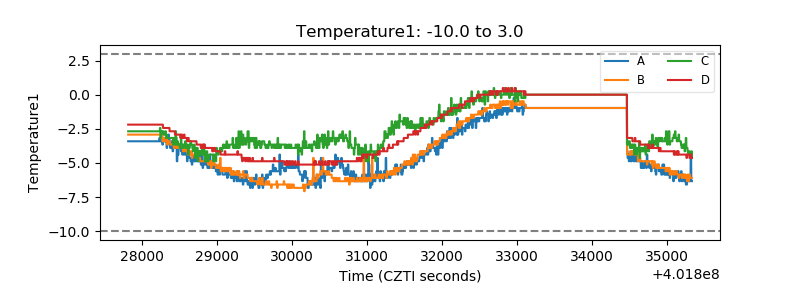 |
| Veto HV Monitor | 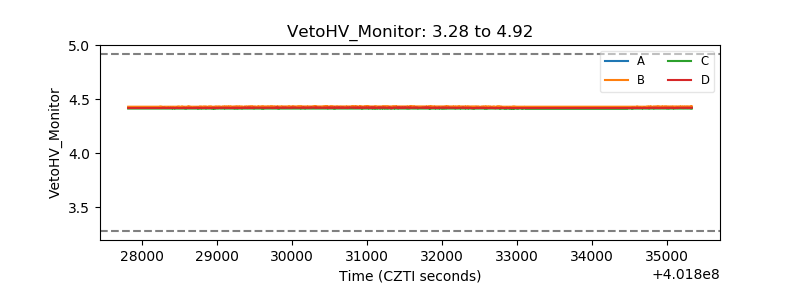 |
| Veto LLD | 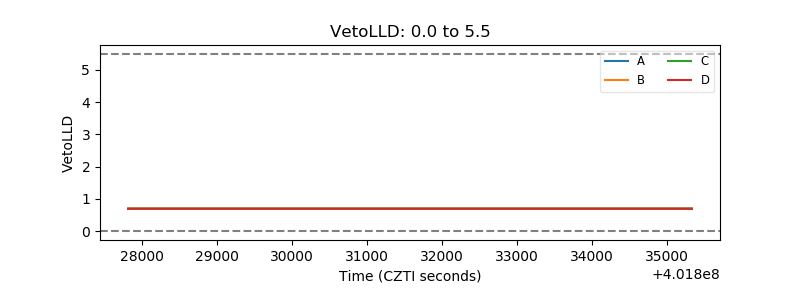 |
| Alpha Counter | 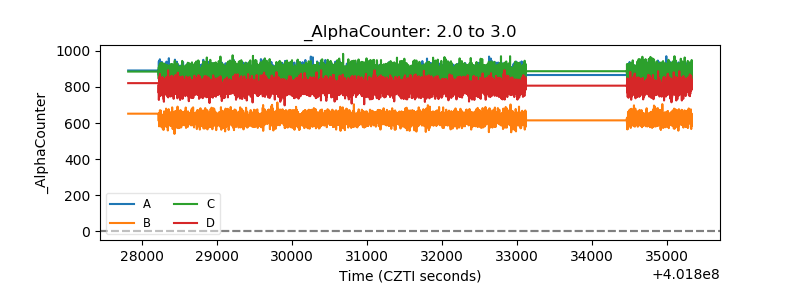 |
| _CPM_Rate | 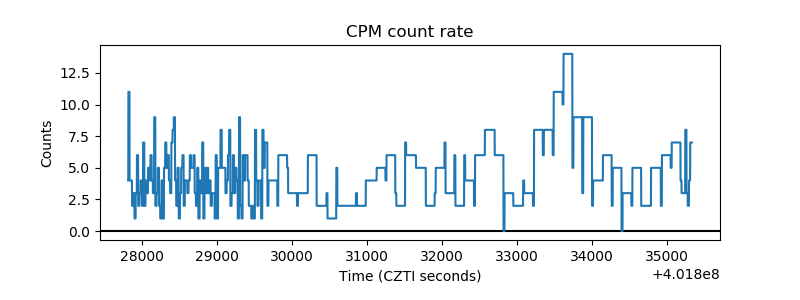 |
| CZT Counter | 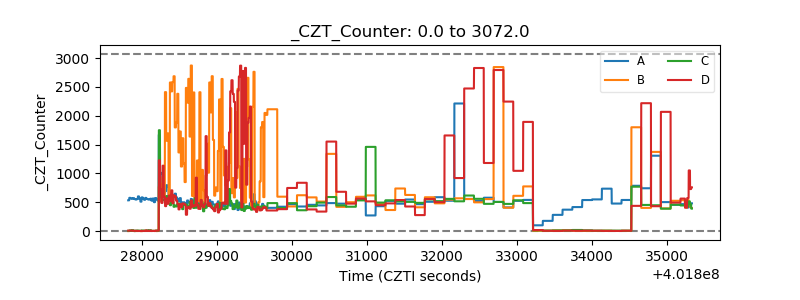 |
| +2.5 Volts monitor | 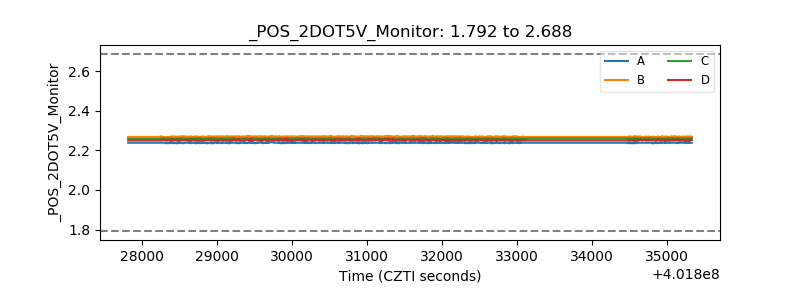 |
| +5 Volts monitor | 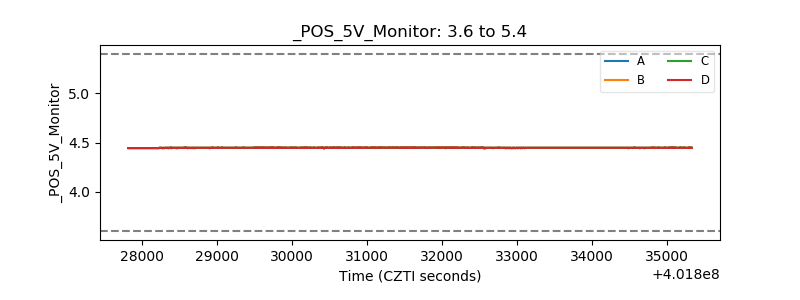 |
| _ROLL_ROT | 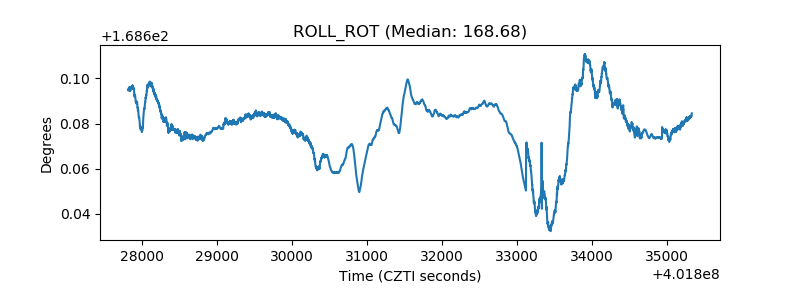 |
| _Roll_DEC | 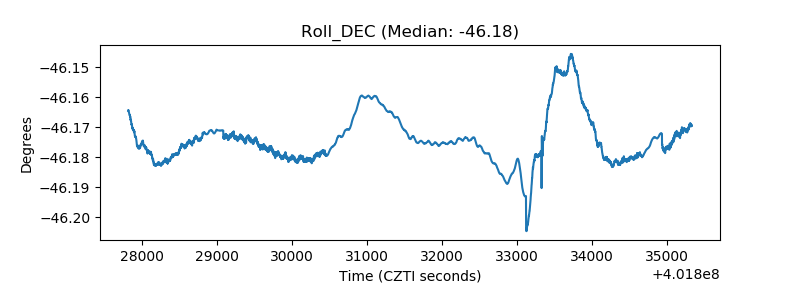 |
| _Roll_RA | 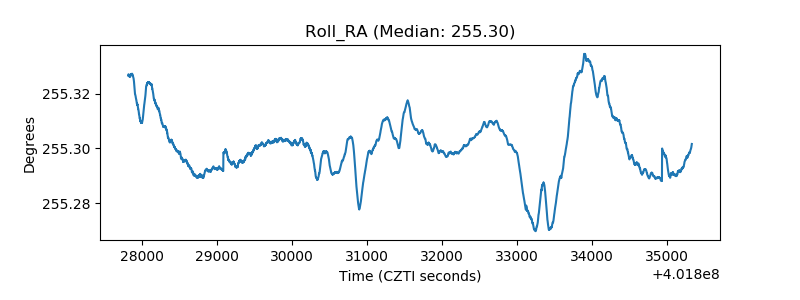 |
| Veto Counter | 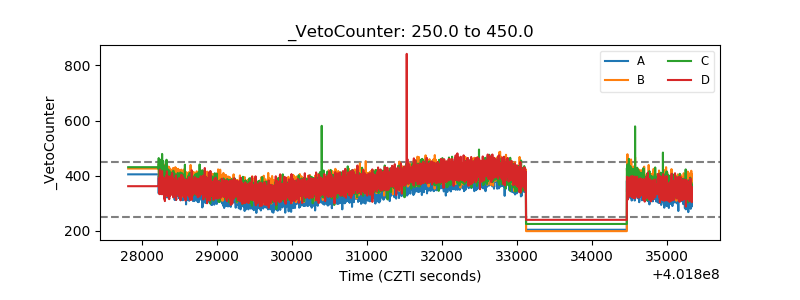 |