| Param | Original file | Final file |
|---|---|---|
| Filename | modeM0/AS1T05_054T01_9000005350_37816cztM0_level2.evt | modeM0/AS1T05_054T01_9000005350_37816cztM0_level2_quad_clean.evt |
| Size (bytes) | 449,902,080 | 71,588,160 |
| Size | 429.1 MB | 68.3 MB |
| Events in quadrant A | 3,094,749 | 441,818 |
| Events in quadrant B | 3,503,106 | 445,083 |
| Events in quadrant C | 2,997,302 | 445,138 |
| Events in quadrant D | 3,623,529 | 417,394 |
| Mode M9 | |||
|---|---|---|---|
| Quadrant | BADHDUFLAG | Total packets | Discarded packets |
| A | 0 | 22 | 0 |
| B | 0 | 22 | 0 |
| C | 0 | 22 | 0 |
| D | 0 | 23 | 0 |
| Mode SS | |||
|---|---|---|---|
| Quadrant | BADHDUFLAG | Total packets | Discarded packets |
| A | 0 | 122 | 0 |
| B | 0 | 122 | 0 |
| C | 0 | 122 | 0 |
| D | 0 | 122 | 0 |
| Mode M0 | |||
|---|---|---|---|
| Quadrant | BADHDUFLAG | Total packets | Discarded packets |
| A | 0 | 12857 | 3 |
| B | 0 | 14433 | 2 |
| C | 0 | 12591 | 2 |
| D | 0 | 14837 | 2 |
| Quadrant | Total seconds | Saturated seconds | Saturation percentage |
|---|---|---|---|
| A | 5985 | 15 | 0.250627% |
| B | 5985 | 124 | 2.071846% |
| C | 5985 | 12 | 0.200501% |
| D | 5985 | 171 | 2.857143% |
Noise dominated data is calculated using 1-second bins in cleaned event files. If a bin has >2000 counts, and if more than 50% of those come from <1% of pixels, then it is considered to be noise-dominated and hence unusable.
| Quadrant | # 1 sec bins | Bins with >0 counts | Bins with >2000 counts | High rate bins dominated by noise | Noise dominated (total time) | Noise dominated (detector-on time) | Marked lightcurve |
|---|---|---|---|---|---|---|---|
| A | 7268 | 5986 | 13 | 13 | 0.18% | 0.22% | 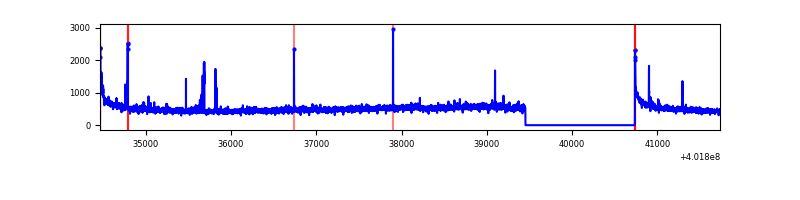 |
| B | 7268 | 5986 | 88 | 88 | 1.21% | 1.47% | 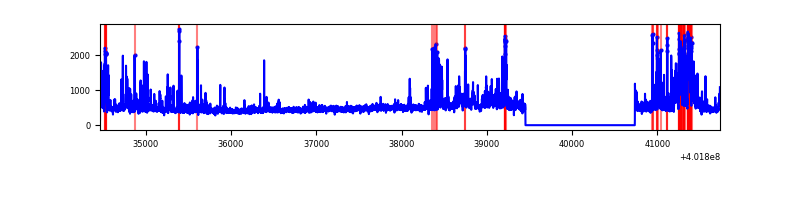 |
| C | 7268 | 5986 | 12 | 12 | 0.17% | 0.20% | 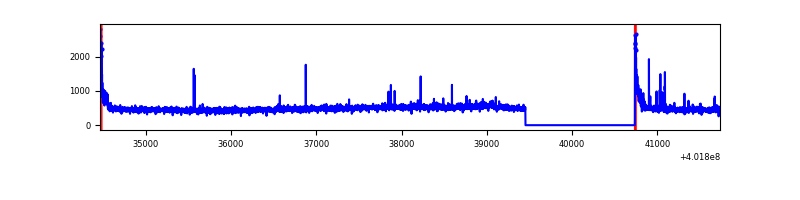 |
| D | 7268 | 5986 | 167 | 167 | 2.30% | 2.79% | 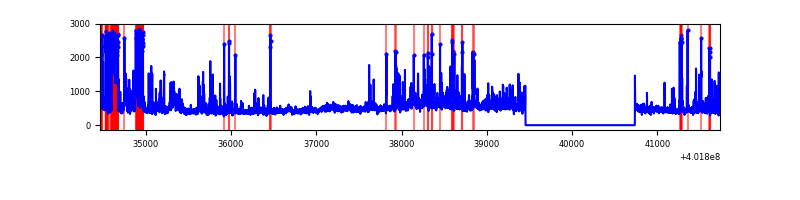 |
Top three noisy pixels from each quadrant. If the there are fewer than three noisy pixels in the level2.evt file, extra rows are filled as -1
| Pixel properties | Quadrant properties | ||||||
|---|---|---|---|---|---|---|---|
| Quadrant | DetID | PixID | Counts | Sigma | Mean | Median | Sigma |
| A | 10 | 83 | 374011 | 2756.25 | 670 | 660 | 135.5 |
| A | 9 | 143 | 71044 | 519.61 | 670 | 660 | 135.5 |
| A | 13 | 6 | 21201 | 151.64 | 670 | 660 | 135.5 |
| B | 4 | 171 | 315475 | 2466.61 | 666 | 648 | 127.6 |
| B | 4 | 232 | 148750 | 1160.35 | 666 | 648 | 127.6 |
| B | 5 | 172 | 121211 | 944.59 | 666 | 648 | 127.6 |
| C | 15 | 214 | 271785 | 1777.86 | 652 | 659 | 152.5 |
| C | 0 | 10 | 114058 | 743.59 | 652 | 659 | 152.5 |
| C | 15 | 159 | 39221 | 252.86 | 652 | 659 | 152.5 |
| D | 2 | 249 | 567059 | 3564.3 | 647 | 629 | 158.9 |
| D | 10 | 199 | 130950 | 820.05 | 647 | 629 | 158.9 |
| D | 7 | 223 | 103958 | 650.21 | 647 | 629 | 158.9 |
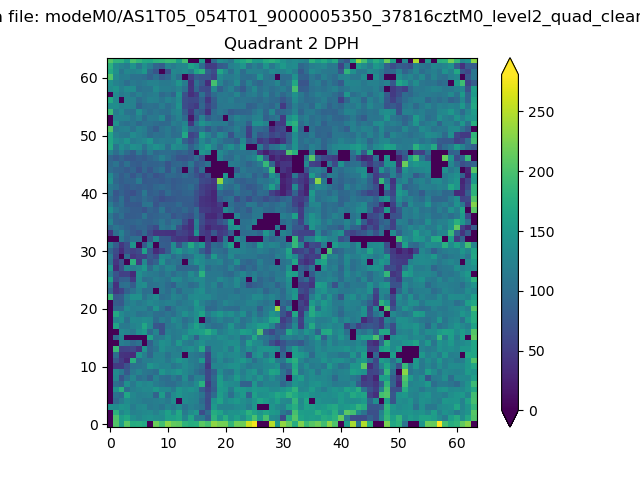
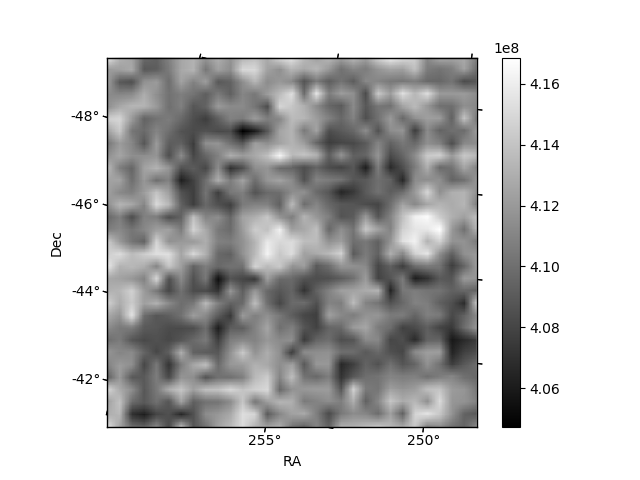
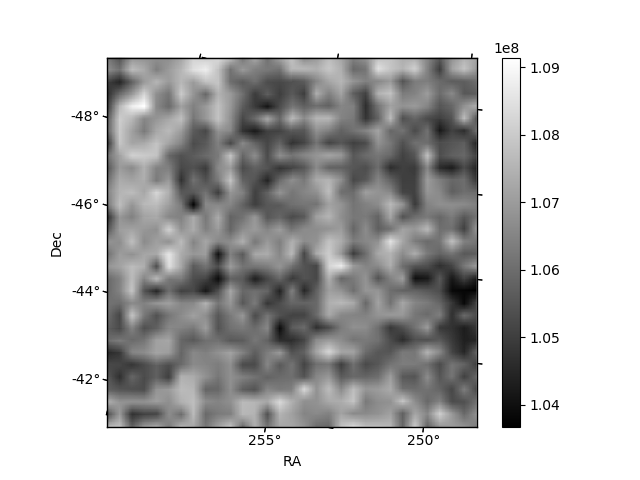
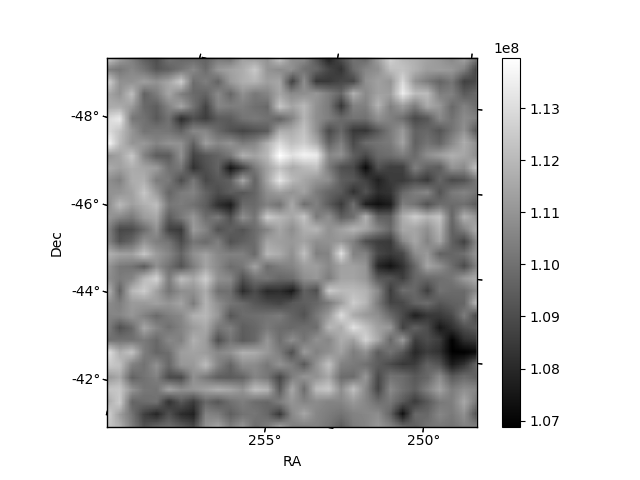
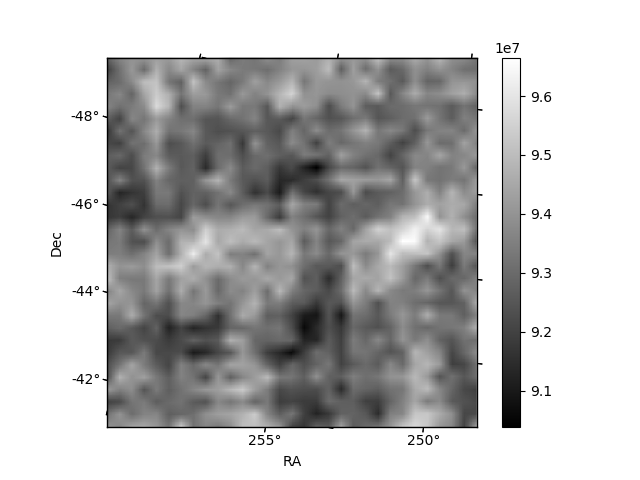
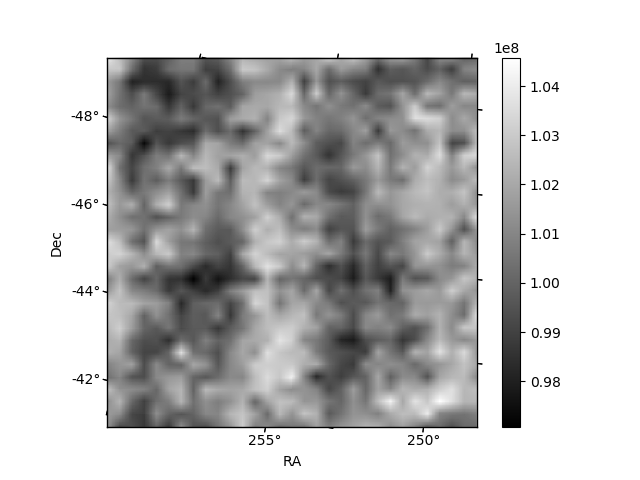
Histogram calculated using DETX and DETY for each event in the final _common_clean file
| Quadrant A | 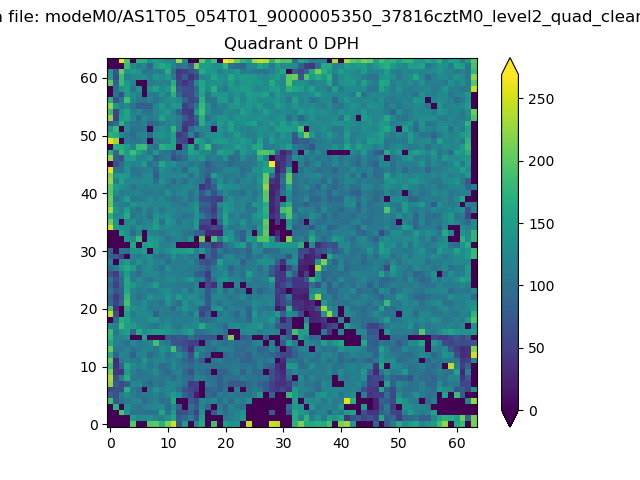 |
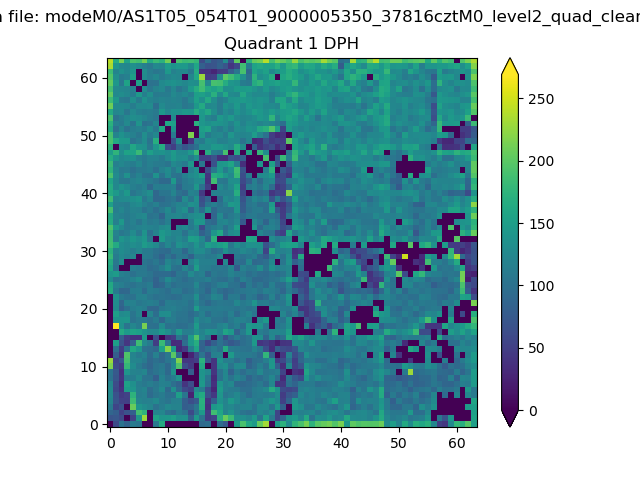 |
Quadrant B |
|---|---|---|---|
| Quadrant D | 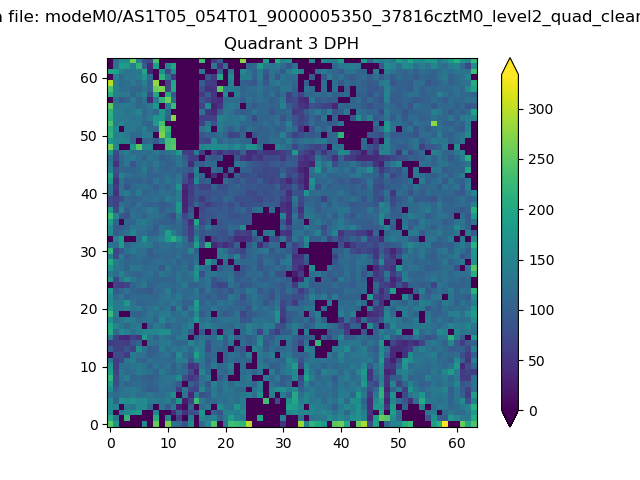 |
 |
Quadrant C |
| Plot type | Count rate plots | Images |
|---|---|---|
| Comparison with Poisson distribution Blue bars denote a histogram of data divided into 1 sec bins. Red curve is a Poisson curve with rate = median count rate of data. |
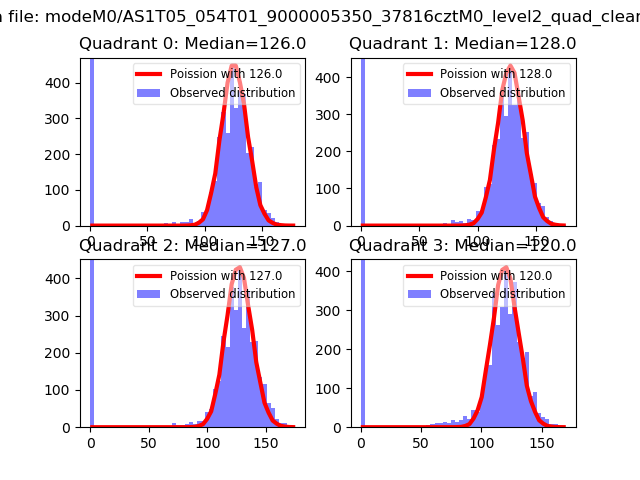 |
 |
| Quadrant-wise count rates Data is divided into 100 sec bins |
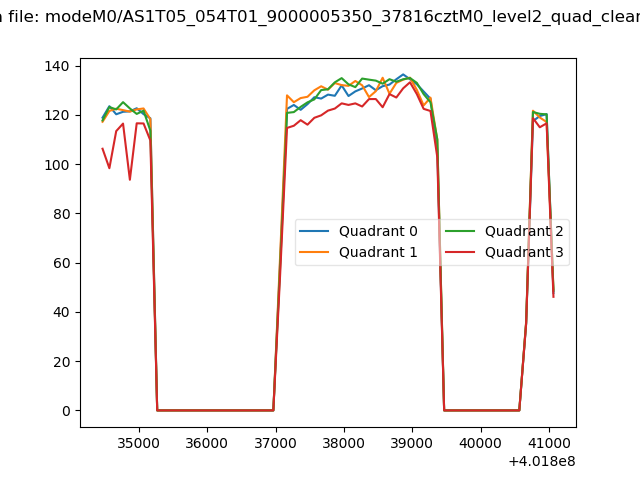 |
|
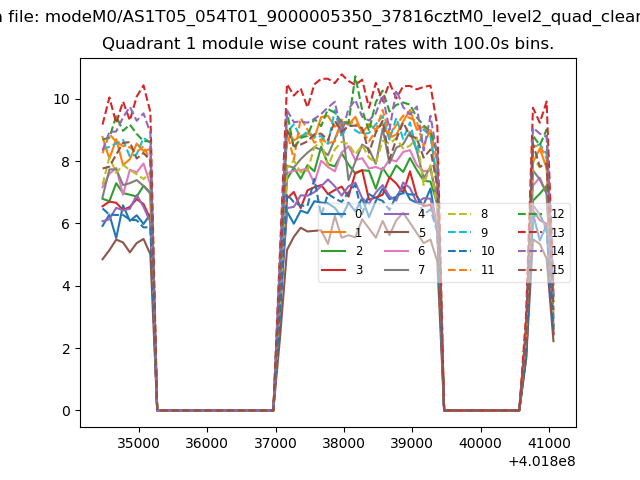
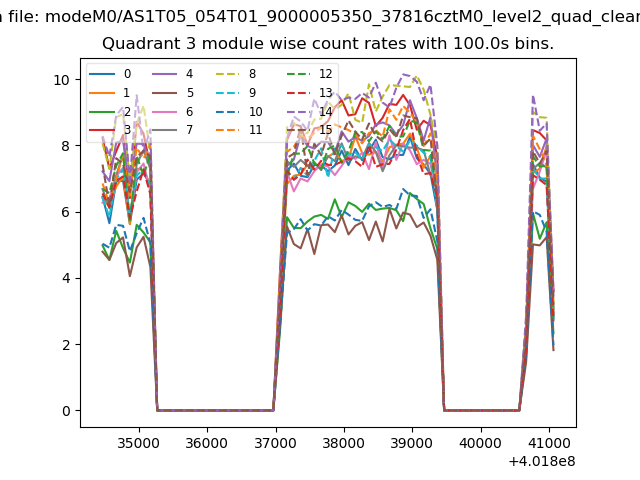
| Module-wise count rates for Quadrant A Data is divided into 100 sec bins |
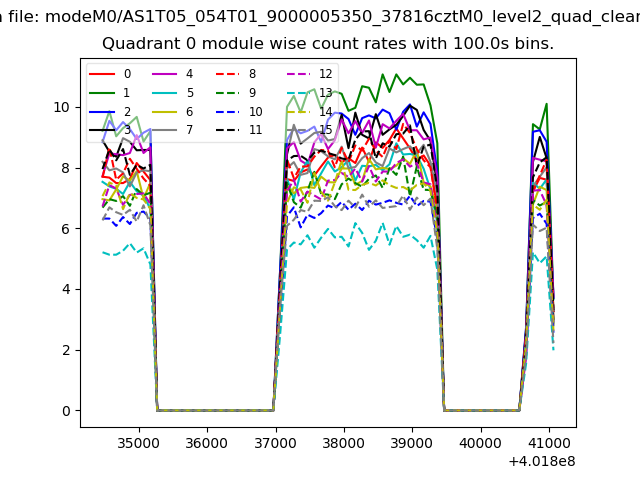 |
 |
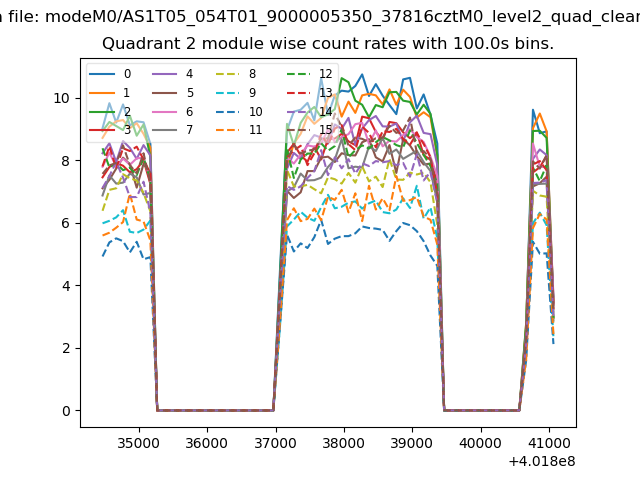
| Module-wise count rates for Quadrant B Data is divided into 100 sec bins |
 |
 |
| Module-wise count rates for Quadrant C Data is divided into 100 sec bins |
 |
 |
| Module-wise count rates for Quadrant D Data is divided into 100 sec bins |
 |
 |
| Parameter | Plot |
|---|---|
| CZT HV Monitor | 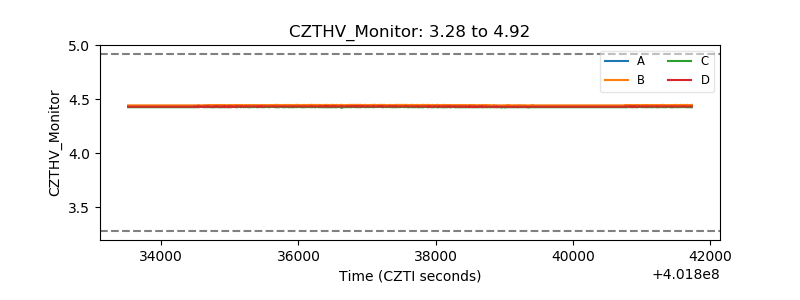 |
| D_VDD | 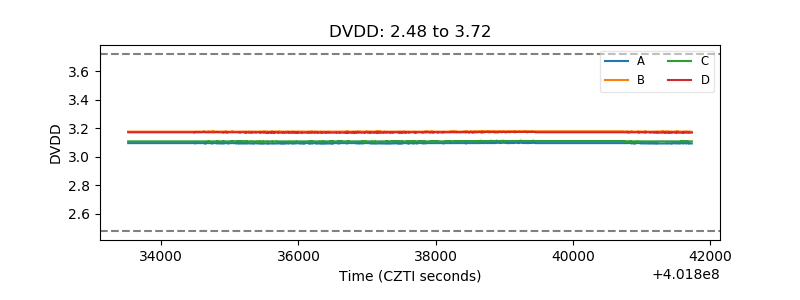 |
| Temperature 1 | 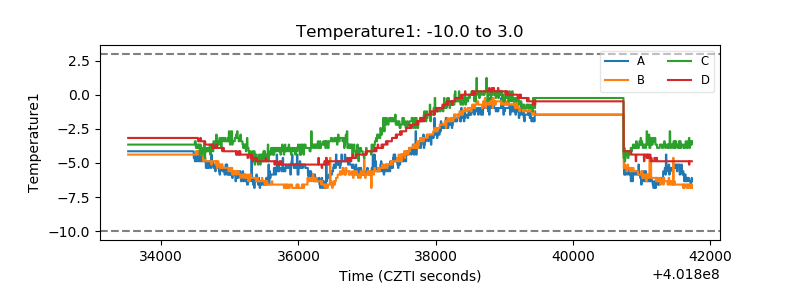 |
| Veto HV Monitor | 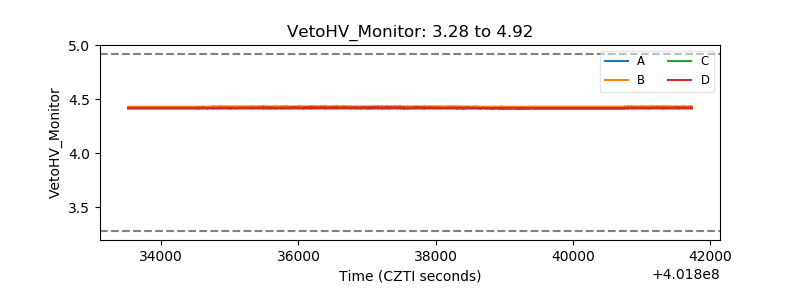 |
| Veto LLD | 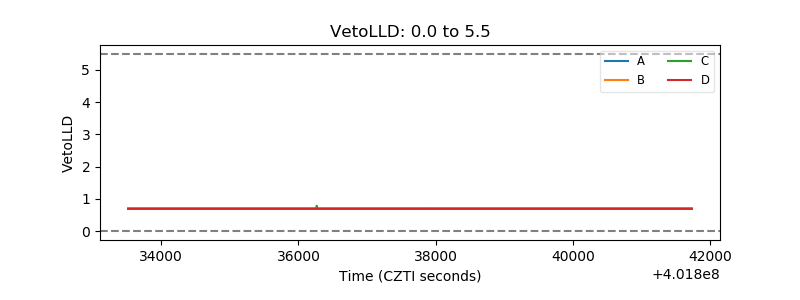 |
| Alpha Counter | 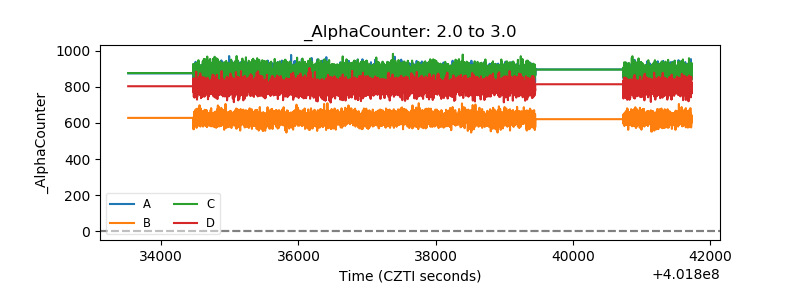 |
| _CPM_Rate | 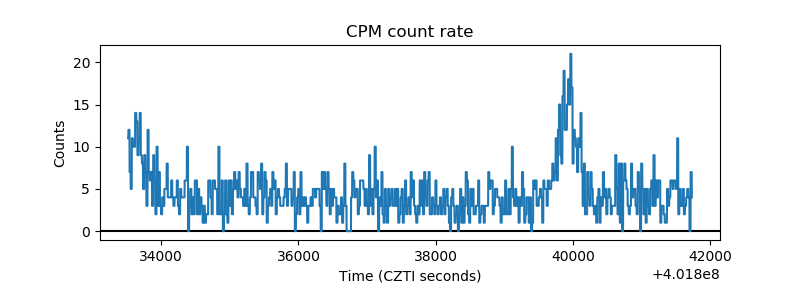 |
| CZT Counter | 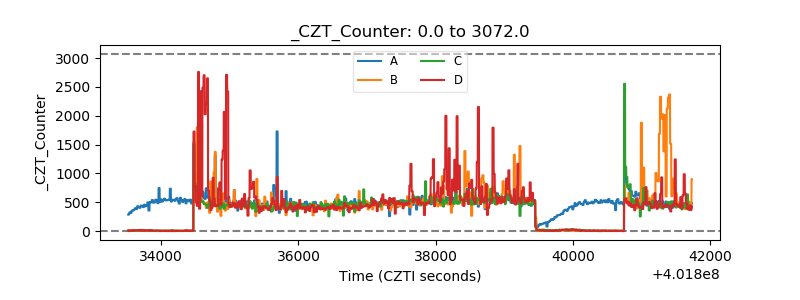 |
| +2.5 Volts monitor | 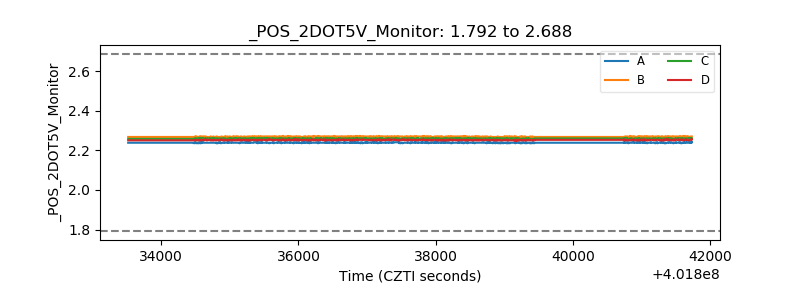 |
| +5 Volts monitor | 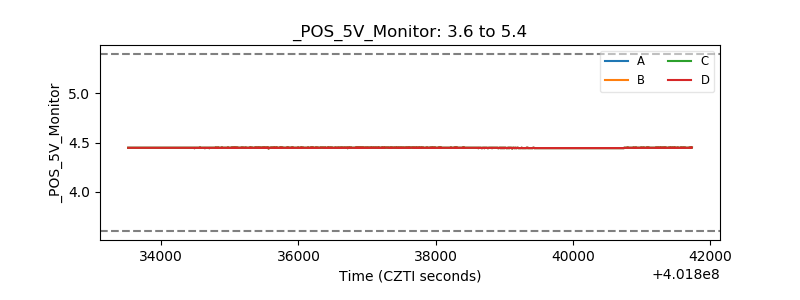 |
| _ROLL_ROT | 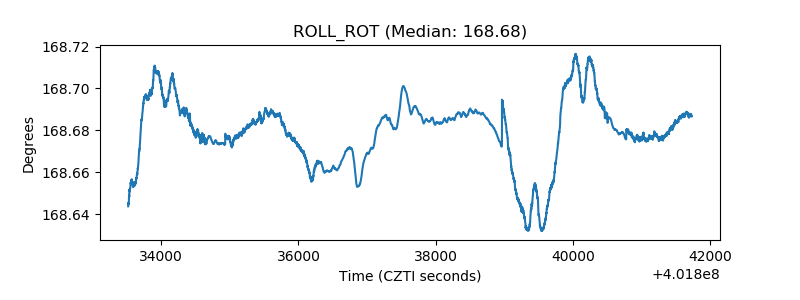 |
| _Roll_DEC | 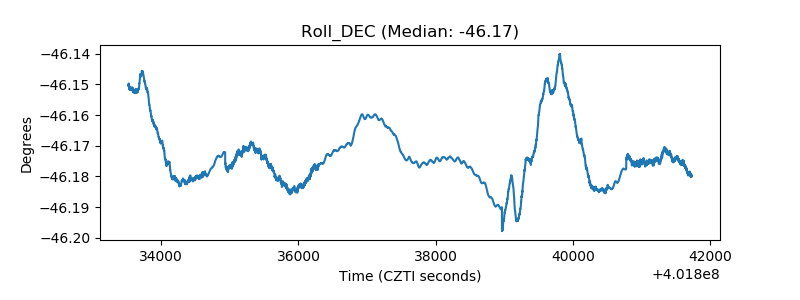 |
| _Roll_RA | 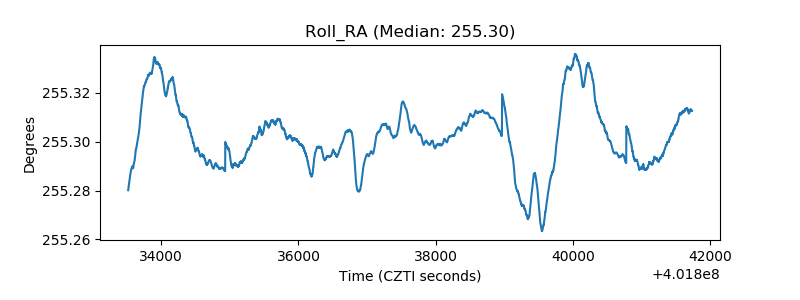 |
| Veto Counter | 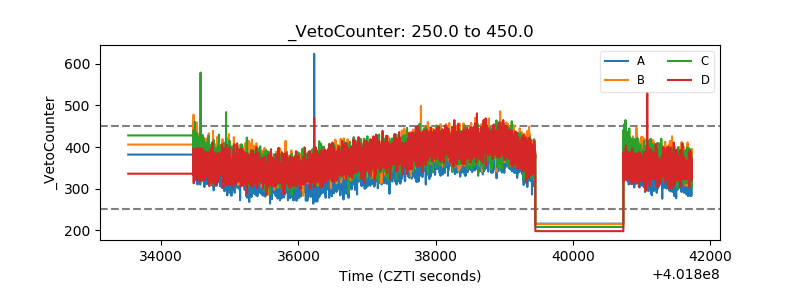 |