| Param | Original file | Final file |
|---|---|---|
| Filename | modeM0/AS1T05_054T01_9000005350_37818cztM0_level2.evt | modeM0/AS1T05_054T01_9000005350_37818cztM0_level2_quad_clean.evt |
| Size (bytes) | 886,968,000 | 125,821,440 |
| Size | 845.9 MB | 120.0 MB |
| Events in quadrant A | 5,635,283 | 775,895 |
| Events in quadrant B | 7,280,489 | 763,423 |
| Events in quadrant C | 5,605,877 | 783,682 |
| Events in quadrant D | 7,605,886 | 734,840 |
| Mode M9 | |||
|---|---|---|---|
| Quadrant | BADHDUFLAG | Total packets | Discarded packets |
| A | 0 | 40 | 0 |
| B | 0 | 40 | 0 |
| C | 0 | 40 | 0 |
| D | 0 | 40 | 0 |
| Mode SS | |||
|---|---|---|---|
| Quadrant | BADHDUFLAG | Total packets | Discarded packets |
| A | 0 | 224 | 0 |
| B | 0 | 224 | 0 |
| C | 0 | 224 | 0 |
| D | 0 | 224 | 0 |
| Mode M0 | |||
|---|---|---|---|
| Quadrant | BADHDUFLAG | Total packets | Discarded packets |
| A | 0 | 23155 | 4 |
| B | 0 | 28849 | 3 |
| C | 0 | 23159 | 3 |
| D | 0 | 29997 | 3 |
| Quadrant | Total seconds | Saturated seconds | Saturation percentage |
|---|---|---|---|
| A | 10864 | 34 | 0.312960% |
| B | 10864 | 462 | 4.252577% |
| C | 10864 | 41 | 0.377393% |
| D | 10864 | 593 | 5.458395% |
Noise dominated data is calculated using 1-second bins in cleaned event files. If a bin has >2000 counts, and if more than 50% of those come from <1% of pixels, then it is considered to be noise-dominated and hence unusable.
| Quadrant | # 1 sec bins | Bins with >0 counts | Bins with >2000 counts | High rate bins dominated by noise | Noise dominated (total time) | Noise dominated (detector-on time) | Marked lightcurve |
|---|---|---|---|---|---|---|---|
| A | 14893 | 10867 | 20 | 20 | 0.13% | 0.18% | 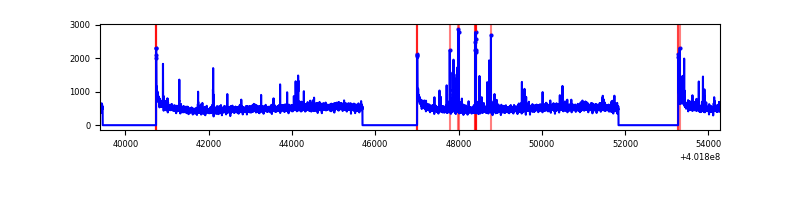 |
| B | 14893 | 10867 | 336 | 336 | 2.26% | 3.09% | 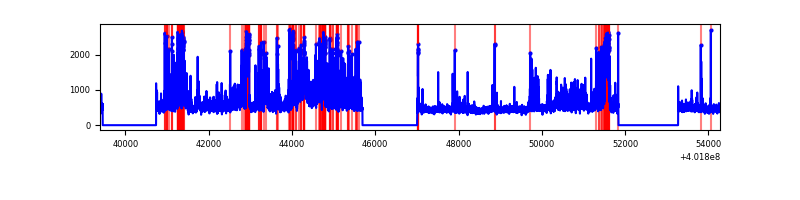 |
| C | 14893 | 10867 | 40 | 40 | 0.27% | 0.37% | 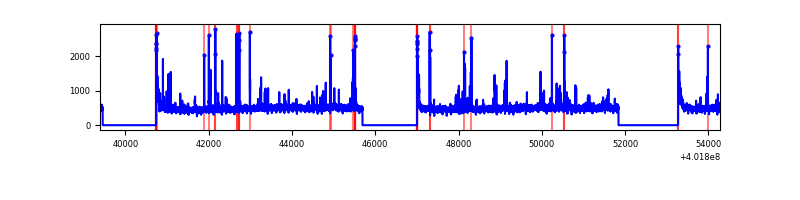 |
| D | 14892 | 10866 | 392 | 392 | 2.63% | 3.61% | 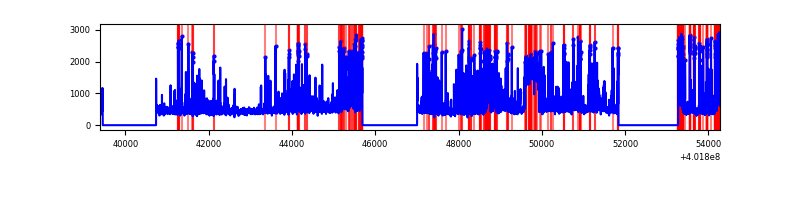 |
Top three noisy pixels from each quadrant. If the there are fewer than three noisy pixels in the level2.evt file, extra rows are filled as -1
| Pixel properties | Quadrant properties | ||||||
|---|---|---|---|---|---|---|---|
| Quadrant | DetID | PixID | Counts | Sigma | Mean | Median | Sigma |
| A | 10 | 83 | 635276 | 2554.28 | 1227 | 1203 | 248.2 |
| A | 9 | 143 | 111262 | 443.36 | 1227 | 1203 | 248.2 |
| A | 7 | 16 | 58025 | 228.9 | 1227 | 1203 | 248.2 |
| B | 4 | 171 | 1625307 | 7118.3 | 1202 | 1170 | 228.2 |
| B | 5 | 172 | 444281 | 1942.08 | 1202 | 1170 | 228.2 |
| B | 0 | 189 | 185820 | 809.29 | 1202 | 1170 | 228.2 |
| C | 15 | 214 | 490691 | 1757.78 | 1192 | 1198 | 278.5 |
| C | 0 | 10 | 175086 | 624.43 | 1192 | 1198 | 278.5 |
| C | 14 | 254 | 107493 | 381.71 | 1192 | 1198 | 278.5 |
| D | 2 | 249 | 874317 | 3058.22 | 1175 | 1145 | 285.5 |
| D | 13 | 249 | 602337 | 2105.63 | 1175 | 1145 | 285.5 |
| D | 10 | 204 | 390856 | 1364.93 | 1175 | 1145 | 285.5 |
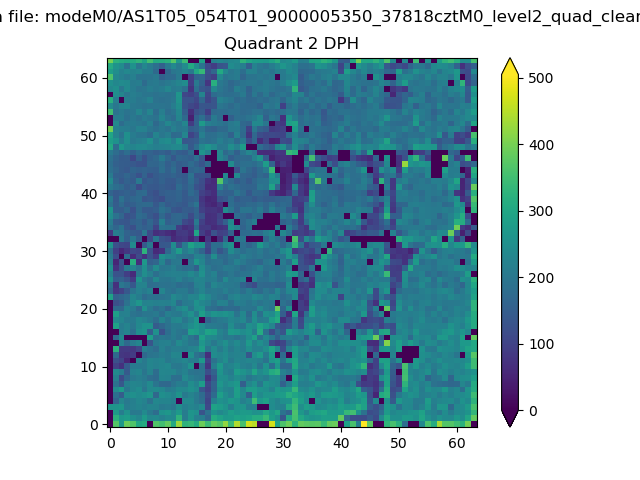
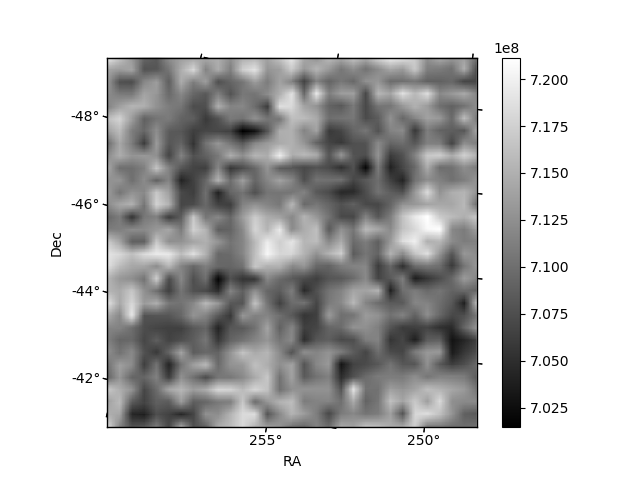
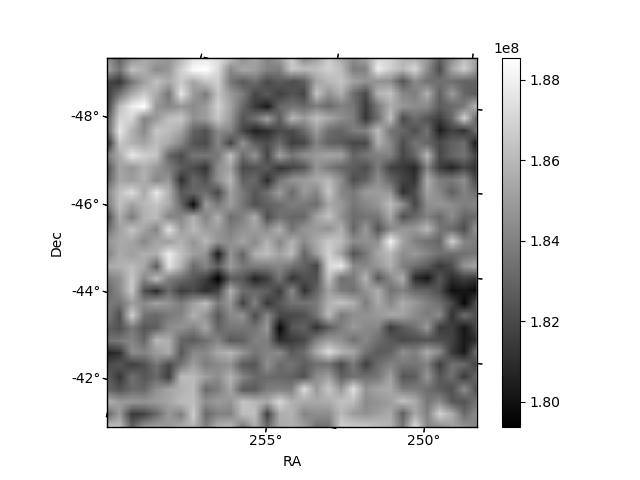
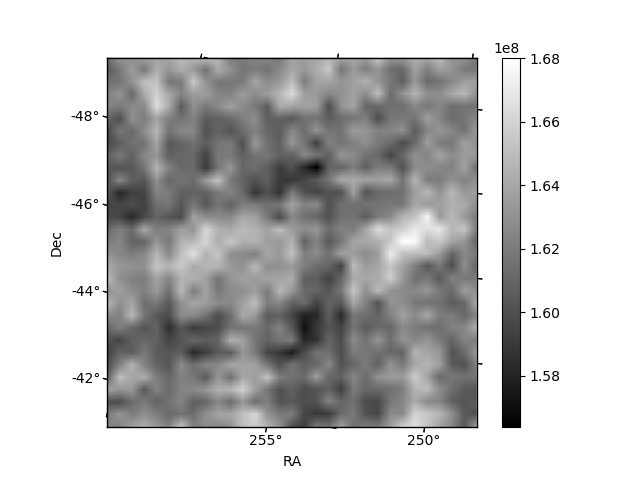
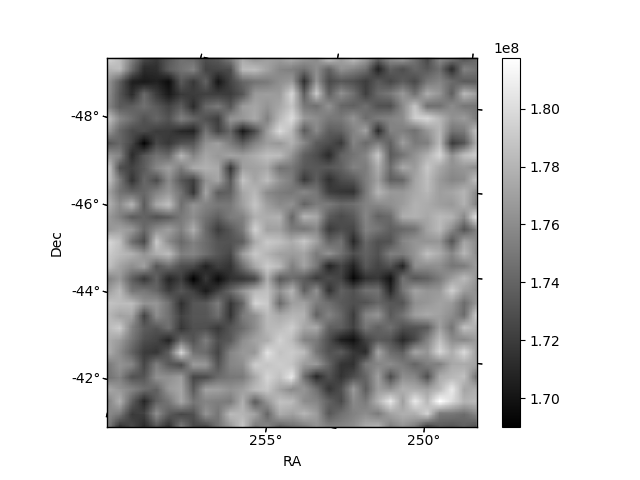
Histogram calculated using DETX and DETY for each event in the final _common_clean file
| Quadrant A | 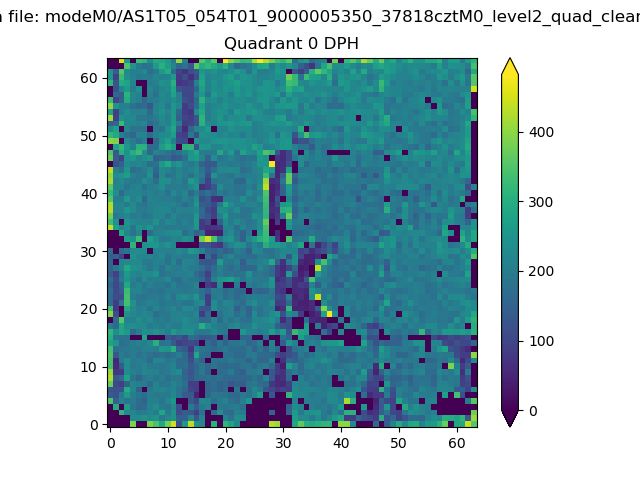 |
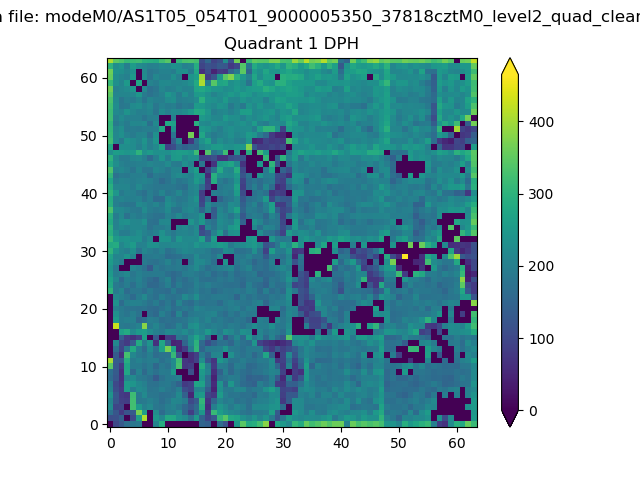 |
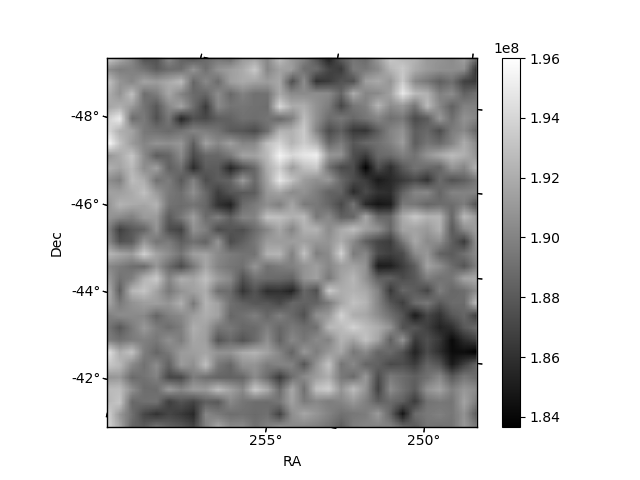
Quadrant B |
|---|---|---|---|
| Quadrant D | 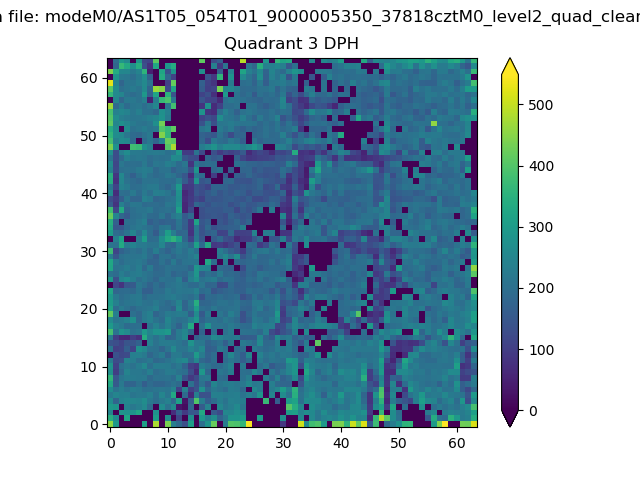 |
 |
Quadrant C |
| Plot type | Count rate plots | Images |
|---|---|---|
| Comparison with Poisson distribution Blue bars denote a histogram of data divided into 1 sec bins. Red curve is a Poisson curve with rate = median count rate of data. |
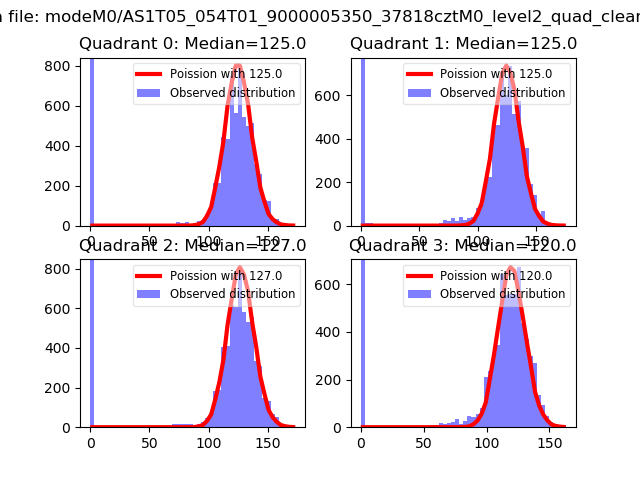 |
 |
| Quadrant-wise count rates Data is divided into 100 sec bins |
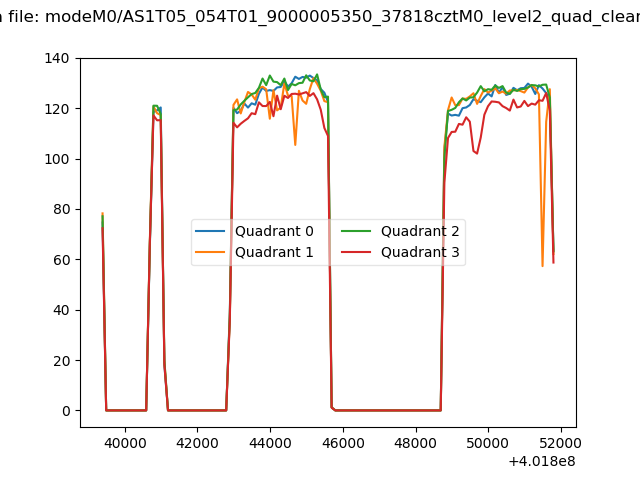 |
|
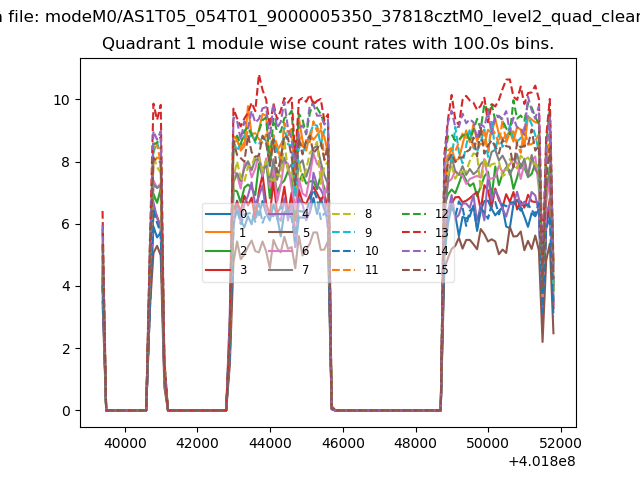
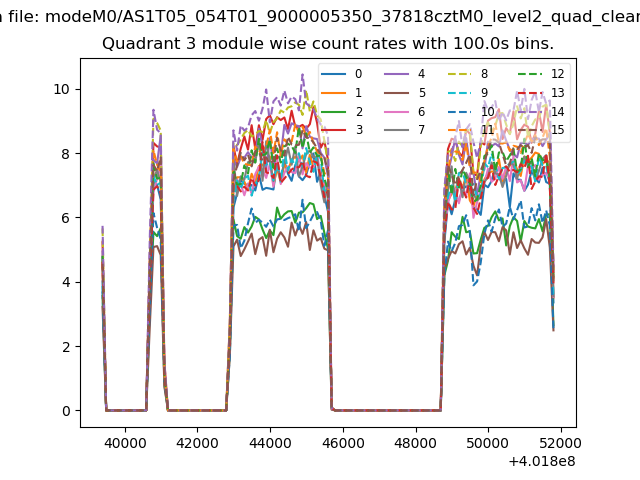
| Module-wise count rates for Quadrant A Data is divided into 100 sec bins |
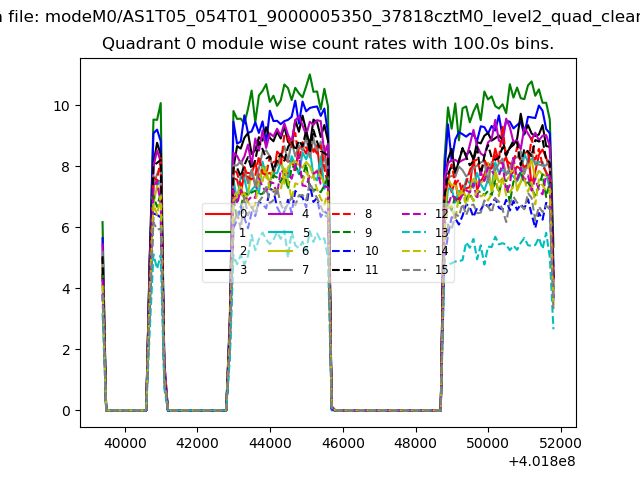 |
 |
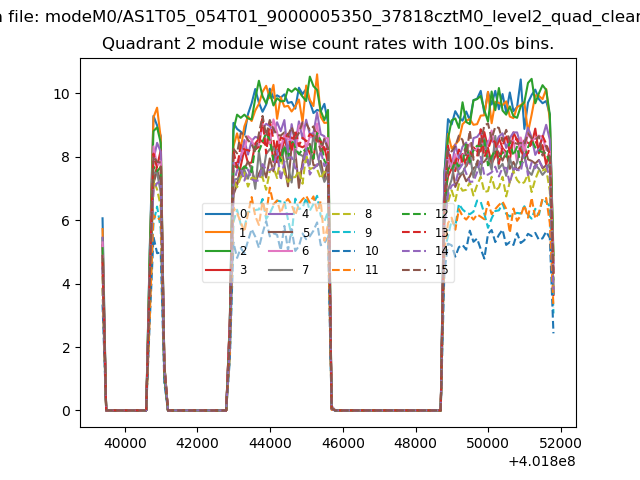
| Module-wise count rates for Quadrant B Data is divided into 100 sec bins |
 |
 |
| Module-wise count rates for Quadrant C Data is divided into 100 sec bins |
 |
 |
| Module-wise count rates for Quadrant D Data is divided into 100 sec bins |
 |
 |
| Parameter | Plot |
|---|---|
| CZT HV Monitor | 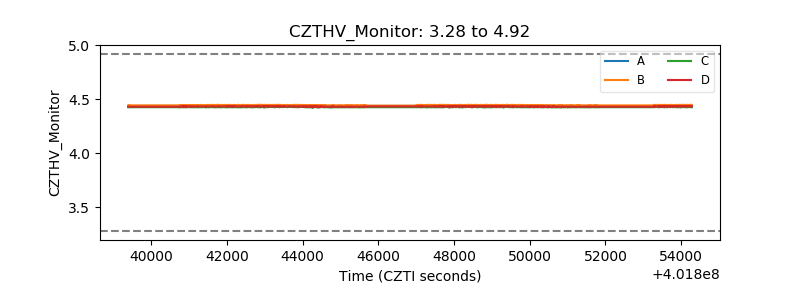 |
| D_VDD | 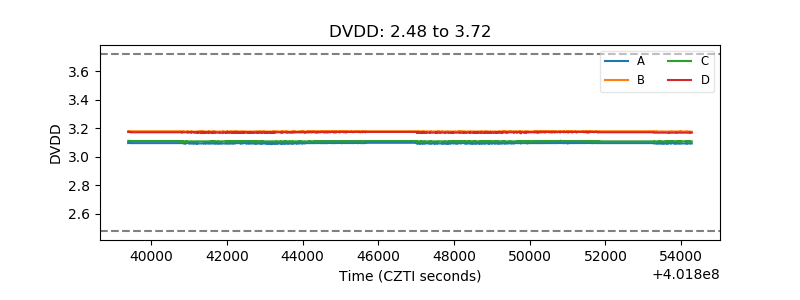 |
| Temperature 1 | 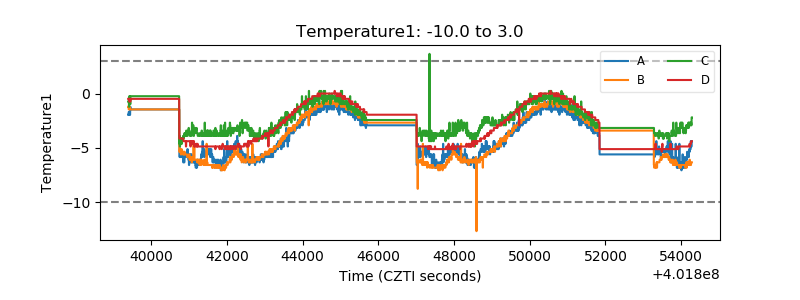 |
| Veto HV Monitor | 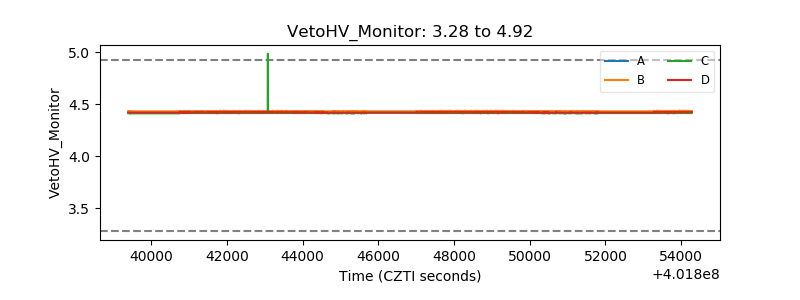 |
| Veto LLD | 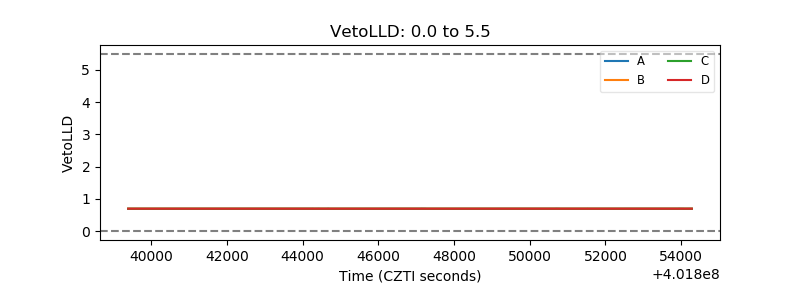 |
| Alpha Counter | 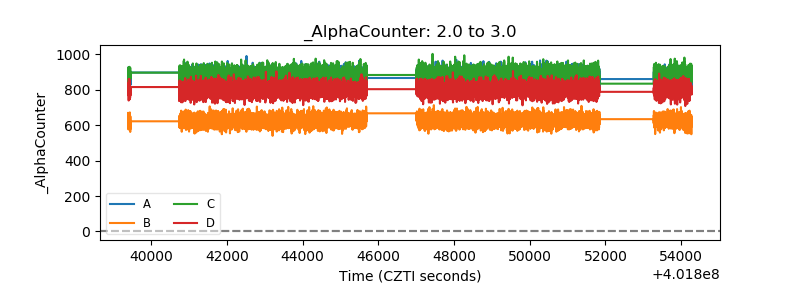 |
| _CPM_Rate | 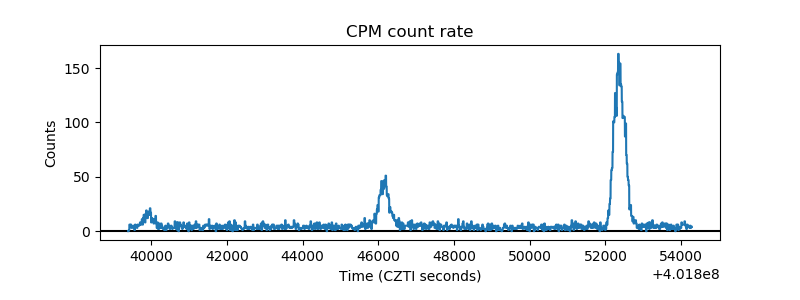 |
| CZT Counter | 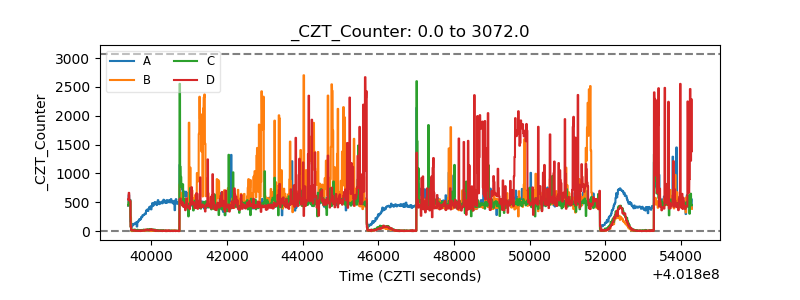 |
| +2.5 Volts monitor | 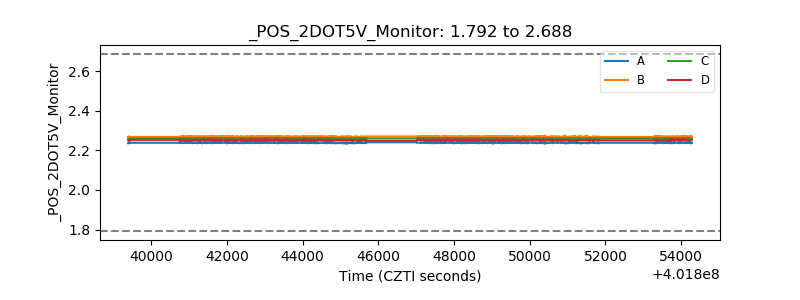 |
| +5 Volts monitor | 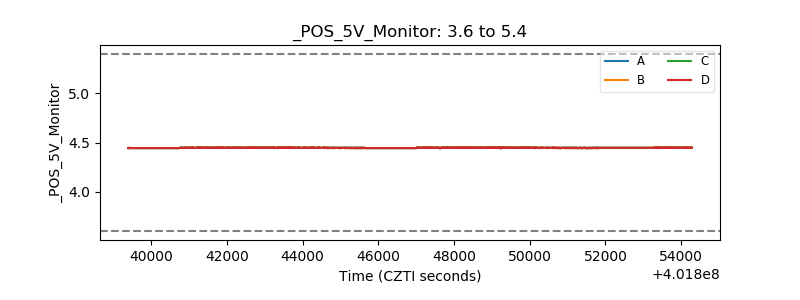 |
| _ROLL_ROT | 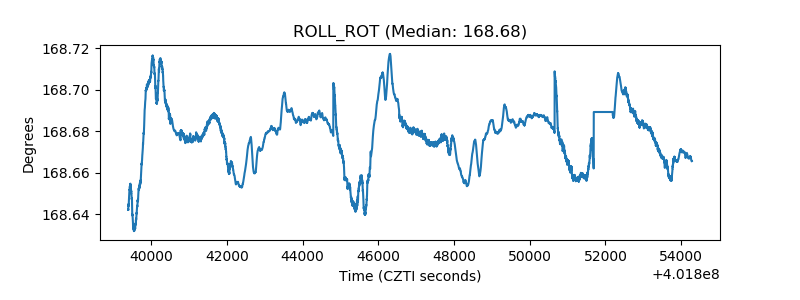 |
| _Roll_DEC | 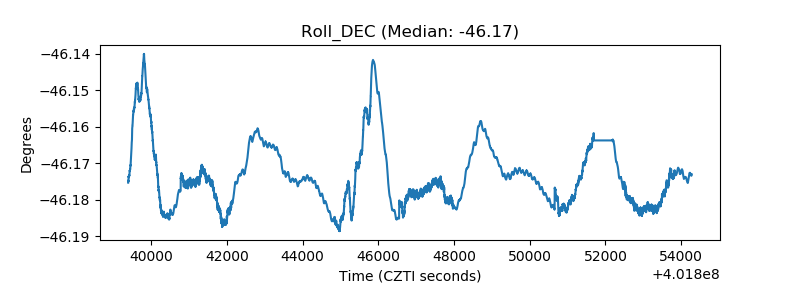 |
| _Roll_RA | 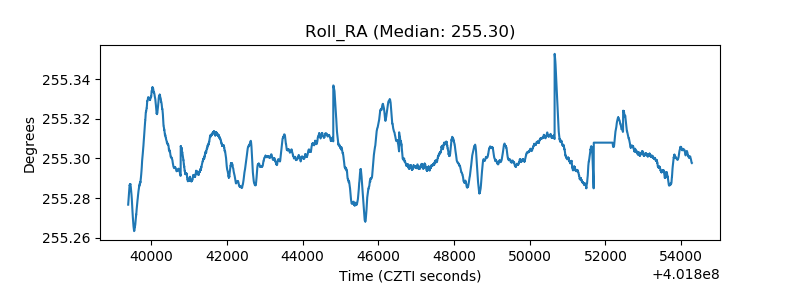 |
| Veto Counter | 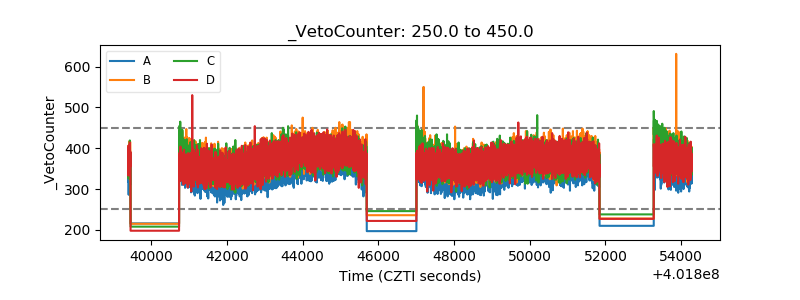 |