| Param | Original file | Final file |
|---|---|---|
| Filename | modeM0/AS1T05_054T01_9000005350_37820cztM0_level2.evt | modeM0/AS1T05_054T01_9000005350_37820cztM0_level2_quad_clean.evt |
| Size (bytes) | 423,345,600 | 78,644,160 |
| Size | 403.7 MB | 75.0 MB |
| Events in quadrant A | 2,910,691 | 502,554 |
| Events in quadrant B | 3,193,478 | 506,078 |
| Events in quadrant C | 3,024,336 | 508,508 |
| Events in quadrant D | 3,319,547 | 480,233 |
| Mode M9 | |||
|---|---|---|---|
| Quadrant | BADHDUFLAG | Total packets | Discarded packets |
| A | 0 | 22 | 0 |
| B | 0 | 22 | 0 |
| C | 0 | 22 | 0 |
| D | 0 | 23 | 0 |
| Mode SS | |||
|---|---|---|---|
| Quadrant | BADHDUFLAG | Total packets | Discarded packets |
| A | 0 | 112 | 0 |
| B | 0 | 112 | 0 |
| C | 0 | 112 | 0 |
| D | 0 | 112 | 0 |
| Mode M0 | |||
|---|---|---|---|
| Quadrant | BADHDUFLAG | Total packets | Discarded packets |
| A | 0 | 11965 | 3 |
| B | 0 | 12901 | 2 |
| C | 0 | 12276 | 2 |
| D | 0 | 13511 | 2 |
| Quadrant | Total seconds | Saturated seconds | Saturation percentage |
|---|---|---|---|
| A | 5489 | 33 | 0.601202% |
| B | 5489 | 102 | 1.858262% |
| C | 5489 | 40 | 0.728730% |
| D | 5489 | 199 | 3.625433% |
Noise dominated data is calculated using 1-second bins in cleaned event files. If a bin has >2000 counts, and if more than 50% of those come from <1% of pixels, then it is considered to be noise-dominated and hence unusable.
| Quadrant | # 1 sec bins | Bins with >0 counts | Bins with >2000 counts | High rate bins dominated by noise | Noise dominated (total time) | Noise dominated (detector-on time) | Marked lightcurve |
|---|---|---|---|---|---|---|---|
| A | 7162 | 5490 | 14 | 14 | 0.20% | 0.26% | 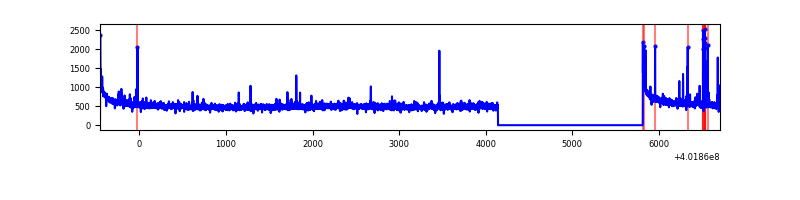 |
| B | 7162 | 5490 | 69 | 69 | 0.96% | 1.26% |  |
| C | 7162 | 5490 | 25 | 25 | 0.35% | 0.46% | 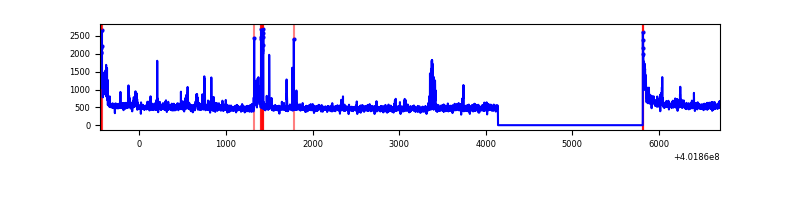 |
| D | 7162 | 5490 | 167 | 167 | 2.33% | 3.04% | 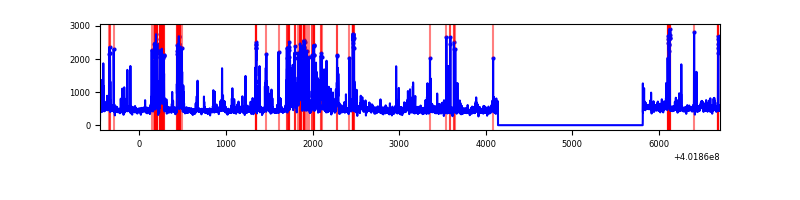 |
Top three noisy pixels from each quadrant. If the there are fewer than three noisy pixels in the level2.evt file, extra rows are filled as -1
| Pixel properties | Quadrant properties | ||||||
|---|---|---|---|---|---|---|---|
| Quadrant | DetID | PixID | Counts | Sigma | Mean | Median | Sigma |
| A | 10 | 83 | 347910 | 2704.28 | 634 | 622 | 128.4 |
| A | 9 | 143 | 73647 | 568.63 | 634 | 622 | 128.4 |
| A | 10 | 255 | 13321 | 98.89 | 634 | 622 | 128.4 |
| B | 0 | 229 | 263592 | 2182.62 | 629 | 614 | 120.5 |
| B | 4 | 171 | 127605 | 1053.98 | 629 | 614 | 120.5 |
| B | 0 | 189 | 114328 | 943.78 | 629 | 614 | 120.5 |
| C | 15 | 214 | 251847 | 1734.09 | 622 | 625 | 144.9 |
| C | 15 | 159 | 139265 | 956.98 | 622 | 625 | 144.9 |
| C | 0 | 10 | 129720 | 891.09 | 622 | 625 | 144.9 |
| D | 2 | 249 | 354189 | 2341.64 | 613 | 596 | 151.0 |
| D | 10 | 253 | 190408 | 1257.02 | 613 | 596 | 151.0 |
| D | 13 | 249 | 119824 | 789.58 | 613 | 596 | 151.0 |
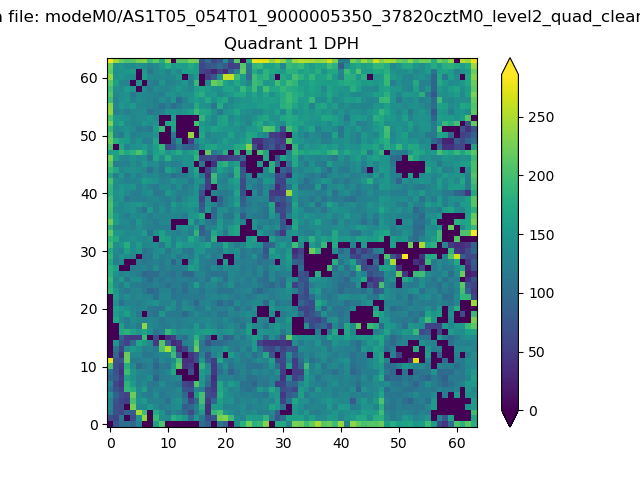
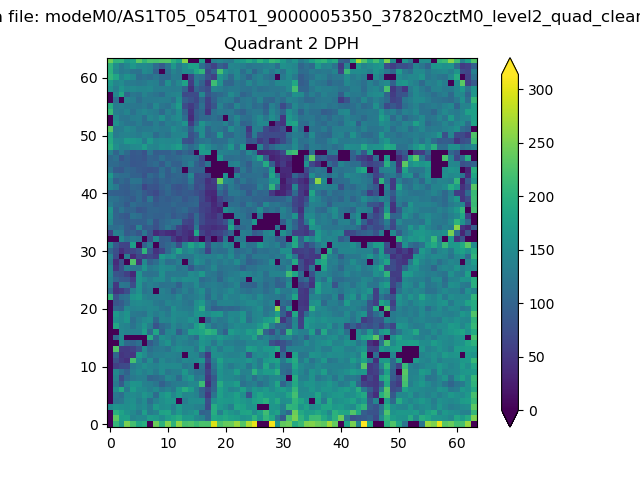
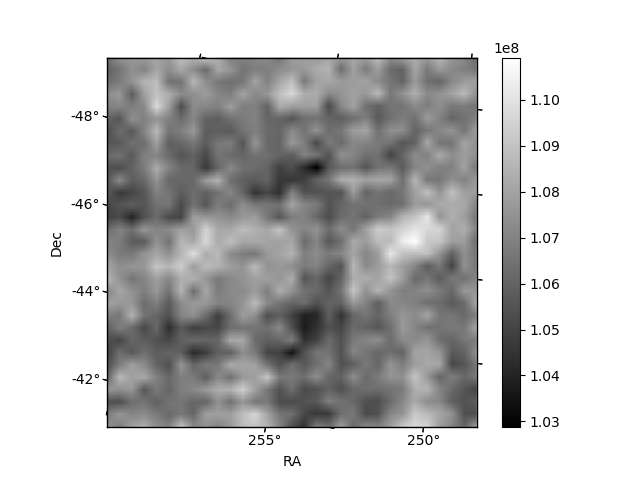
Histogram calculated using DETX and DETY for each event in the final _common_clean file
| Quadrant A |  |
 |
Quadrant B |
|---|---|---|---|
| Quadrant D | 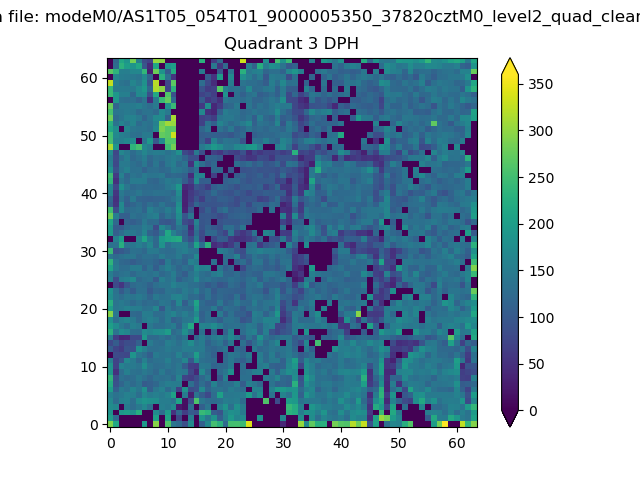 |
 |
Quadrant C |
| Plot type | Count rate plots | Images |
|---|---|---|
| Comparison with Poisson distribution Blue bars denote a histogram of data divided into 1 sec bins. Red curve is a Poisson curve with rate = median count rate of data. |
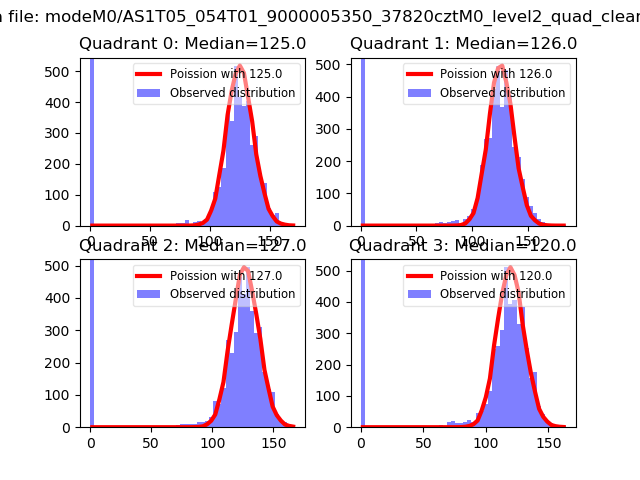 |
 |
| Quadrant-wise count rates Data is divided into 100 sec bins |
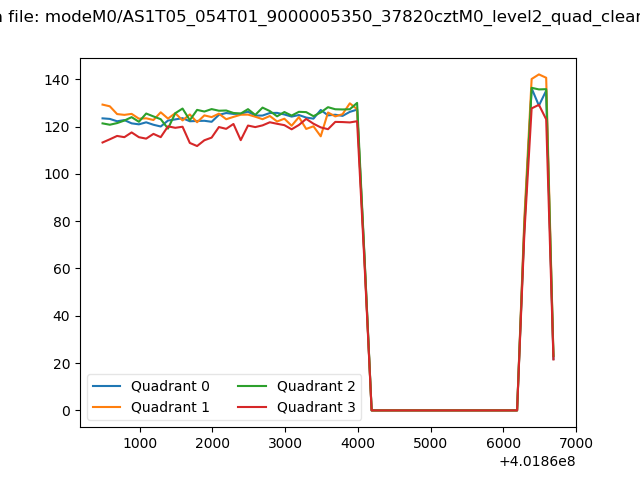 |
|
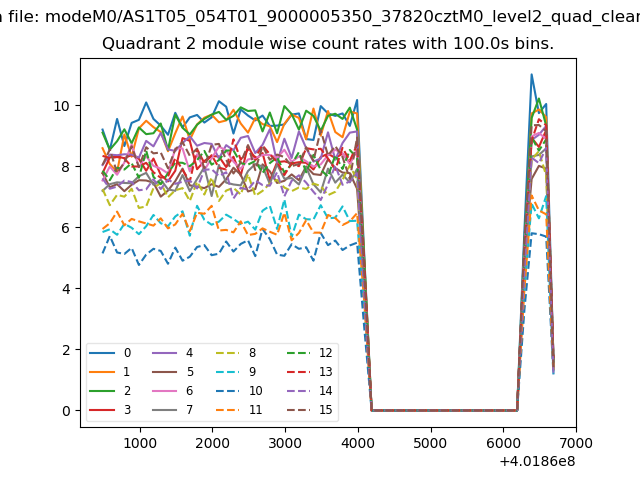
| Module-wise count rates for Quadrant A Data is divided into 100 sec bins |
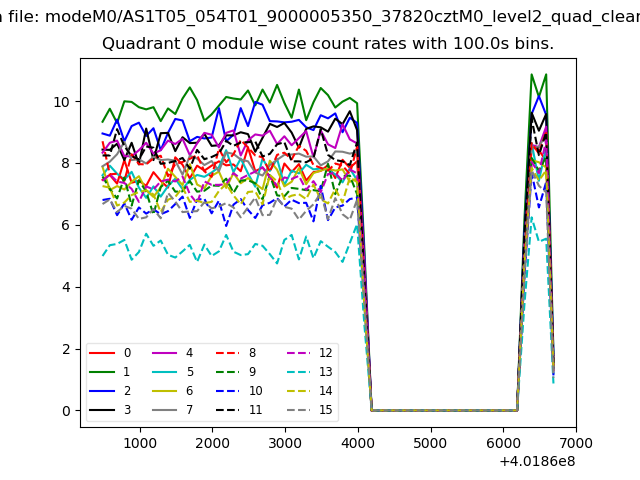 |
 |
| Module-wise count rates for Quadrant B Data is divided into 100 sec bins |
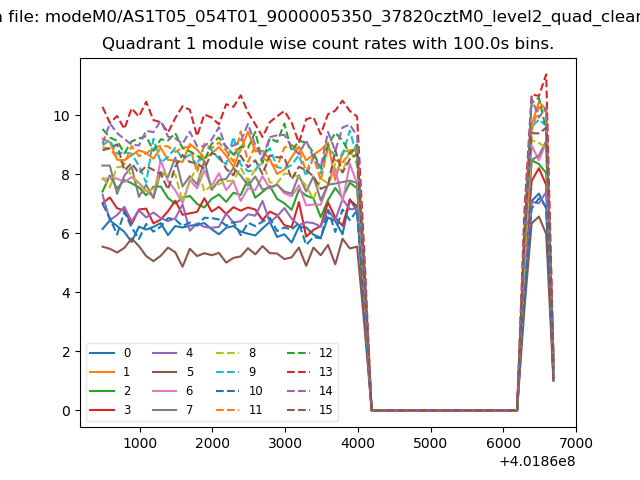 |
 |
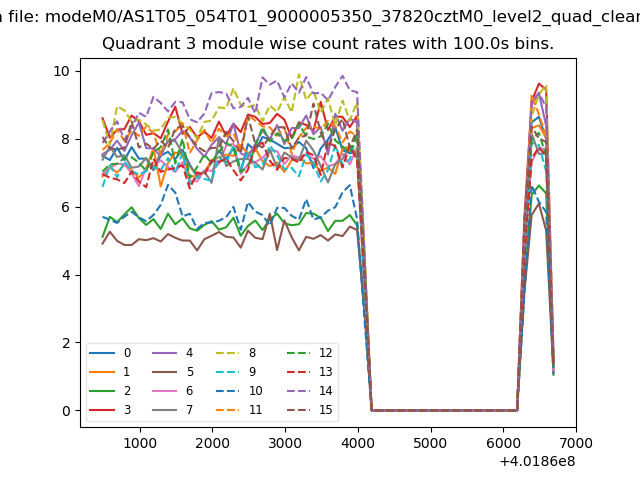
| Module-wise count rates for Quadrant C Data is divided into 100 sec bins |
 |
 |
| Module-wise count rates for Quadrant D Data is divided into 100 sec bins |
 |
 |
| Parameter | Plot |
|---|---|
| CZT HV Monitor | 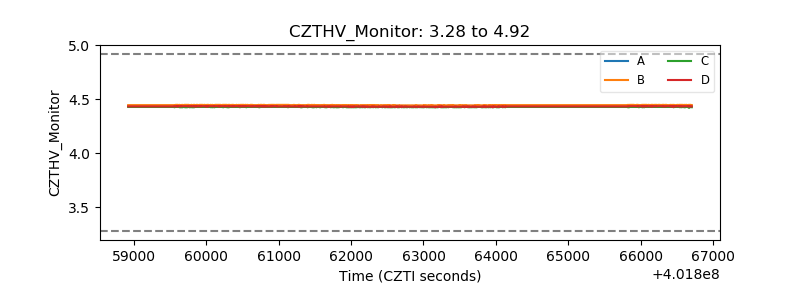 |
| D_VDD | 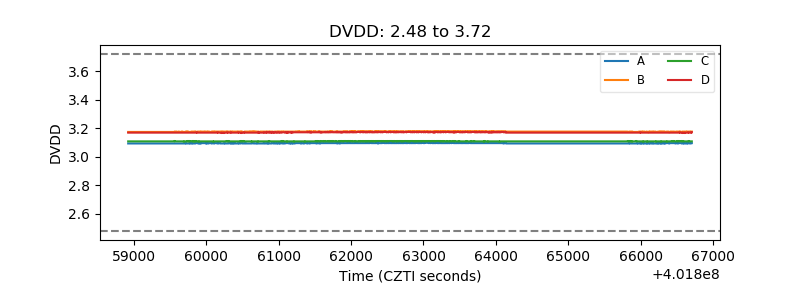 |
| Temperature 1 | 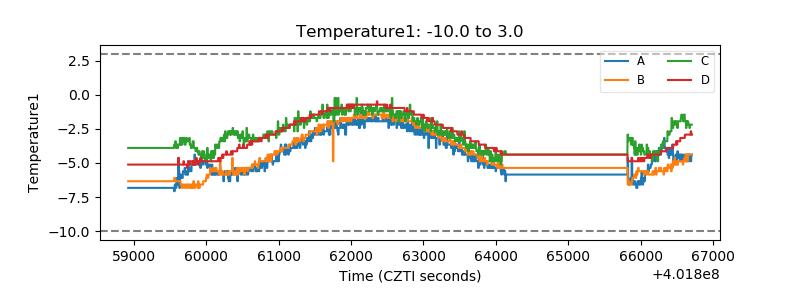 |
| Veto HV Monitor | 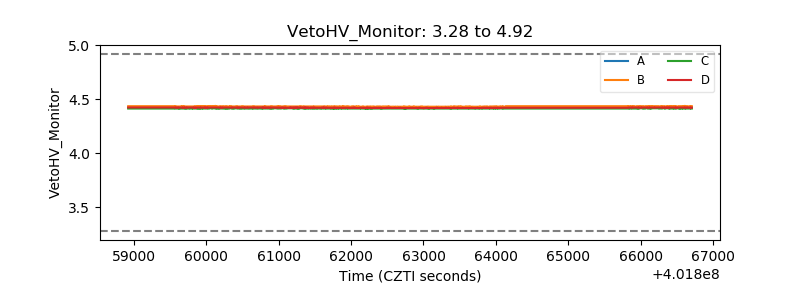 |
| Veto LLD | 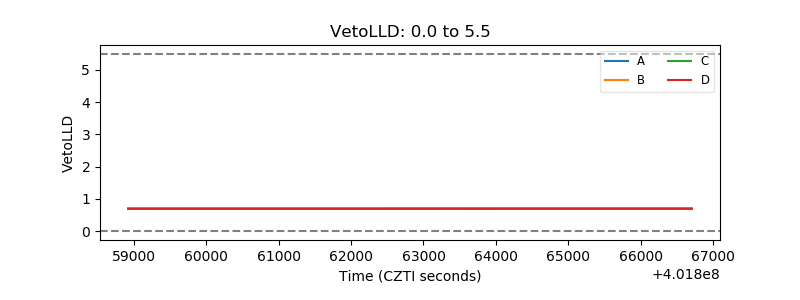 |
| Alpha Counter | 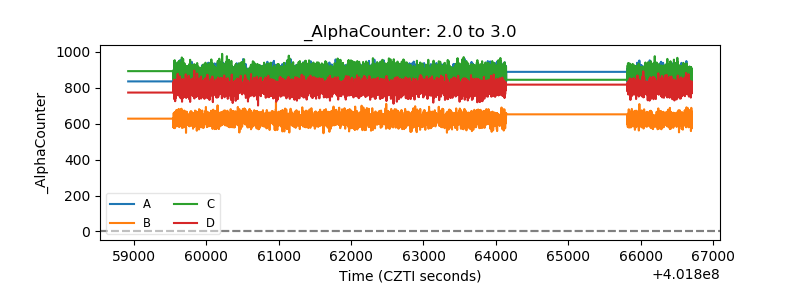 |
| _CPM_Rate | 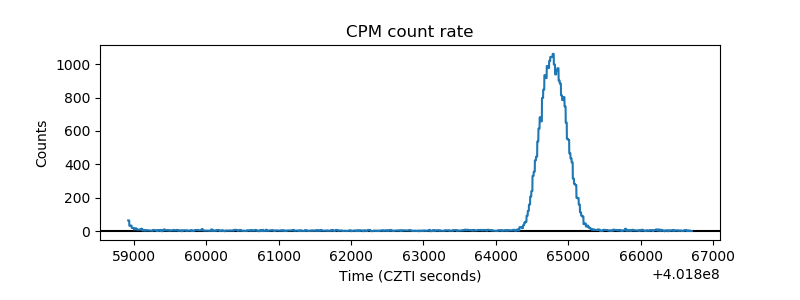 |
| CZT Counter | 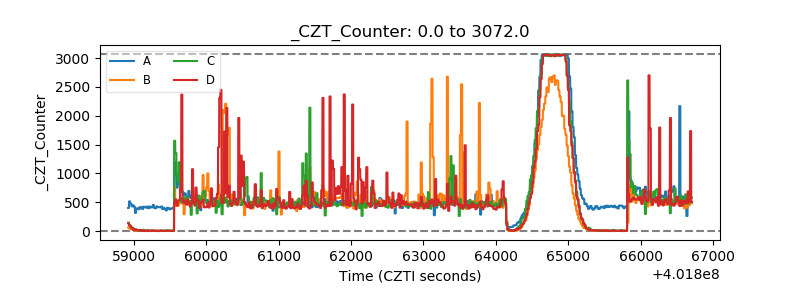 |
| +2.5 Volts monitor | 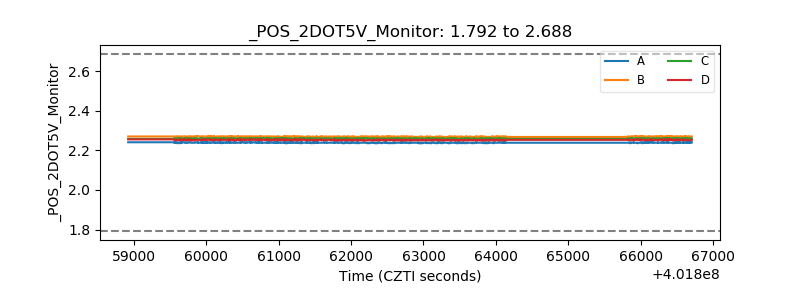 |
| +5 Volts monitor | 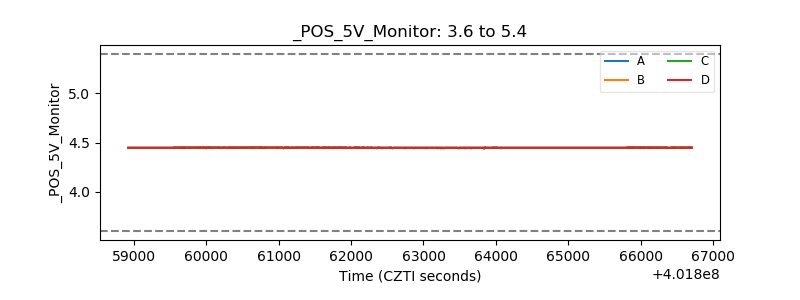 |
| _ROLL_ROT | 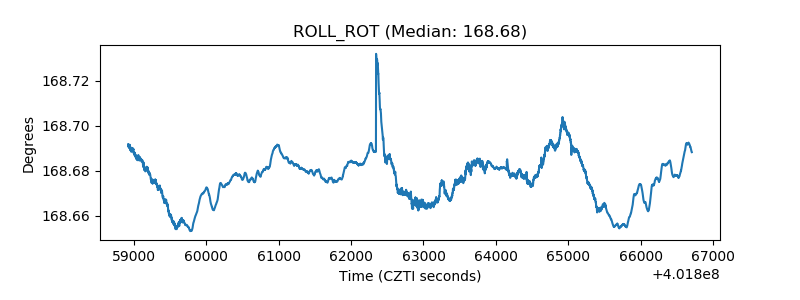 |
| _Roll_DEC | 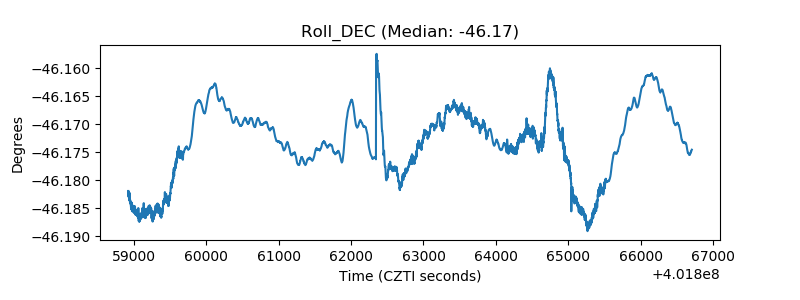 |
| _Roll_RA | 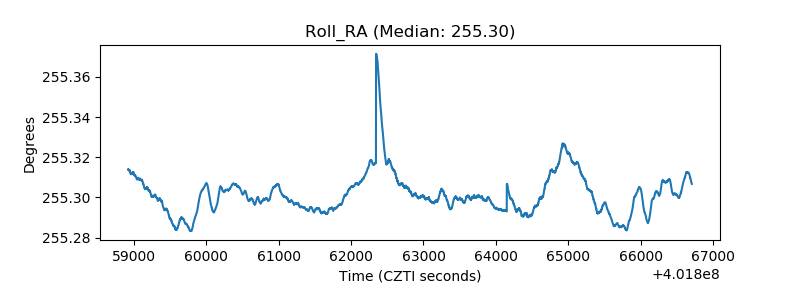 |
| Veto Counter | 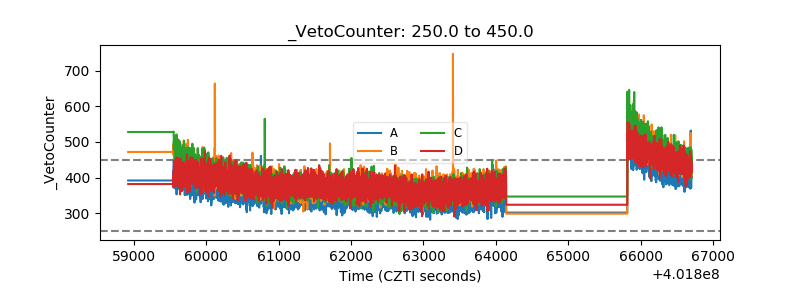 |