| Param | Original file | Final file |
|---|---|---|
| Filename | modeM0/AS1T05_054T01_9000005350_37822cztM0_level2.evt | modeM0/AS1T05_054T01_9000005350_37822cztM0_level2_quad_clean.evt |
| Size (bytes) | 424,301,760 | 95,057,280 |
| Size | 404.6 MB | 90.7 MB |
| Events in quadrant A | 3,064,973 | 627,950 |
| Events in quadrant B | 2,840,425 | 643,941 |
| Events in quadrant C | 2,890,046 | 638,839 |
| Events in quadrant D | 3,692,097 | 594,404 |
| Mode M9 | |||
|---|---|---|---|
| Quadrant | BADHDUFLAG | Total packets | Discarded packets |
| A | 0 | 28 | 0 |
| B | 0 | 28 | 0 |
| C | 0 | 28 | 0 |
| D | 0 | 29 | 0 |
| Mode SS | |||
|---|---|---|---|
| Quadrant | BADHDUFLAG | Total packets | Discarded packets |
| A | 0 | 110 | 0 |
| B | 0 | 110 | 0 |
| C | 0 | 110 | 0 |
| D | 0 | 110 | 0 |
| Mode M0 | |||
|---|---|---|---|
| Quadrant | BADHDUFLAG | Total packets | Discarded packets |
| A | 0 | 12290 | 3 |
| B | 0 | 11720 | 2 |
| C | 0 | 11841 | 2 |
| D | 0 | 14374 | 2 |
| Quadrant | Total seconds | Saturated seconds | Saturation percentage |
|---|---|---|---|
| A | 5330 | 58 | 1.088180% |
| B | 5330 | 23 | 0.431520% |
| C | 5330 | 28 | 0.525328% |
| D | 5330 | 185 | 3.470919% |
Noise dominated data is calculated using 1-second bins in cleaned event files. If a bin has >2000 counts, and if more than 50% of those come from <1% of pixels, then it is considered to be noise-dominated and hence unusable.
| Quadrant | # 1 sec bins | Bins with >0 counts | Bins with >2000 counts | High rate bins dominated by noise | Noise dominated (total time) | Noise dominated (detector-on time) | Marked lightcurve |
|---|---|---|---|---|---|---|---|
| A | 7153 | 5331 | 36 | 36 | 0.50% | 0.68% | 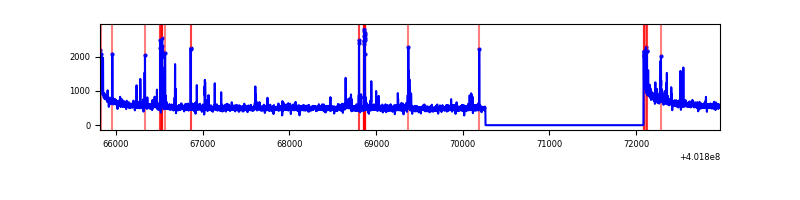 |
| B | 7153 | 5331 | 10 | 10 | 0.14% | 0.19% | 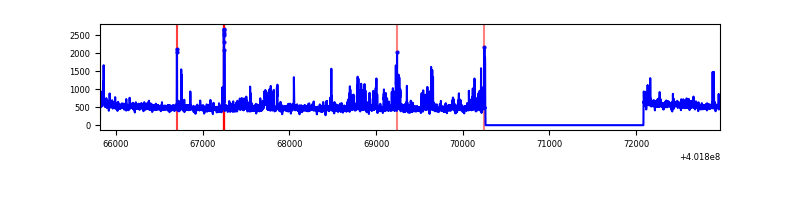 |
| C | 7153 | 5331 | 14 | 14 | 0.20% | 0.26% | 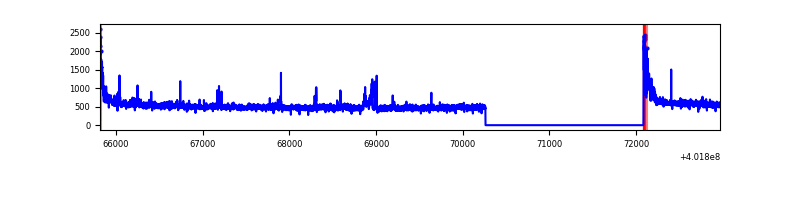 |
| D | 7153 | 5331 | 202 | 202 | 2.82% | 3.79% | 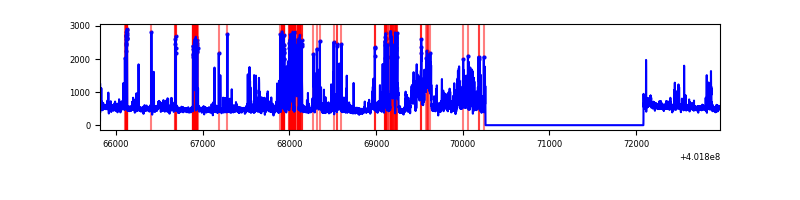 |
Top three noisy pixels from each quadrant. If the there are fewer than three noisy pixels in the level2.evt file, extra rows are filled as -1
| Pixel properties | Quadrant properties | ||||||
|---|---|---|---|---|---|---|---|
| Quadrant | DetID | PixID | Counts | Sigma | Mean | Median | Sigma |
| A | 10 | 83 | 357119 | 2752.57 | 644 | 633 | 129.5 |
| A | 9 | 143 | 155127 | 1192.91 | 644 | 633 | 129.5 |
| A | 12 | 189 | 25285 | 190.35 | 644 | 633 | 129.5 |
| B | 0 | 229 | 134244 | 1099.91 | 637 | 621 | 121.5 |
| B | 0 | 189 | 51604 | 419.66 | 637 | 621 | 121.5 |
| B | 4 | 81 | 42714 | 346.48 | 637 | 621 | 121.5 |
| C | 15 | 214 | 245788 | 1707.97 | 624 | 629 | 143.5 |
| C | 0 | 10 | 129403 | 897.14 | 624 | 629 | 143.5 |
| C | 15 | 159 | 43657 | 299.77 | 624 | 629 | 143.5 |
| D | 2 | 249 | 394247 | 2610.7 | 620 | 605 | 150.8 |
| D | 7 | 223 | 324119 | 2145.6 | 620 | 605 | 150.8 |
| D | 12 | 218 | 237014 | 1567.9 | 620 | 605 | 150.8 |
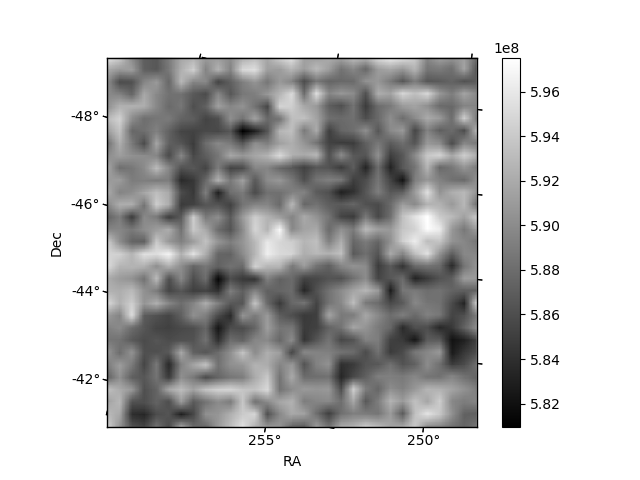
Histogram calculated using DETX and DETY for each event in the final _common_clean file
| Quadrant A | 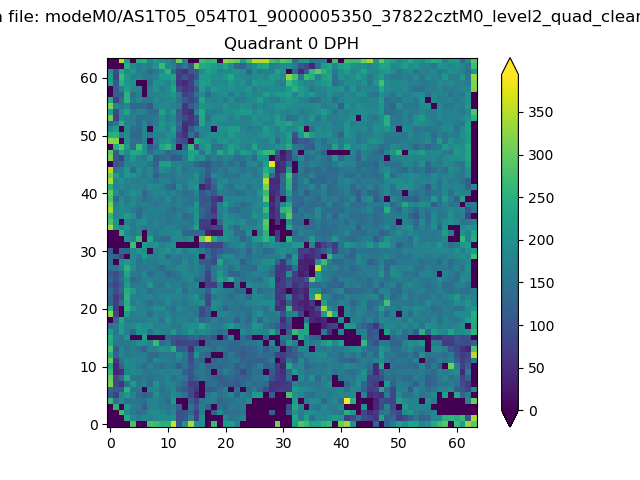 |
 |
Quadrant B |
|---|---|---|---|
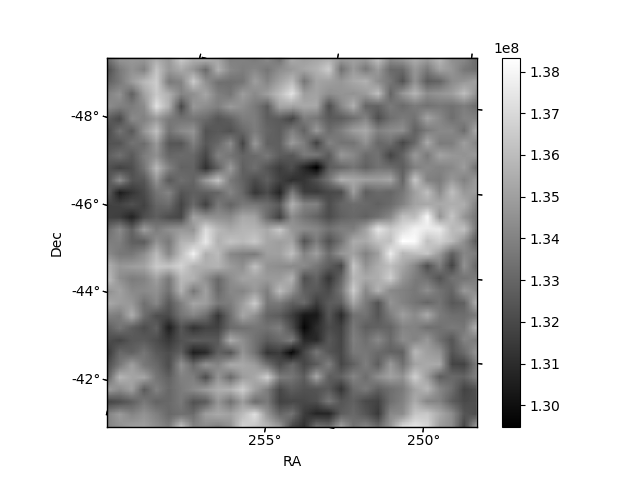
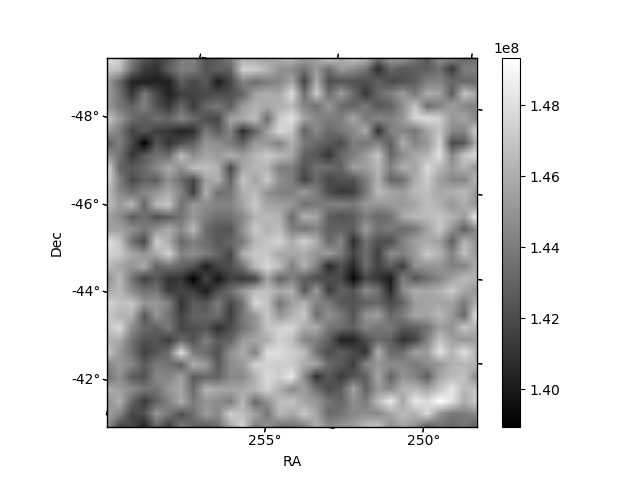
| Quadrant D | 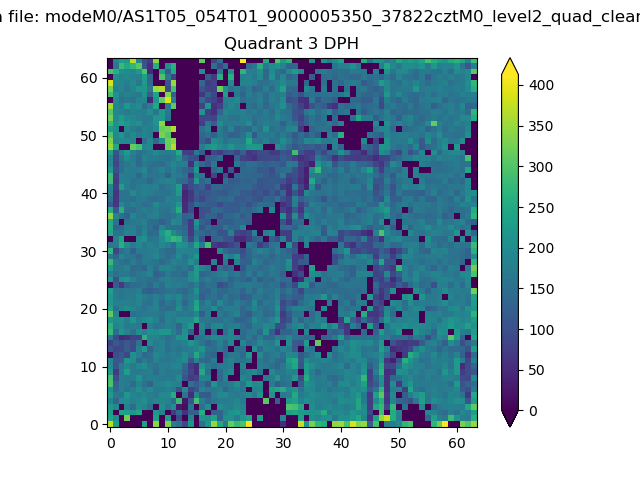 |
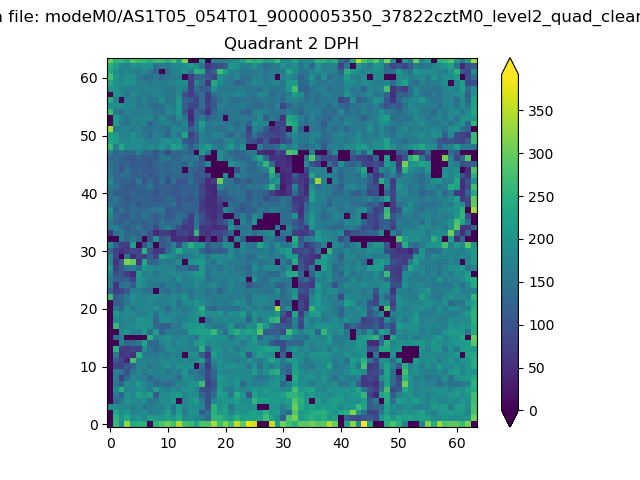 |
Quadrant C |
| Plot type | Count rate plots | Images |
|---|---|---|
| Comparison with Poisson distribution Blue bars denote a histogram of data divided into 1 sec bins. Red curve is a Poisson curve with rate = median count rate of data. |
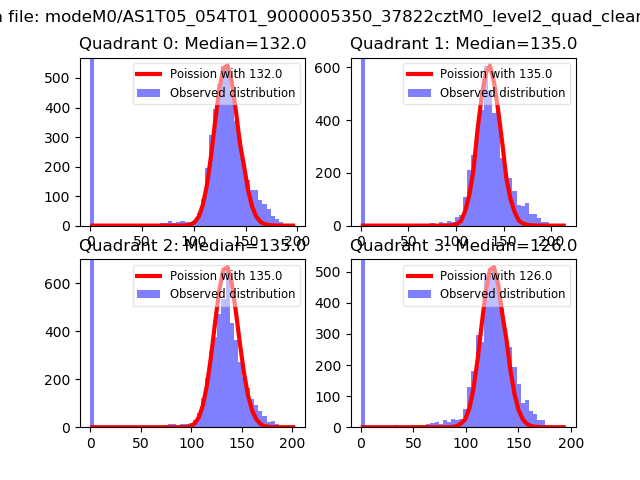 |
 |
| Quadrant-wise count rates Data is divided into 100 sec bins |
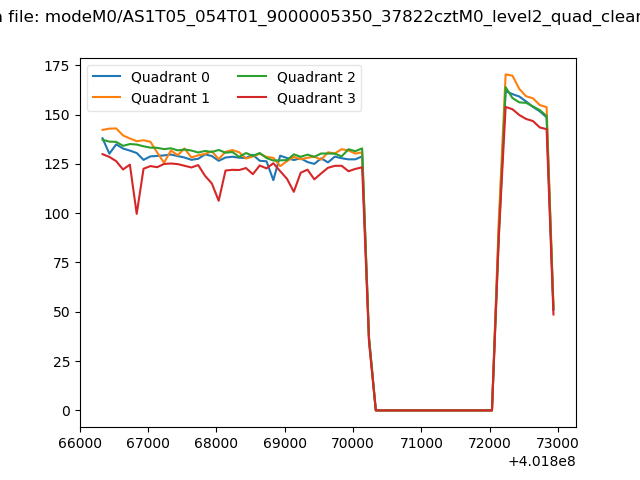 |
|
| Module-wise count rates for Quadrant A Data is divided into 100 sec bins |
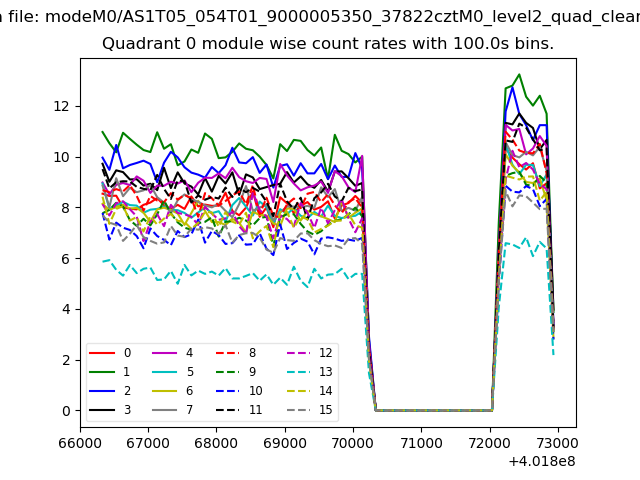 |
 |
| Module-wise count rates for Quadrant B Data is divided into 100 sec bins |
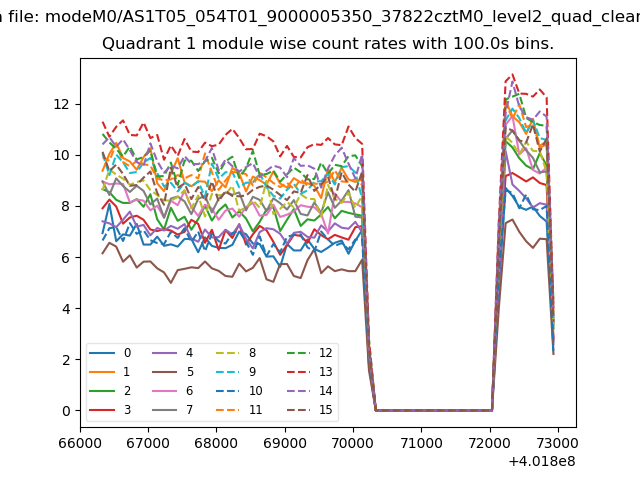 |
 |
| Module-wise count rates for Quadrant C Data is divided into 100 sec bins |
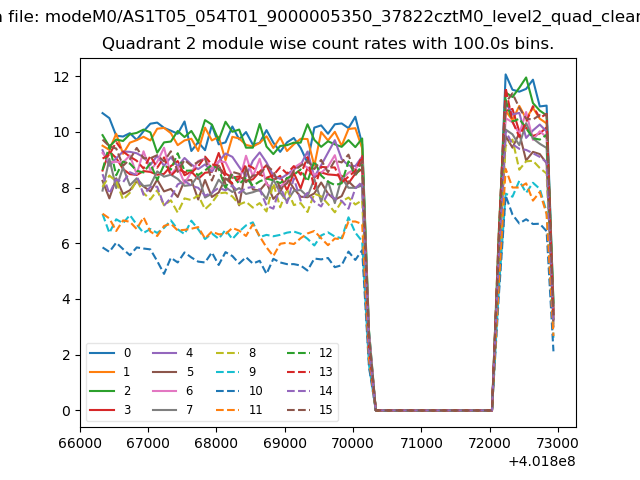 |
 |
| Module-wise count rates for Quadrant D Data is divided into 100 sec bins |
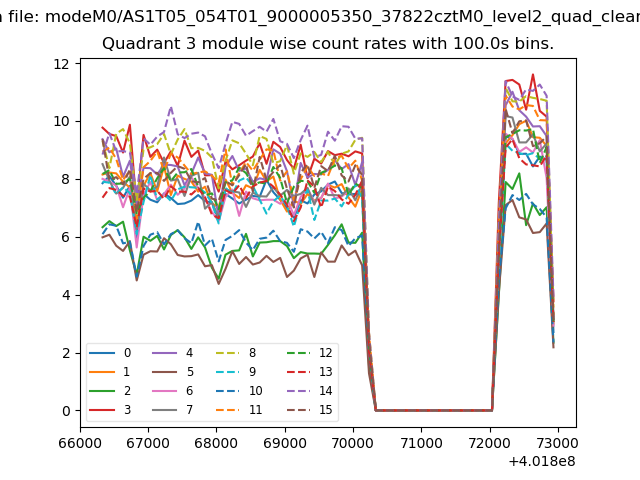 |
 |
| Parameter | Plot |
|---|---|
| CZT HV Monitor | 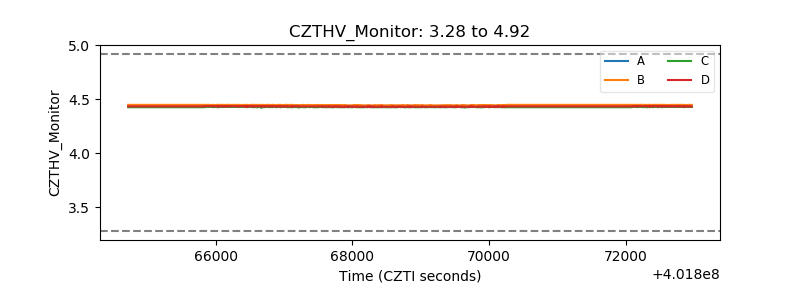 |
| D_VDD | 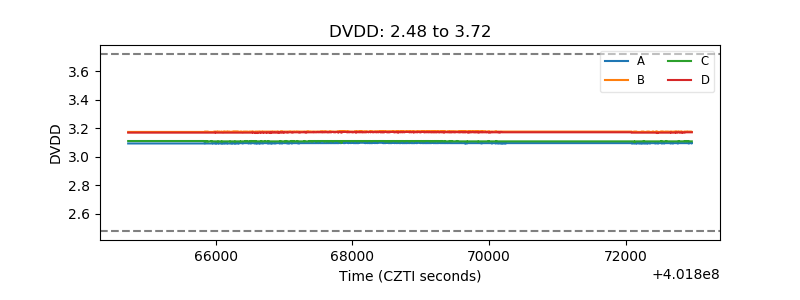 |
| Temperature 1 | 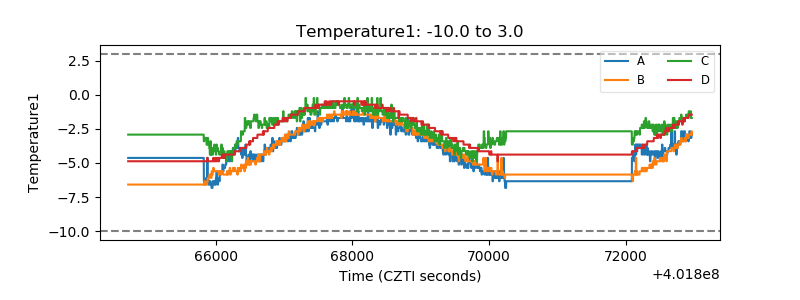 |
| Veto HV Monitor | 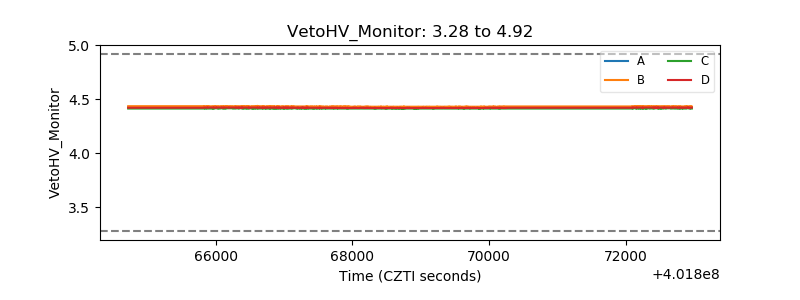 |
| Veto LLD | 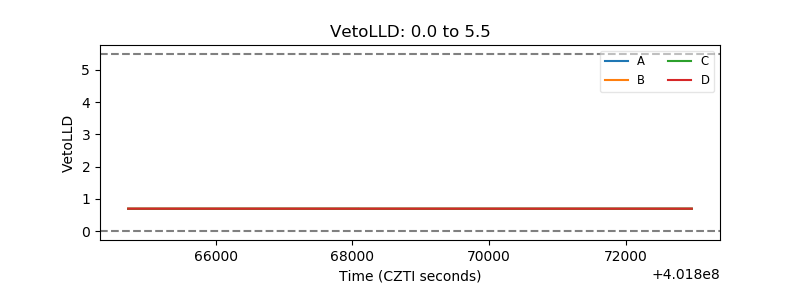 |
| Alpha Counter | 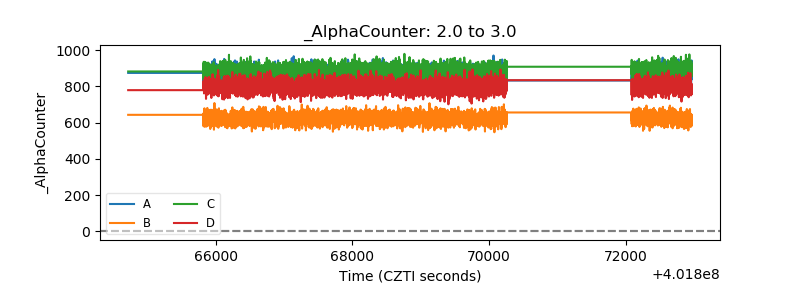 |
| _CPM_Rate | 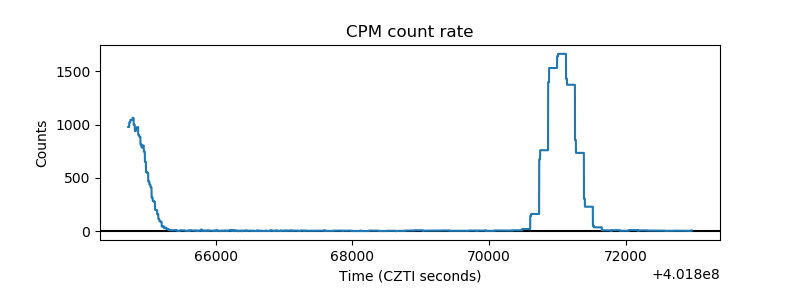 |
| CZT Counter | 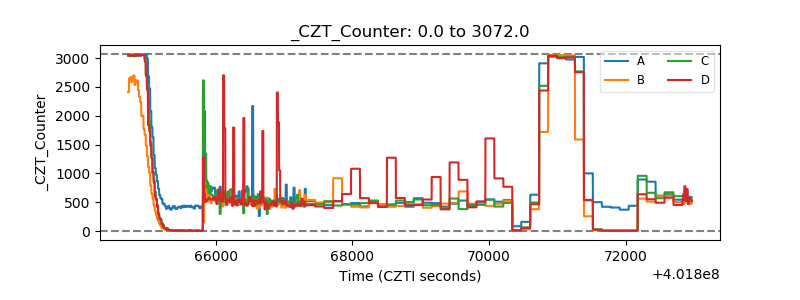 |
| +2.5 Volts monitor | 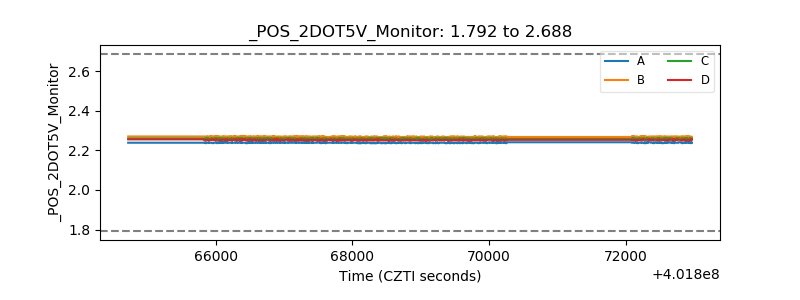 |
| +5 Volts monitor | 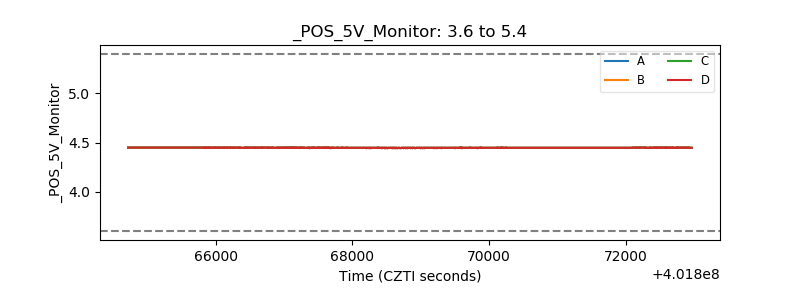 |
| _ROLL_ROT | 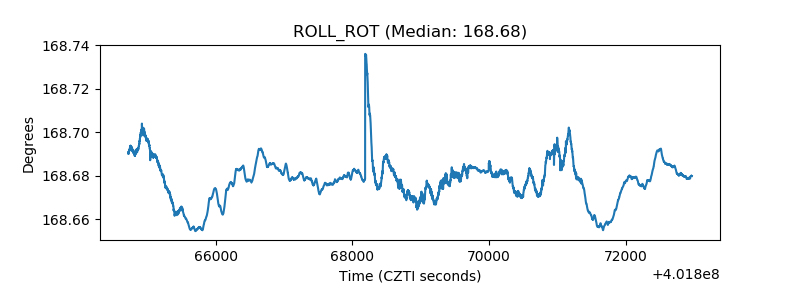 |
| _Roll_DEC | 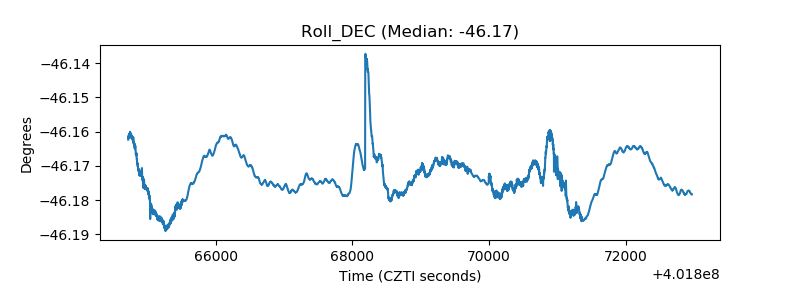 |
| _Roll_RA | 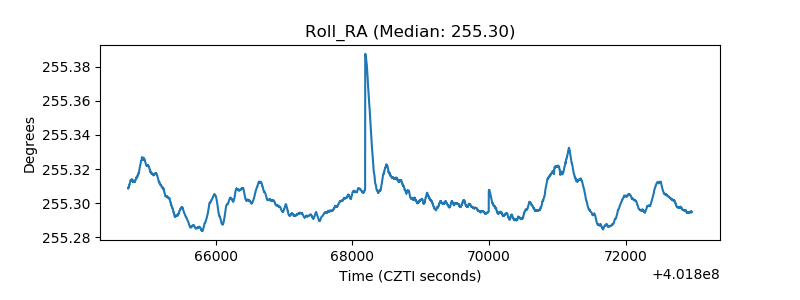 |
| Veto Counter | 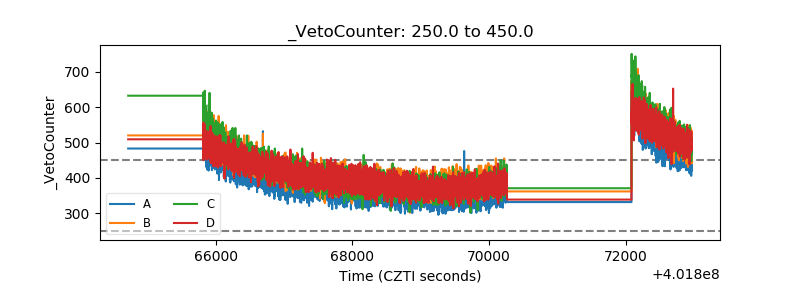 |