| Param | Original file | Final file |
|---|---|---|
| Filename | modeM0/AS1T05_054T01_9000005350_37823cztM0_level2.evt | modeM0/AS1T05_054T01_9000005350_37823cztM0_level2_quad_clean.evt |
| Size (bytes) | 420,750,720 | 102,407,040 |
| Size | 401.3 MB | 97.7 MB |
| Events in quadrant A | 3,005,247 | 694,618 |
| Events in quadrant B | 3,271,863 | 695,812 |
| Events in quadrant C | 2,835,926 | 696,697 |
| Events in quadrant D | 3,282,213 | 656,064 |
| Mode M9 | |||
|---|---|---|---|
| Quadrant | BADHDUFLAG | Total packets | Discarded packets |
| A | 0 | 23 | 0 |
| B | 0 | 23 | 0 |
| C | 0 | 23 | 0 |
| D | 0 | 24 | 0 |
| Mode SS | |||
|---|---|---|---|
| Quadrant | BADHDUFLAG | Total packets | Discarded packets |
| A | 0 | 104 | 0 |
| B | 0 | 104 | 0 |
| C | 0 | 104 | 0 |
| D | 0 | 104 | 0 |
| Mode M0 | |||
|---|---|---|---|
| Quadrant | BADHDUFLAG | Total packets | Discarded packets |
| A | 0 | 11982 | 3 |
| B | 0 | 12963 | 2 |
| C | 0 | 11572 | 2 |
| D | 0 | 13055 | 2 |
| Quadrant | Total seconds | Saturated seconds | Saturation percentage |
|---|---|---|---|
| A | 5116 | 39 | 0.762314% |
| B | 5116 | 120 | 2.345582% |
| C | 5116 | 32 | 0.625489% |
| D | 5116 | 100 | 1.954652% |
Noise dominated data is calculated using 1-second bins in cleaned event files. If a bin has >2000 counts, and if more than 50% of those come from <1% of pixels, then it is considered to be noise-dominated and hence unusable.
| Quadrant | # 1 sec bins | Bins with >0 counts | Bins with >2000 counts | High rate bins dominated by noise | Noise dominated (total time) | Noise dominated (detector-on time) | Marked lightcurve |
|---|---|---|---|---|---|---|---|
| A | 7059 | 5117 | 18 | 18 | 0.25% | 0.35% | 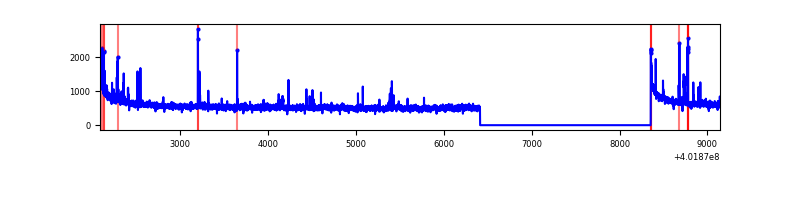 |
| B | 7059 | 5117 | 87 | 87 | 1.23% | 1.70% | 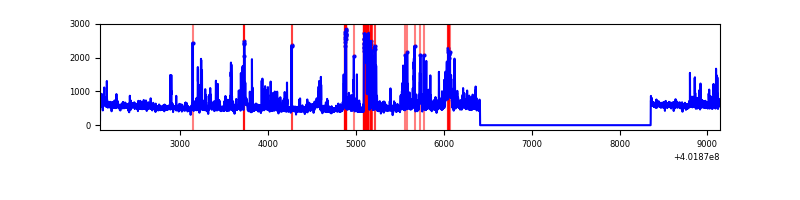 |
| C | 7059 | 5117 | 18 | 18 | 0.25% | 0.35% | 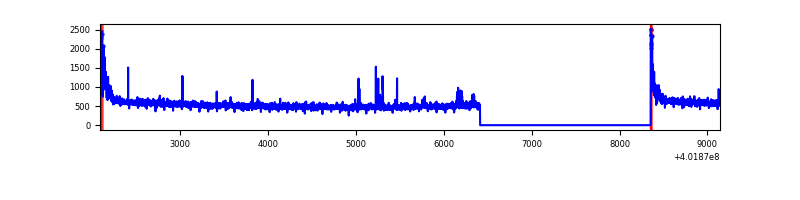 |
| D | 7059 | 5117 | 85 | 85 | 1.20% | 1.66% | 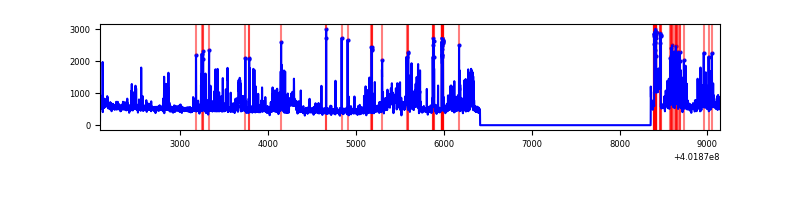 |
Top three noisy pixels from each quadrant. If the there are fewer than three noisy pixels in the level2.evt file, extra rows are filled as -1
| Pixel properties | Quadrant properties | ||||||
|---|---|---|---|---|---|---|---|
| Quadrant | DetID | PixID | Counts | Sigma | Mean | Median | Sigma |
| A | 10 | 83 | 350946 | 2743.84 | 646 | 636 | 127.7 |
| A | 9 | 143 | 81250 | 631.42 | 646 | 636 | 127.7 |
| A | 7 | 16 | 27795 | 212.73 | 646 | 636 | 127.7 |
| B | 5 | 172 | 315198 | 2683.15 | 629 | 616 | 117.2 |
| B | 0 | 229 | 151036 | 1282.97 | 629 | 616 | 117.2 |
| B | 0 | 213 | 93417 | 791.52 | 629 | 616 | 117.2 |
| C | 15 | 214 | 237848 | 1661.17 | 620 | 624 | 142.8 |
| C | 0 | 10 | 128894 | 898.21 | 620 | 624 | 142.8 |
| C | 14 | 254 | 29073 | 199.21 | 620 | 624 | 142.8 |
| D | 2 | 249 | 229666 | 1502.31 | 623 | 607 | 152.5 |
| D | 12 | 227 | 137821 | 899.93 | 623 | 607 | 152.5 |
| D | 13 | 249 | 126524 | 825.84 | 623 | 607 | 152.5 |
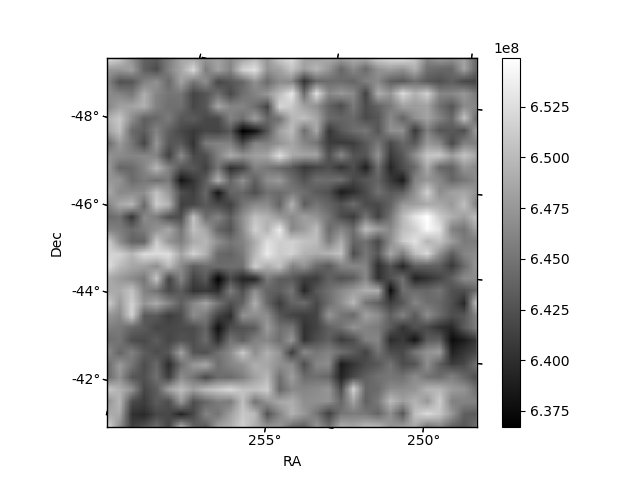
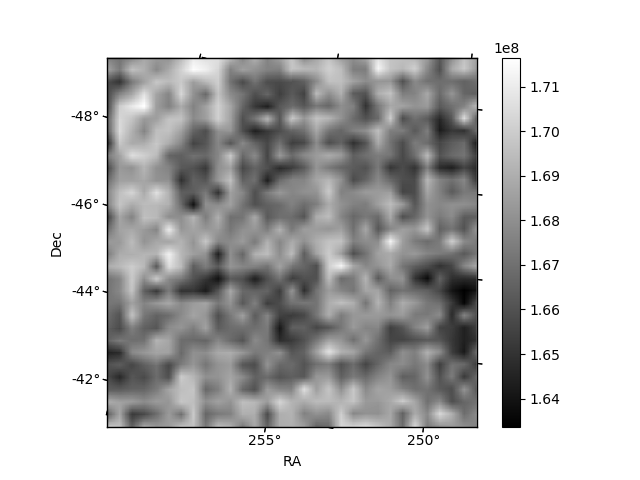
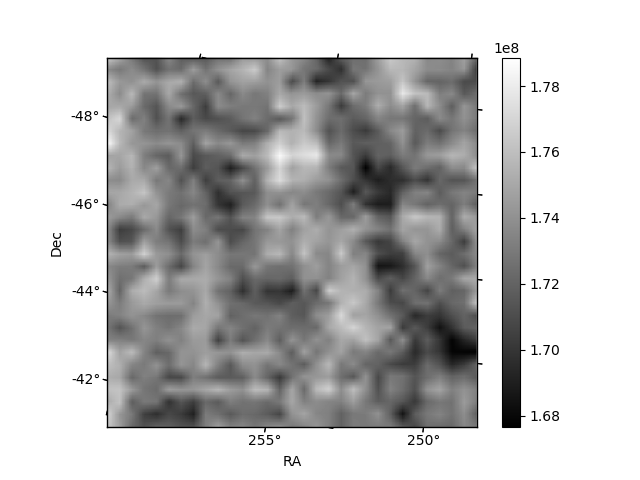
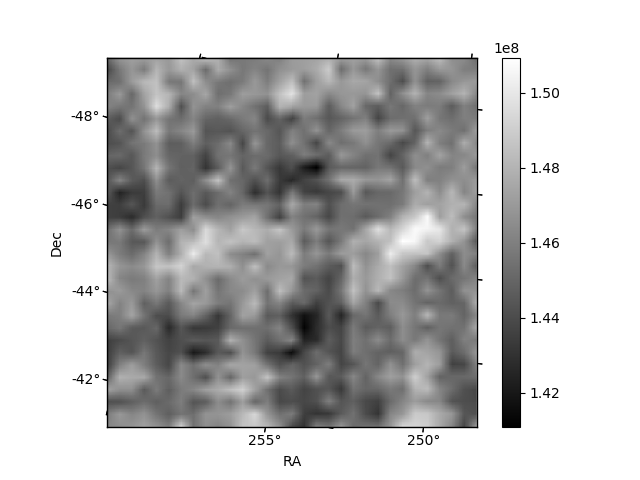
Histogram calculated using DETX and DETY for each event in the final _common_clean file
| Quadrant A | 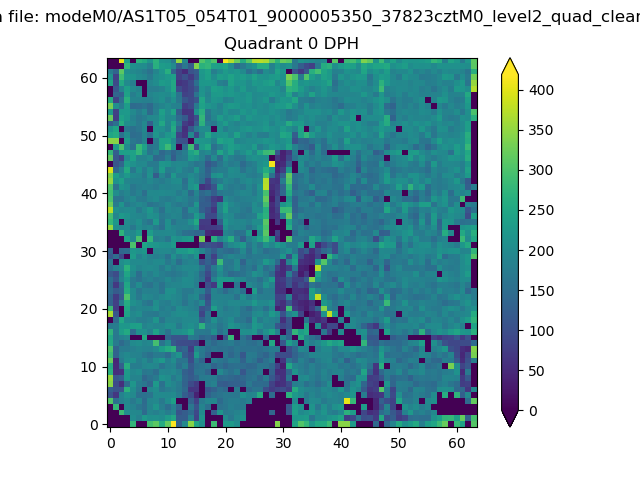 |
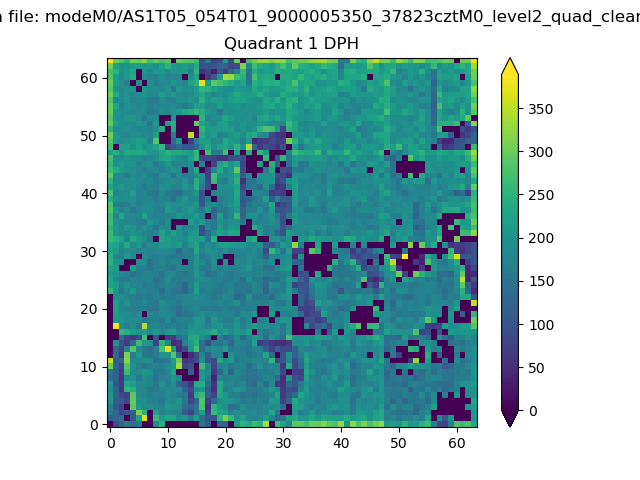 |
Quadrant B |
|---|---|---|---|
| Quadrant D | 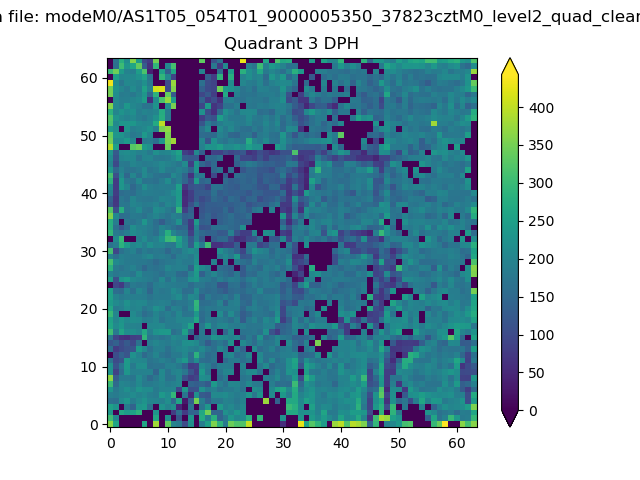 |
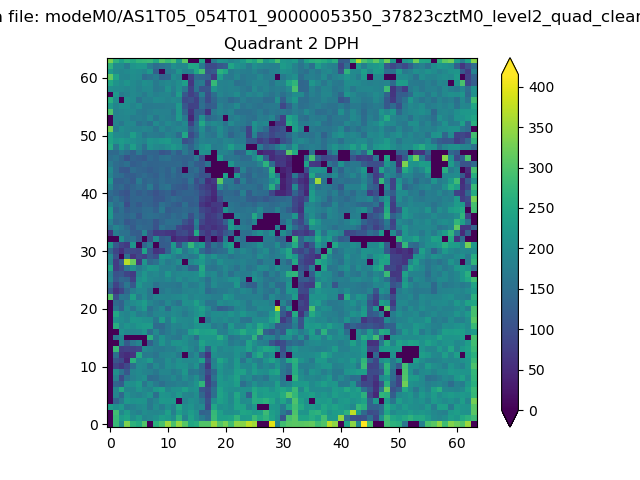 |
Quadrant C |
| Plot type | Count rate plots | Images |
|---|---|---|
| Comparison with Poisson distribution Blue bars denote a histogram of data divided into 1 sec bins. Red curve is a Poisson curve with rate = median count rate of data. |
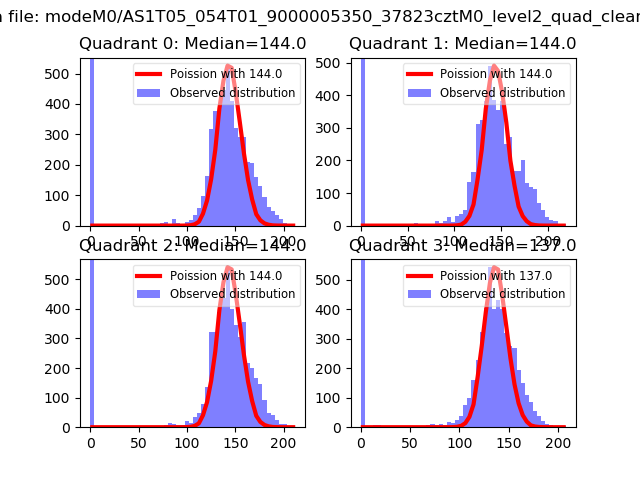 |
 |
| Quadrant-wise count rates Data is divided into 100 sec bins |
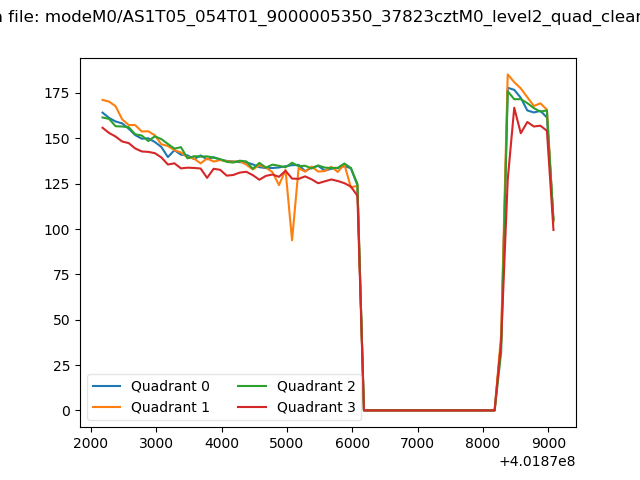 |
|
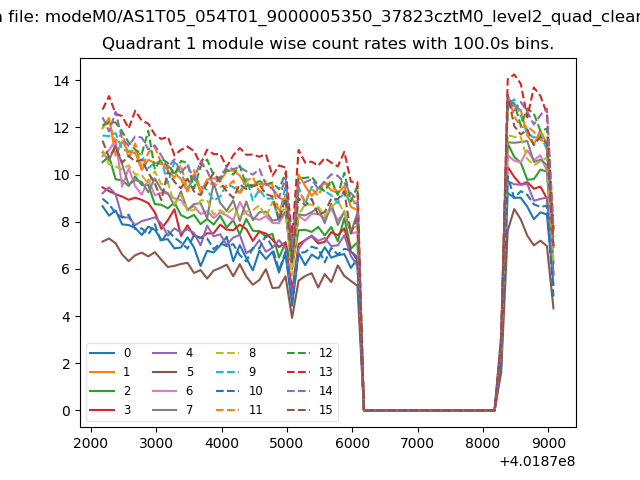
| Module-wise count rates for Quadrant A Data is divided into 100 sec bins |
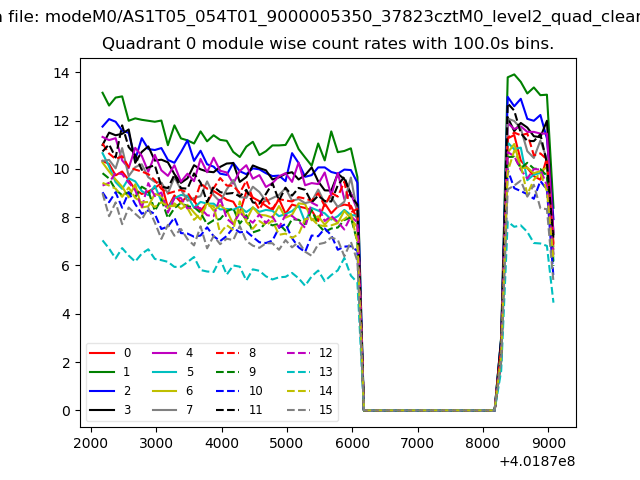 |
 |
| Module-wise count rates for Quadrant B Data is divided into 100 sec bins |
 |
 |
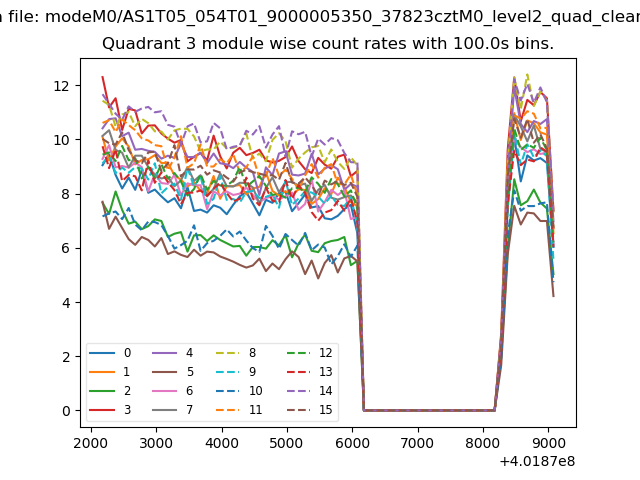
| Module-wise count rates for Quadrant C Data is divided into 100 sec bins |
 |
 |
| Module-wise count rates for Quadrant D Data is divided into 100 sec bins |
 |
 |
| Parameter | Plot |
|---|---|
| CZT HV Monitor | 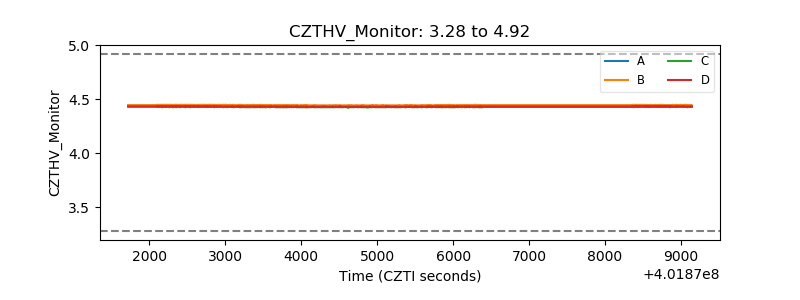 |
| D_VDD | 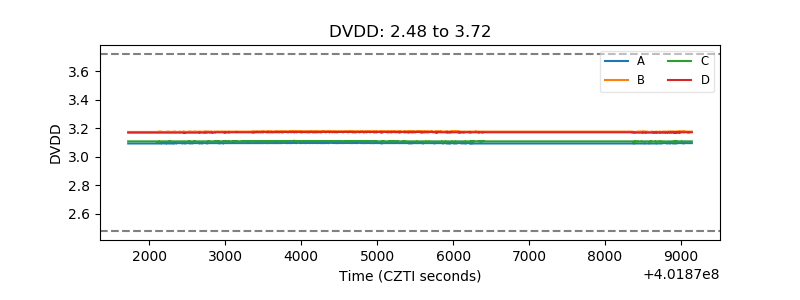 |
| Temperature 1 | 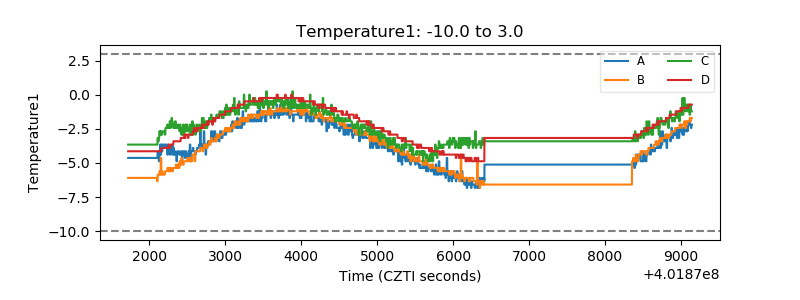 |
| Veto HV Monitor |  |
| Veto LLD | 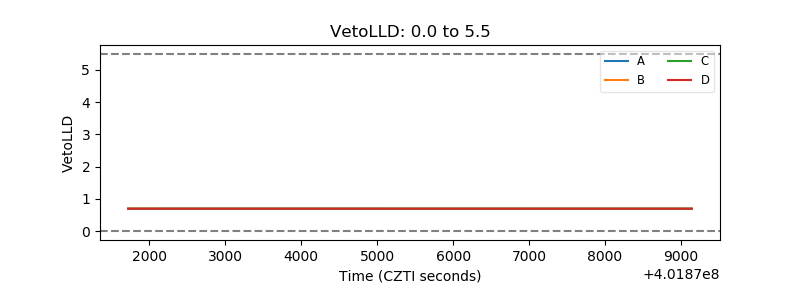 |
| Alpha Counter | 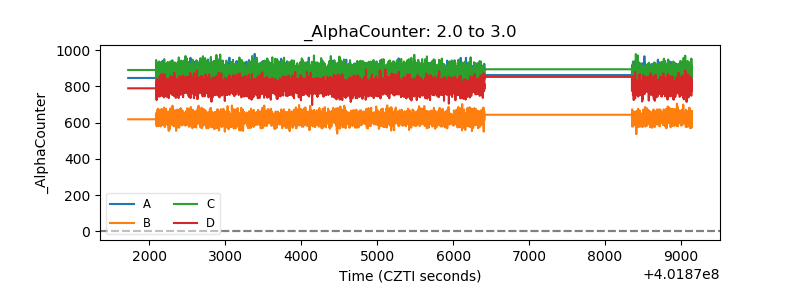 |
| _CPM_Rate | 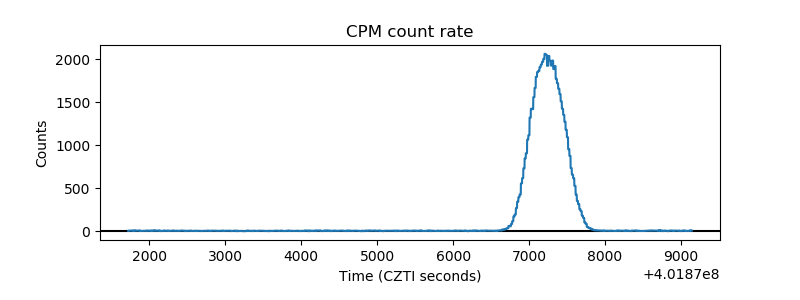 |
| CZT Counter | 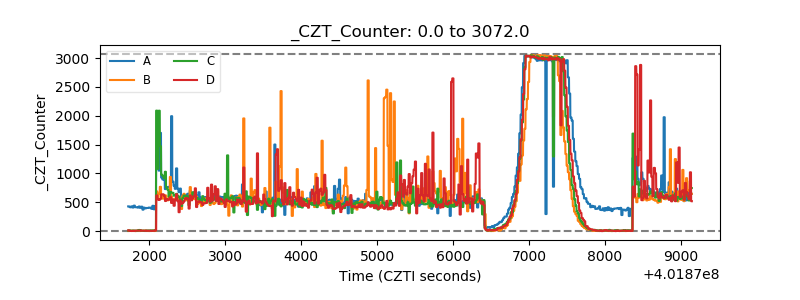 |
| +2.5 Volts monitor | 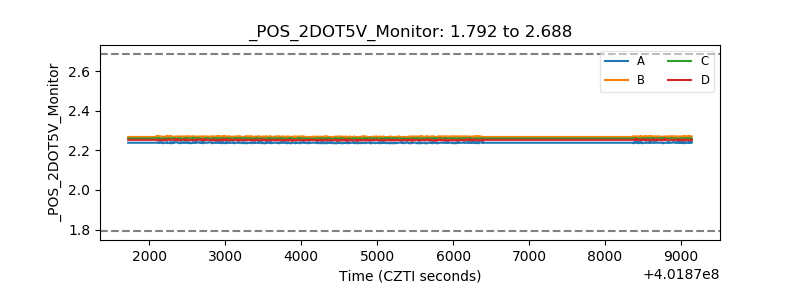 |
| +5 Volts monitor | 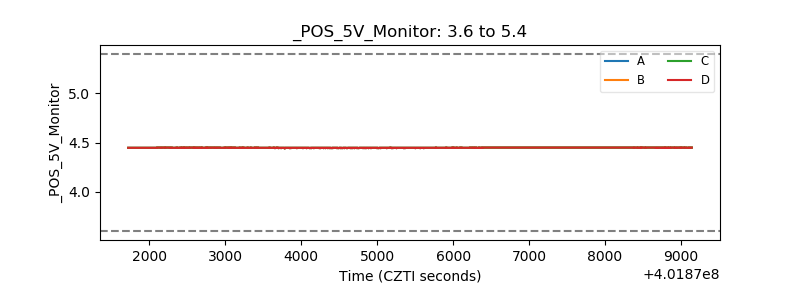 |
| _ROLL_ROT | 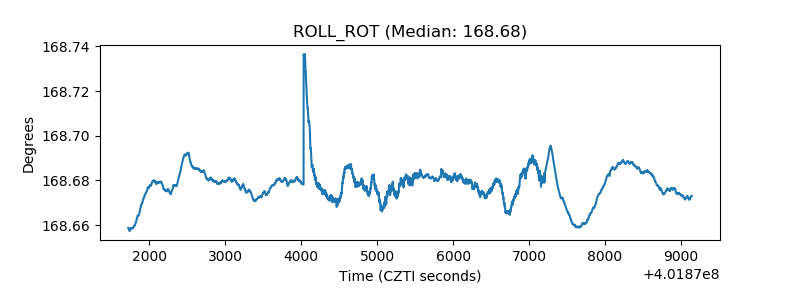 |
| _Roll_DEC | 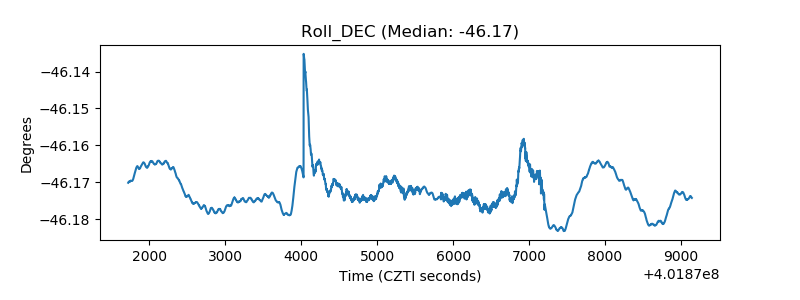 |
| _Roll_RA | 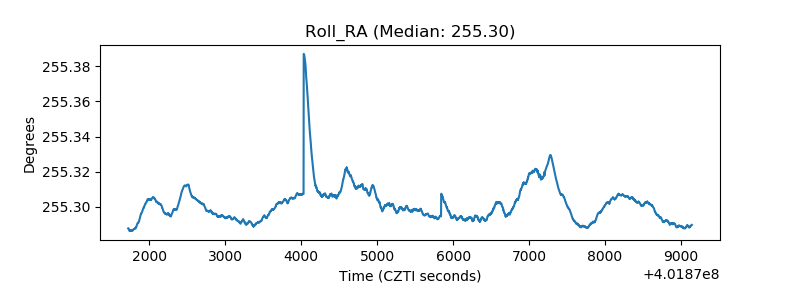 |
| Veto Counter | 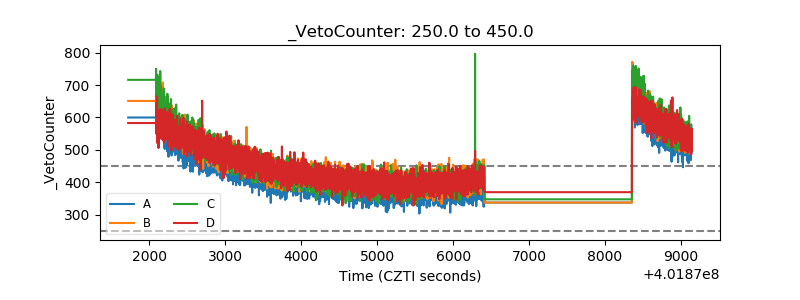 |