| Param | Original file | Final file |
|---|---|---|
| Filename | modeM0/AS1T05_054T01_9000005350_37824cztM0_level2.evt | modeM0/AS1T05_054T01_9000005350_37824cztM0_level2_quad_clean.evt |
| Size (bytes) | 476,899,200 | 105,877,440 |
| Size | 454.8 MB | 101.0 MB |
| Events in quadrant A | 3,193,231 | 726,177 |
| Events in quadrant B | 4,199,600 | 712,531 |
| Events in quadrant C | 2,976,393 | 720,260 |
| Events in quadrant D | 3,711,956 | 674,048 |
| Mode M9 | |||
|---|---|---|---|
| Quadrant | BADHDUFLAG | Total packets | Discarded packets |
| A | 0 | 25 | 0 |
| B | 0 | 25 | 0 |
| C | 0 | 25 | 0 |
| D | 0 | 26 | 0 |
| Mode SS | |||
|---|---|---|---|
| Quadrant | BADHDUFLAG | Total packets | Discarded packets |
| A | 0 | 108 | 0 |
| B | 0 | 108 | 0 |
| C | 0 | 108 | 0 |
| D | 0 | 108 | 0 |
| Mode M0 | |||
|---|---|---|---|
| Quadrant | BADHDUFLAG | Total packets | Discarded packets |
| A | 0 | 12744 | 3 |
| B | 0 | 16113 | 2 |
| C | 0 | 12066 | 2 |
| D | 0 | 14545 | 2 |
| Quadrant | Total seconds | Saturated seconds | Saturation percentage |
|---|---|---|---|
| A | 5339 | 44 | 0.824124% |
| B | 5339 | 239 | 4.476494% |
| C | 5339 | 49 | 0.917775% |
| D | 5339 | 202 | 3.783480% |
Noise dominated data is calculated using 1-second bins in cleaned event files. If a bin has >2000 counts, and if more than 50% of those come from <1% of pixels, then it is considered to be noise-dominated and hence unusable.
| Quadrant | # 1 sec bins | Bins with >0 counts | Bins with >2000 counts | High rate bins dominated by noise | Noise dominated (total time) | Noise dominated (detector-on time) | Marked lightcurve |
|---|---|---|---|---|---|---|---|
| A | 7372 | 5340 | 38 | 38 | 0.52% | 0.71% | 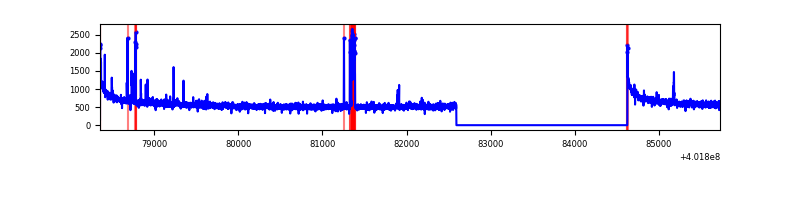 |
| B | 7372 | 5340 | 214 | 214 | 2.90% | 4.01% | 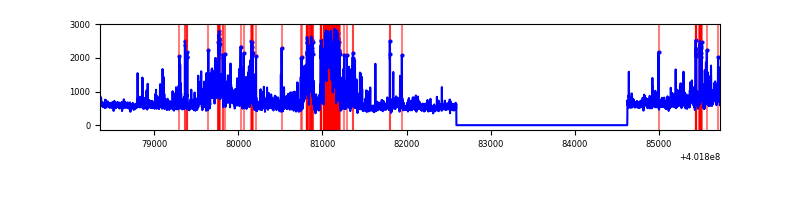 |
| C | 7372 | 5340 | 41 | 41 | 0.56% | 0.77% | 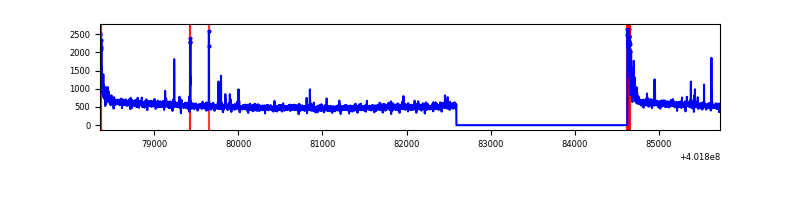 |
| D | 7372 | 5340 | 194 | 194 | 2.63% | 3.63% | 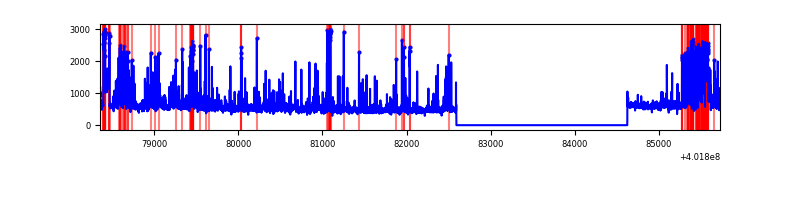 |
Top three noisy pixels from each quadrant. If the there are fewer than three noisy pixels in the level2.evt file, extra rows are filled as -1
| Pixel properties | Quadrant properties | ||||||
|---|---|---|---|---|---|---|---|
| Quadrant | DetID | PixID | Counts | Sigma | Mean | Median | Sigma |
| A | 10 | 83 | 355724 | 2591.21 | 686 | 677 | 137.0 |
| A | 15 | 254 | 80085 | 579.54 | 686 | 677 | 137.0 |
| A | 9 | 143 | 55176 | 397.75 | 686 | 677 | 137.0 |
| B | 5 | 172 | 405364 | 3263.49 | 662 | 650 | 124.0 |
| B | 10 | 246 | 325538 | 2619.8 | 662 | 650 | 124.0 |
| B | 0 | 189 | 278551 | 2240.91 | 662 | 650 | 124.0 |
| C | 15 | 214 | 232075 | 1549.78 | 651 | 659 | 149.3 |
| C | 0 | 10 | 149162 | 994.52 | 651 | 659 | 149.3 |
| C | 15 | 159 | 32848 | 215.57 | 651 | 659 | 149.3 |
| D | 12 | 233 | 338449 | 2141.85 | 655 | 639 | 157.7 |
| D | 12 | 227 | 232436 | 1469.69 | 655 | 639 | 157.7 |
| D | 10 | 199 | 142925 | 902.15 | 655 | 639 | 157.7 |
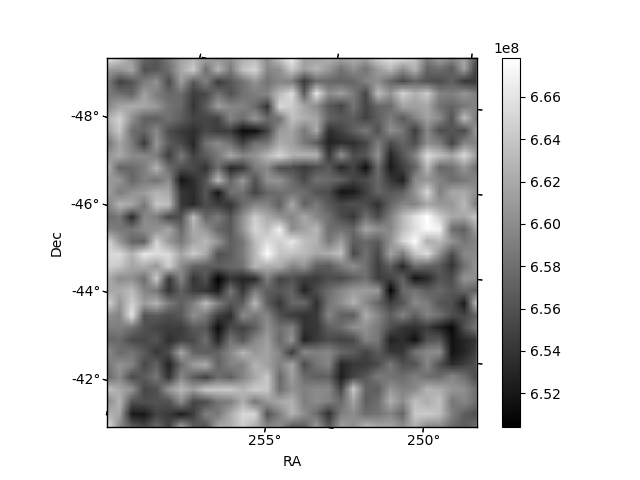
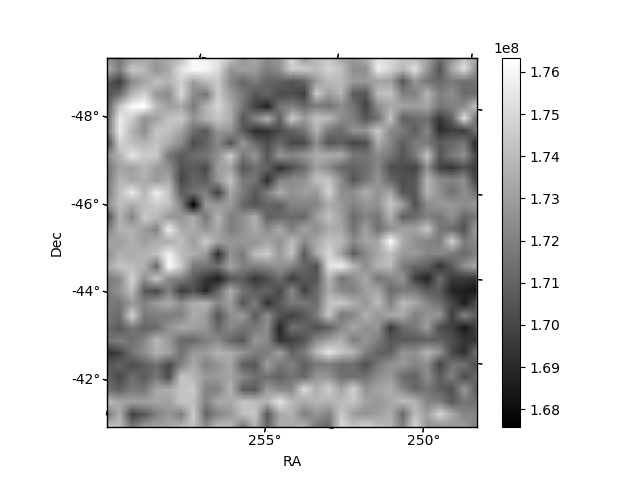
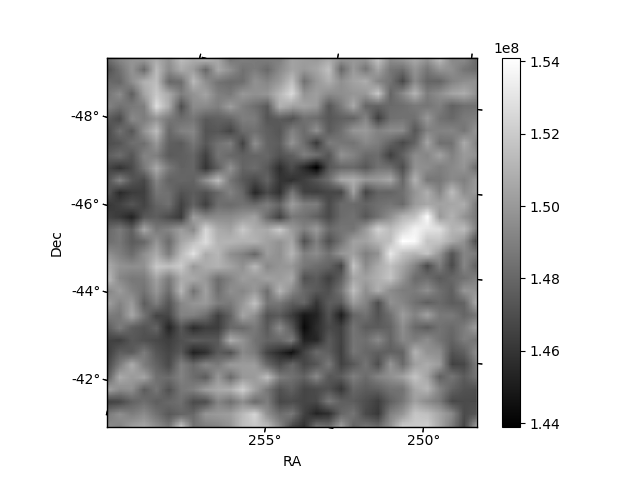
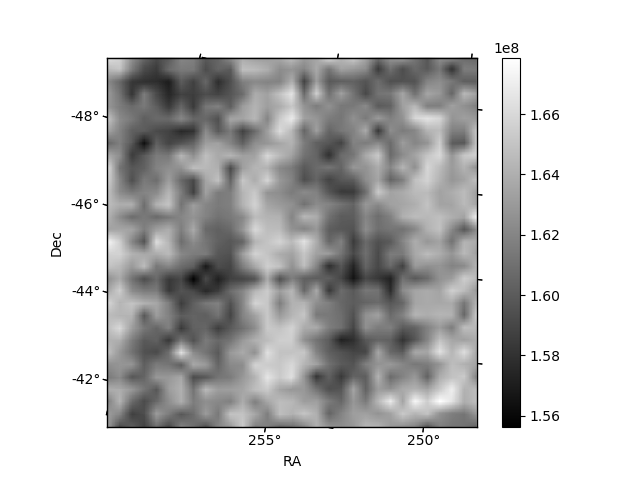
Histogram calculated using DETX and DETY for each event in the final _common_clean file
| Quadrant A | 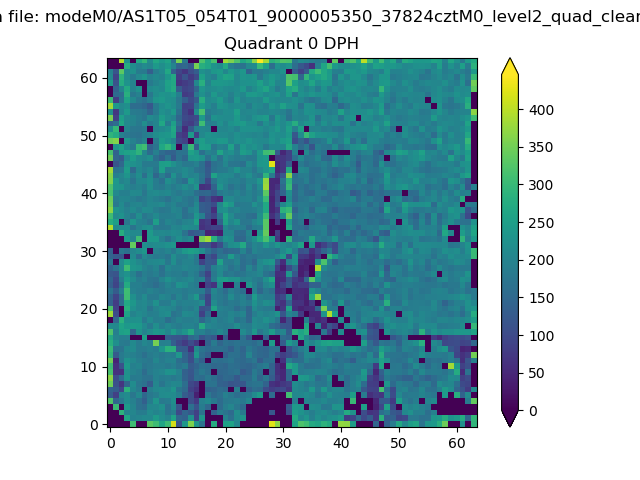 |
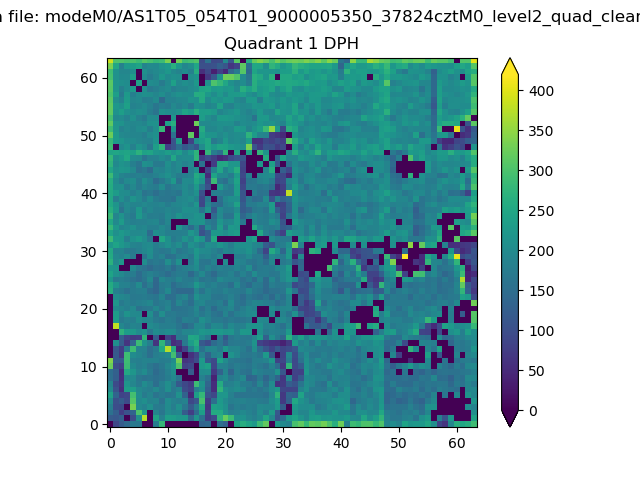 |
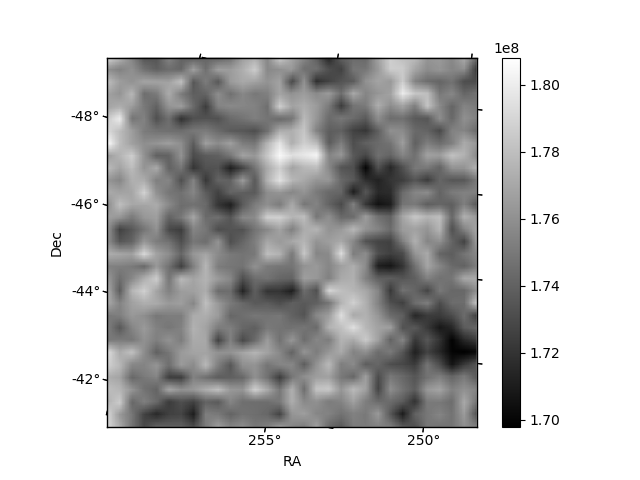
Quadrant B |
|---|---|---|---|
| Quadrant D | 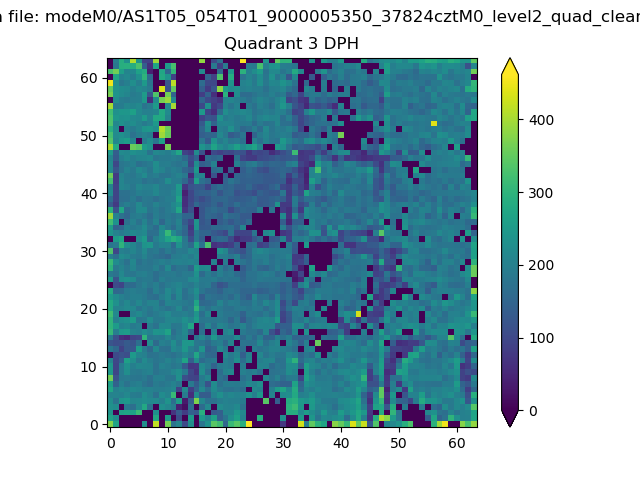 |
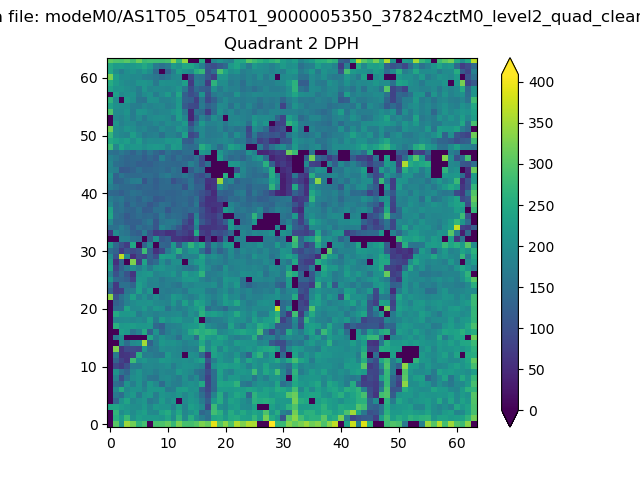 |
Quadrant C |
| Plot type | Count rate plots | Images |
|---|---|---|
| Comparison with Poisson distribution Blue bars denote a histogram of data divided into 1 sec bins. Red curve is a Poisson curve with rate = median count rate of data. |
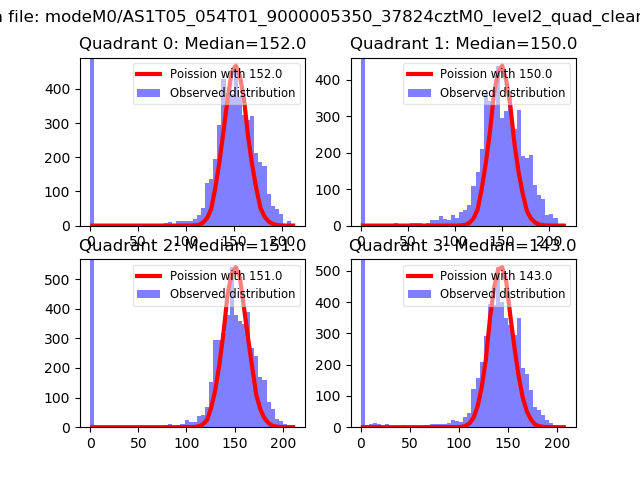 |
 |
| Quadrant-wise count rates Data is divided into 100 sec bins |
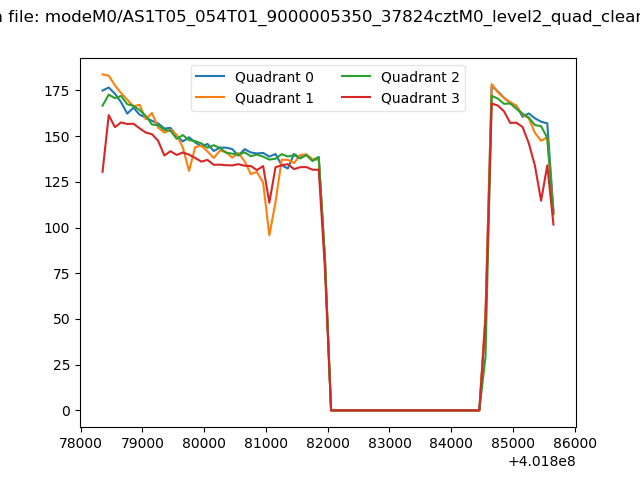 |
|
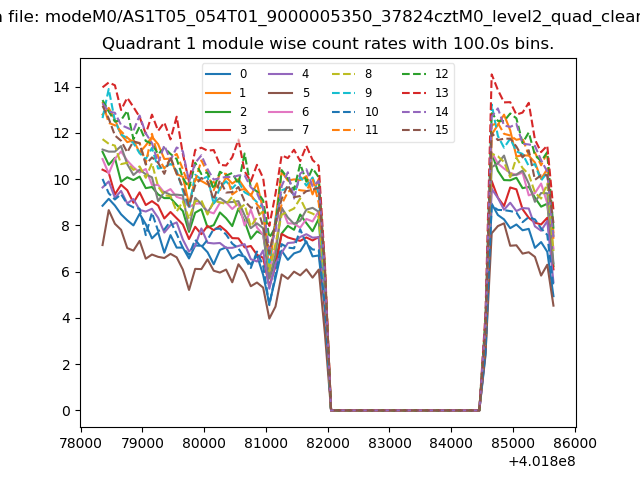
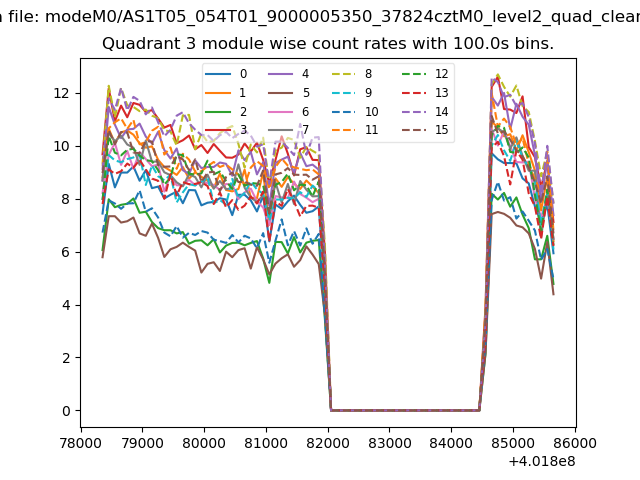
| Module-wise count rates for Quadrant A Data is divided into 100 sec bins |
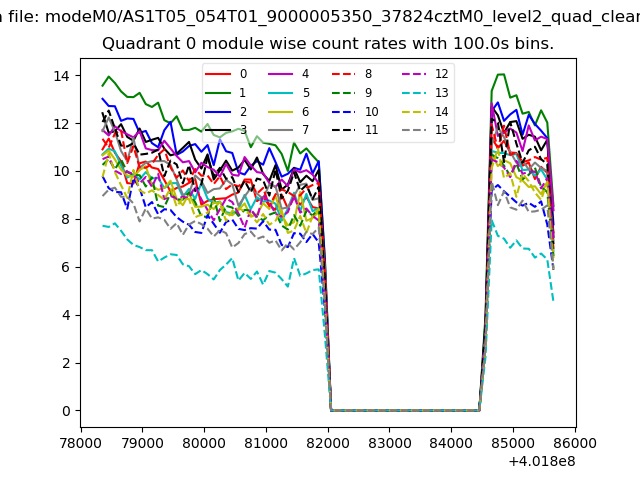 |
 |
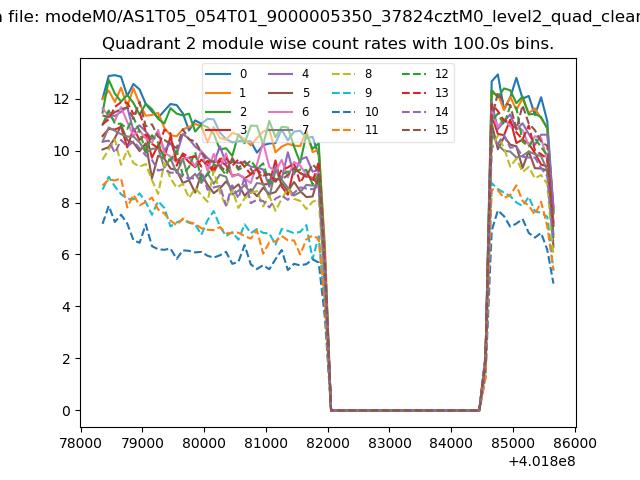
| Module-wise count rates for Quadrant B Data is divided into 100 sec bins |
 |
 |
| Module-wise count rates for Quadrant C Data is divided into 100 sec bins |
 |
 |
| Module-wise count rates for Quadrant D Data is divided into 100 sec bins |
 |
 |
| Parameter | Plot |
|---|---|
| CZT HV Monitor | 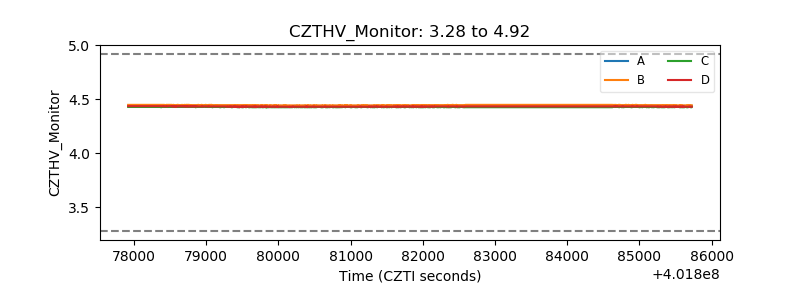 |
| D_VDD | 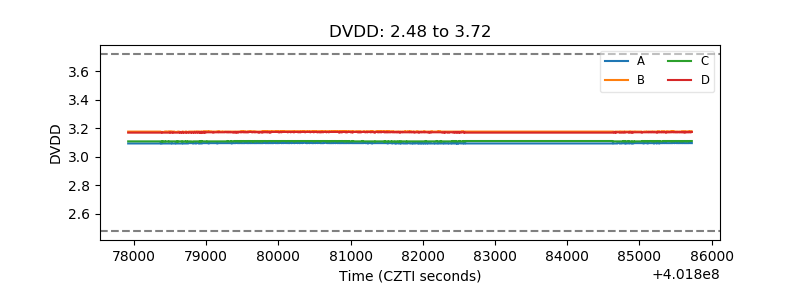 |
| Temperature 1 | 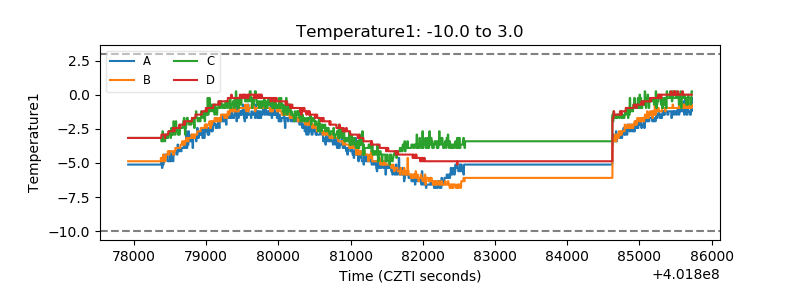 |
| Veto HV Monitor | 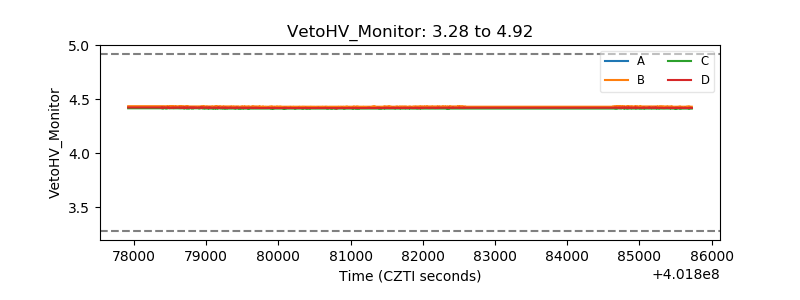 |
| Veto LLD | 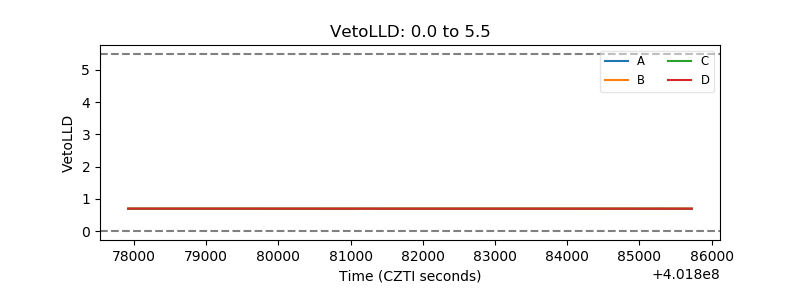 |
| Alpha Counter | 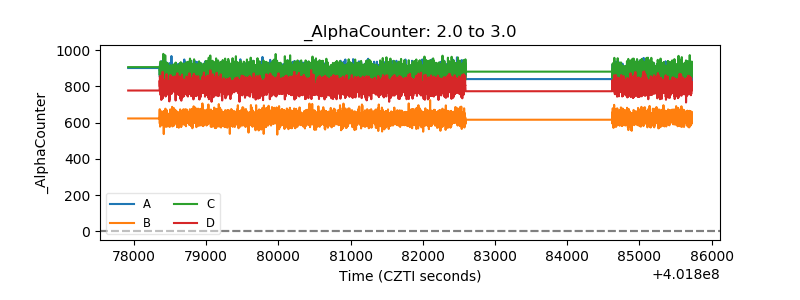 |
| _CPM_Rate | 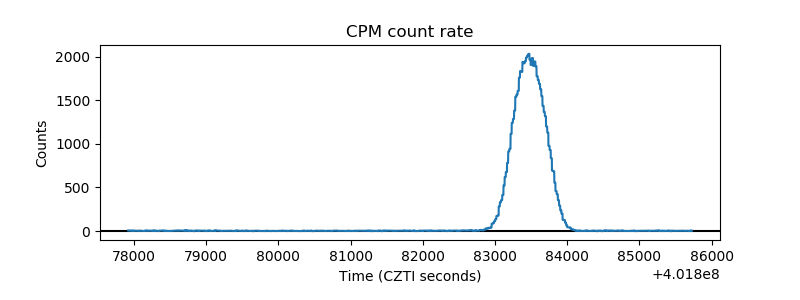 |
| CZT Counter | 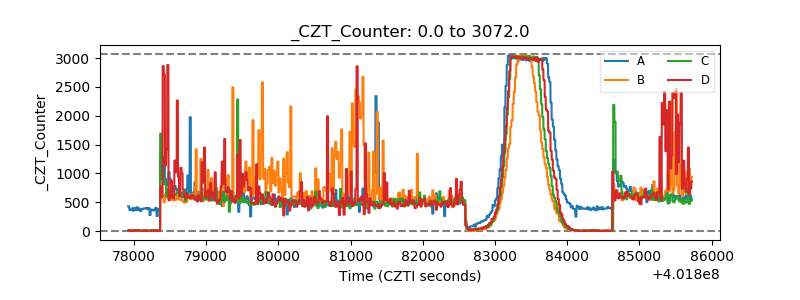 |
| +2.5 Volts monitor |  |
| +5 Volts monitor | 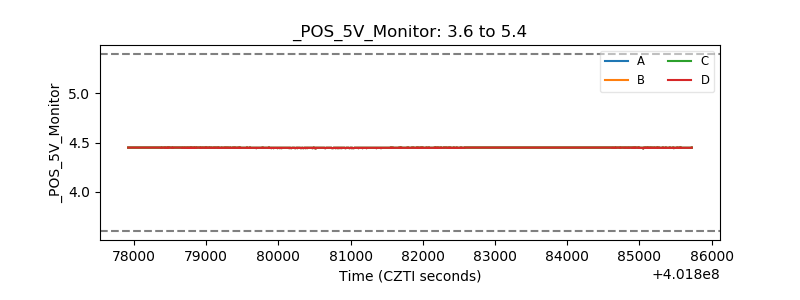 |
| _ROLL_ROT | 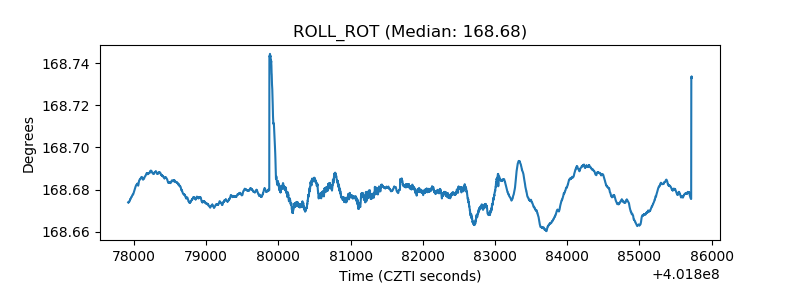 |
| _Roll_DEC | 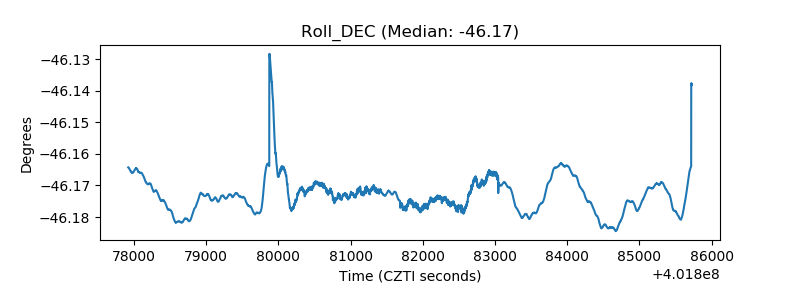 |
| _Roll_RA | 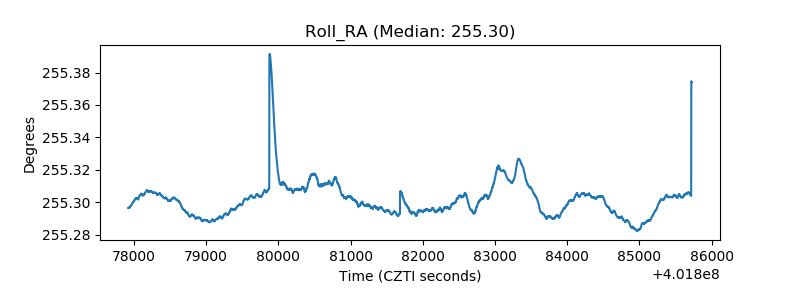 |
| Veto Counter | 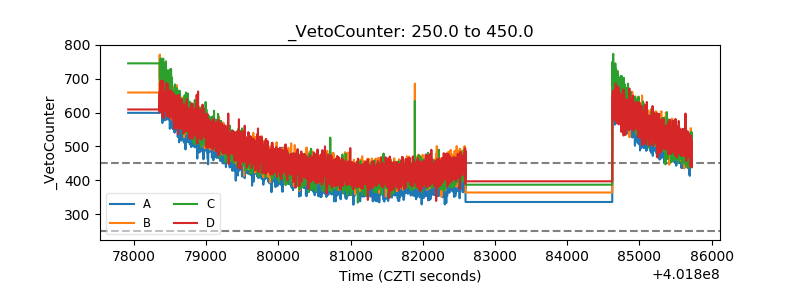 |