| Param | Original file | Final file |
|---|---|---|
| Filename | modeM0/AS1T05_054T01_9000005350_37825cztM0_level2.evt | modeM0/AS1T05_054T01_9000005350_37825cztM0_level2_quad_clean.evt |
| Size (bytes) | 427,904,640 | 91,359,360 |
| Size | 408.1 MB | 87.1 MB |
| Events in quadrant A | 2,830,600 | 622,360 |
| Events in quadrant B | 3,416,227 | 610,654 |
| Events in quadrant C | 2,701,154 | 608,418 |
| Events in quadrant D | 3,667,959 | 570,832 |
| Mode M9 | |||
|---|---|---|---|
| Quadrant | BADHDUFLAG | Total packets | Discarded packets |
| A | 0 | 21 | 0 |
| B | 0 | 21 | 0 |
| C | 0 | 21 | 0 |
| D | 0 | 21 | 0 |
| Mode SS | |||
|---|---|---|---|
| Quadrant | BADHDUFLAG | Total packets | Discarded packets |
| A | 0 | 104 | 0 |
| B | 0 | 104 | 0 |
| C | 0 | 104 | 0 |
| D | 0 | 104 | 0 |
| Mode M0 | |||
|---|---|---|---|
| Quadrant | BADHDUFLAG | Total packets | Discarded packets |
| A | 0 | 11406 | 2 |
| B | 0 | 13495 | 1 |
| C | 0 | 10960 | 1 |
| D | 0 | 14265 | 1 |
| Quadrant | Total seconds | Saturated seconds | Saturation percentage |
|---|---|---|---|
| A | 5053 | 12 | 0.237483% |
| B | 5053 | 109 | 2.157134% |
| C | 5053 | 33 | 0.653077% |
| D | 5053 | 267 | 5.283990% |
Noise dominated data is calculated using 1-second bins in cleaned event files. If a bin has >2000 counts, and if more than 50% of those come from <1% of pixels, then it is considered to be noise-dominated and hence unusable.
| Quadrant | # 1 sec bins | Bins with >0 counts | Bins with >2000 counts | High rate bins dominated by noise | Noise dominated (total time) | Noise dominated (detector-on time) | Marked lightcurve |
|---|---|---|---|---|---|---|---|
| A | 7176 | 5054 | 3 | 3 | 0.04% | 0.06% | 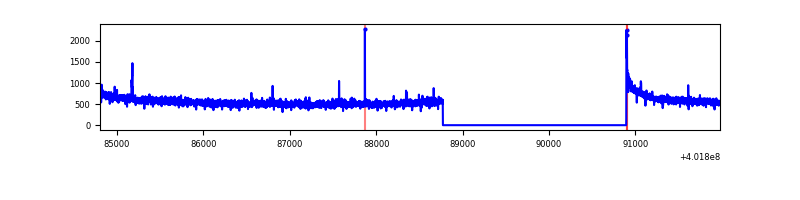 |
| B | 7176 | 5054 | 77 | 77 | 1.07% | 1.52% | 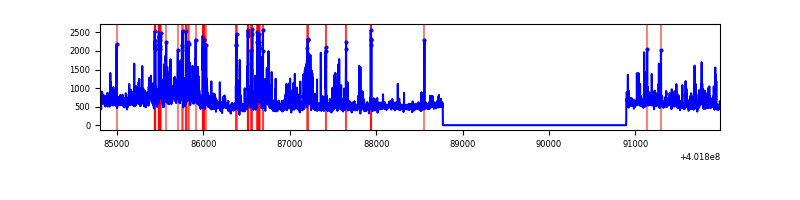 |
| C | 7175 | 5053 | 31 | 31 | 0.43% | 0.61% | 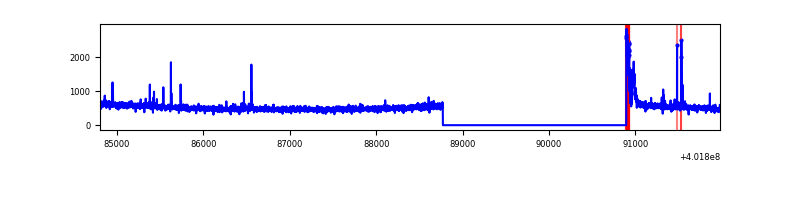 |
| D | 7175 | 5053 | 260 | 260 | 3.62% | 5.15% | 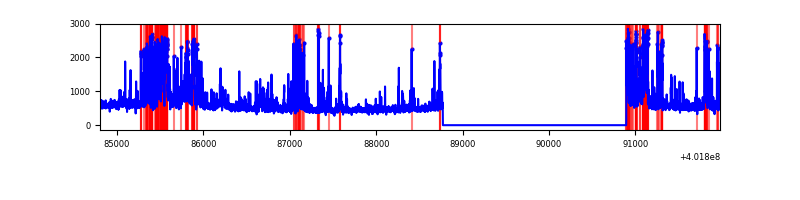 |
Top three noisy pixels from each quadrant. If the there are fewer than three noisy pixels in the level2.evt file, extra rows are filled as -1
| Pixel properties | Quadrant properties | ||||||
|---|---|---|---|---|---|---|---|
| Quadrant | DetID | PixID | Counts | Sigma | Mean | Median | Sigma |
| A | 10 | 83 | 314617 | 2473.84 | 633 | 624 | 126.9 |
| A | 13 | 6 | 28659 | 220.88 | 633 | 624 | 126.9 |
| A | 12 | 189 | 16238 | 123.02 | 633 | 624 | 126.9 |
| B | 5 | 172 | 328185 | 2828.27 | 615 | 602 | 115.8 |
| B | 4 | 171 | 240402 | 2070.37 | 615 | 602 | 115.8 |
| B | 0 | 229 | 146446 | 1259.18 | 615 | 602 | 115.8 |
| C | 15 | 214 | 216071 | 1584.46 | 596 | 602 | 136.0 |
| C | 0 | 10 | 110653 | 809.27 | 596 | 602 | 136.0 |
| C | 14 | 254 | 28853 | 207.75 | 596 | 602 | 136.0 |
| D | 12 | 233 | 373648 | 2573.94 | 598 | 584 | 144.9 |
| D | 12 | 218 | 250816 | 1726.46 | 598 | 584 | 144.9 |
| D | 2 | 249 | 159724 | 1097.98 | 598 | 584 | 144.9 |
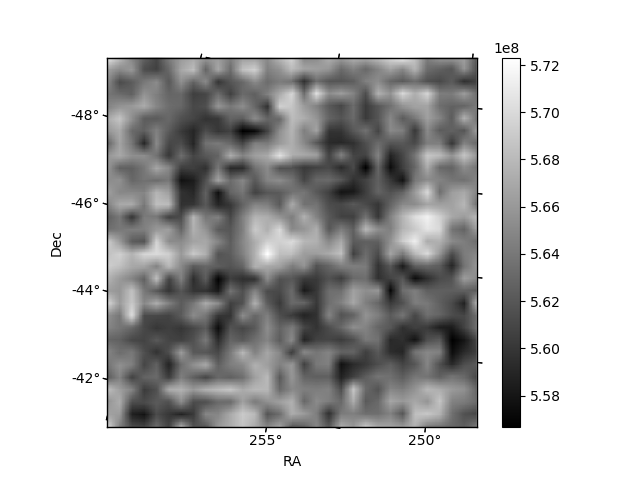
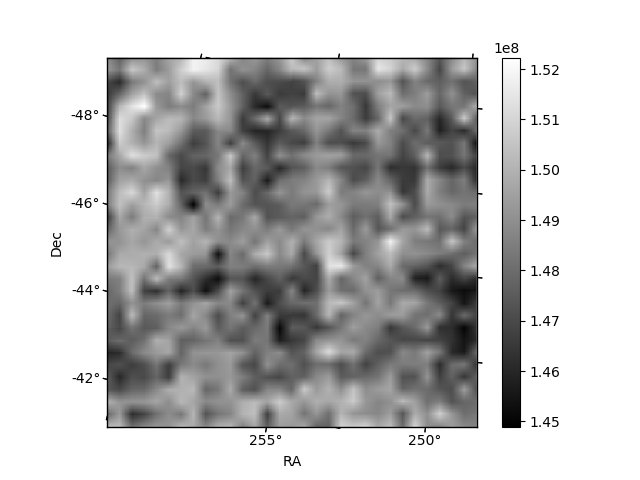
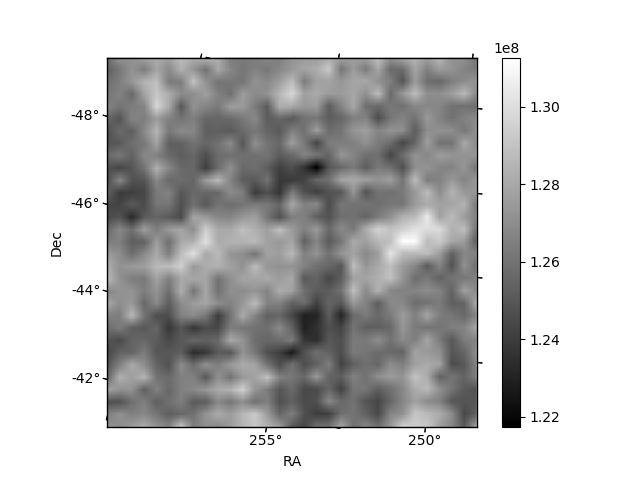
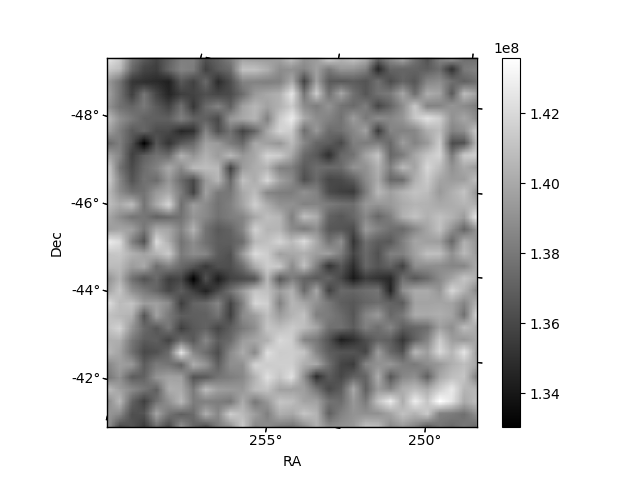
Histogram calculated using DETX and DETY for each event in the final _common_clean file
| Quadrant A | 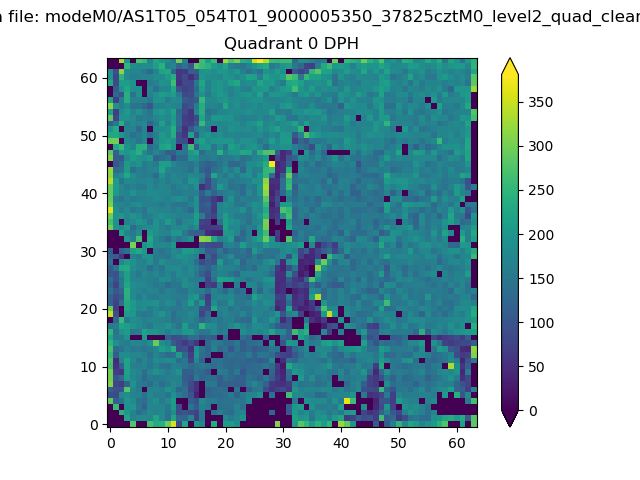 |
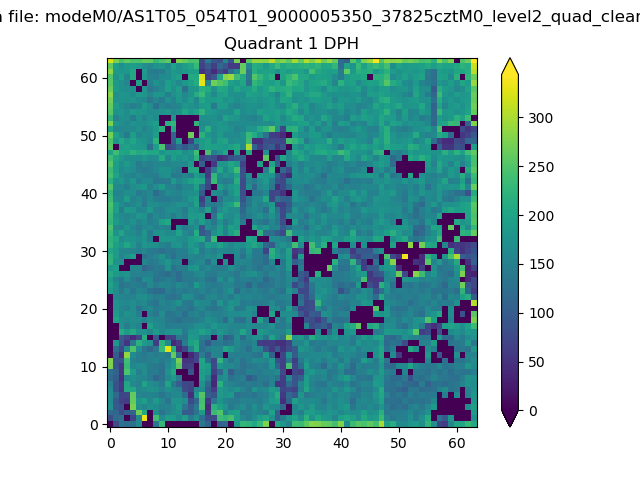 |
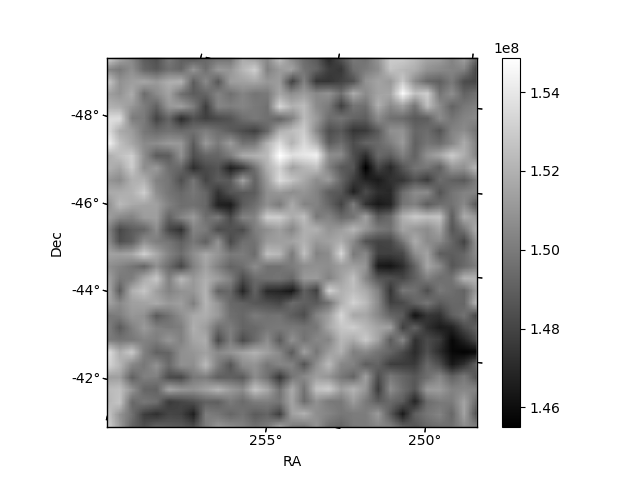
Quadrant B |
|---|---|---|---|
| Quadrant D | 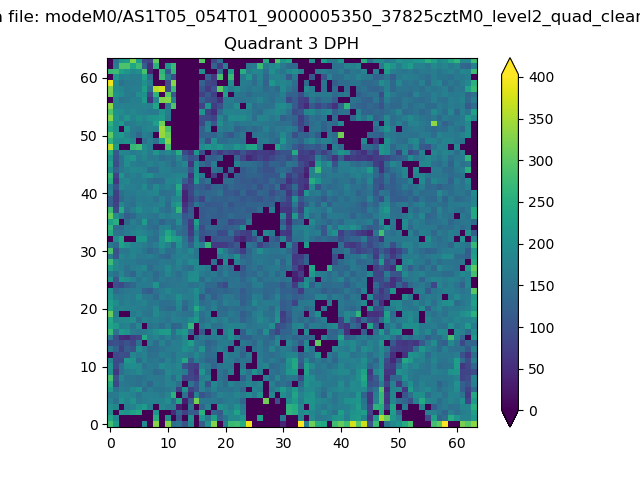 |
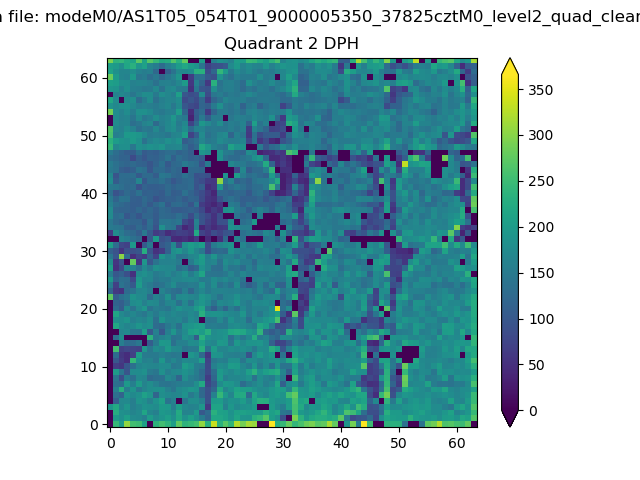 |
Quadrant C |
| Plot type | Count rate plots | Images |
|---|---|---|
| Comparison with Poisson distribution Blue bars denote a histogram of data divided into 1 sec bins. Red curve is a Poisson curve with rate = median count rate of data. |
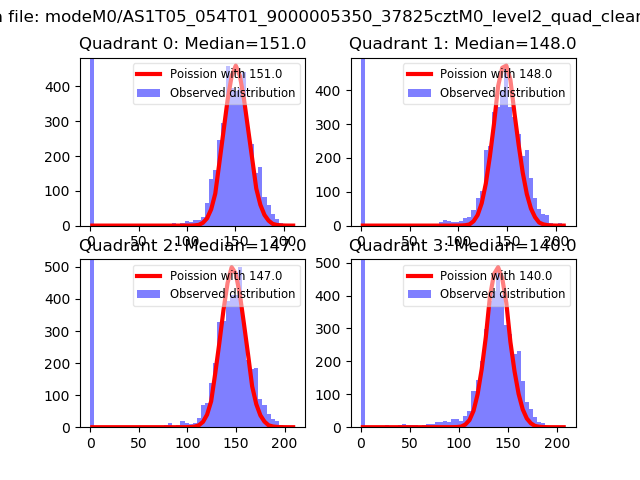 |
 |
| Quadrant-wise count rates Data is divided into 100 sec bins |
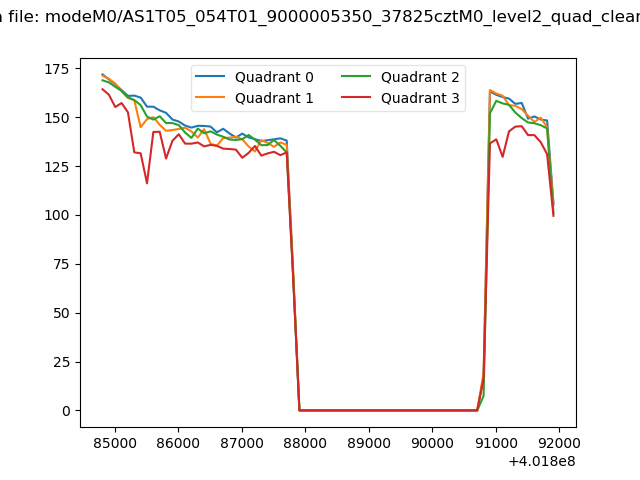 |
|
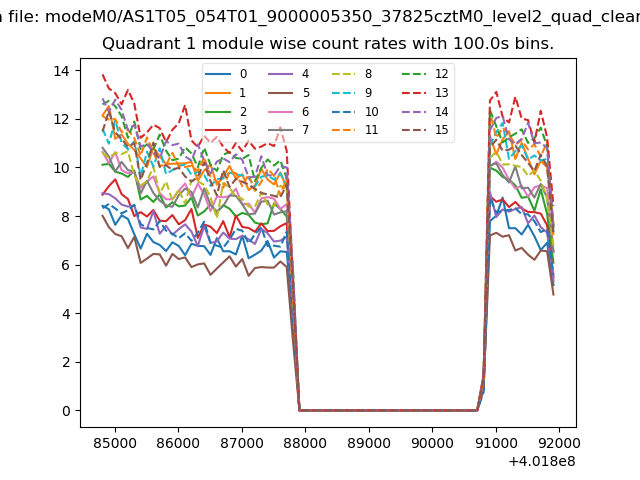
| Module-wise count rates for Quadrant A Data is divided into 100 sec bins |
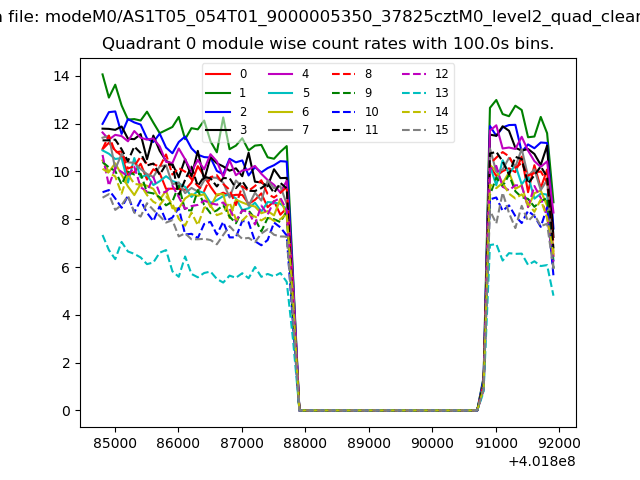 |
 |
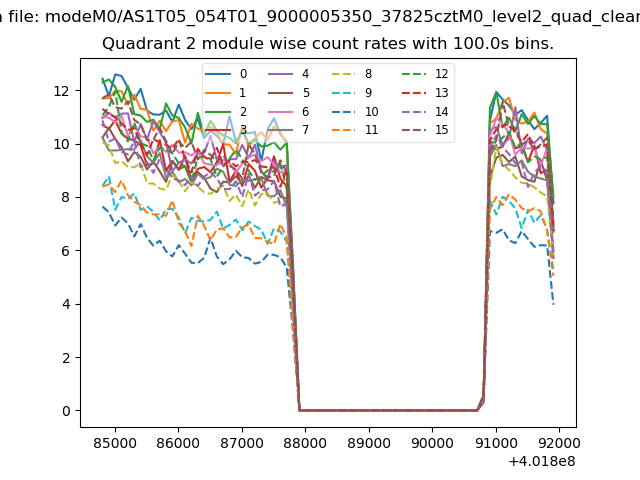
| Module-wise count rates for Quadrant B Data is divided into 100 sec bins |
 |
 |
| Module-wise count rates for Quadrant C Data is divided into 100 sec bins |
 |
 |
| Module-wise count rates for Quadrant D Data is divided into 100 sec bins |
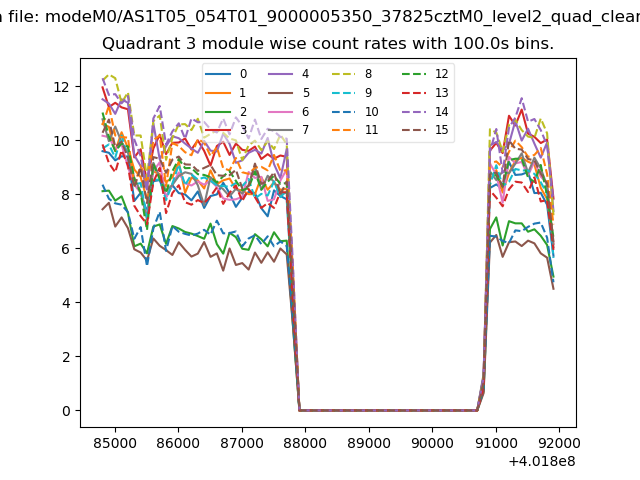 |
 |
| Parameter | Plot |
|---|---|
| CZT HV Monitor | 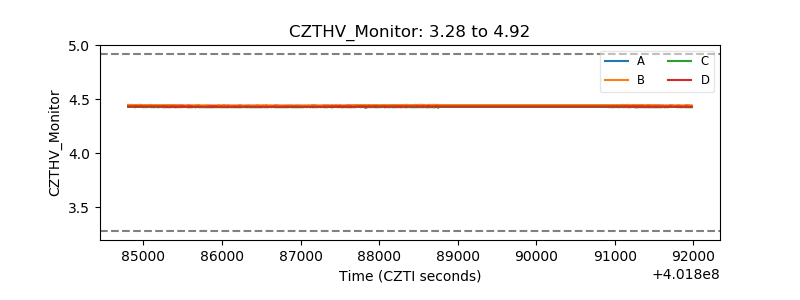 |
| D_VDD | 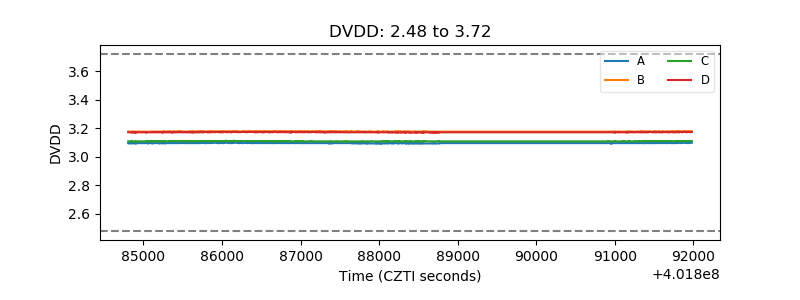 |
| Temperature 1 | 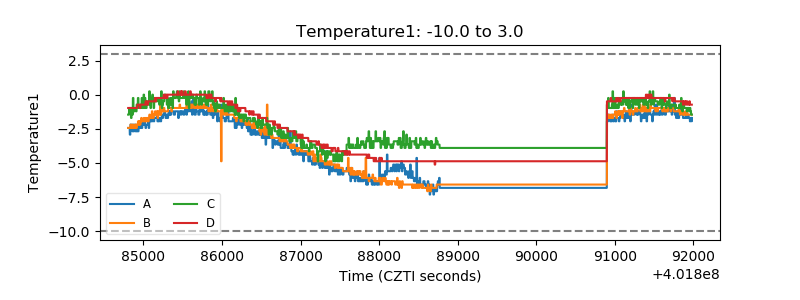 |
| Veto HV Monitor | 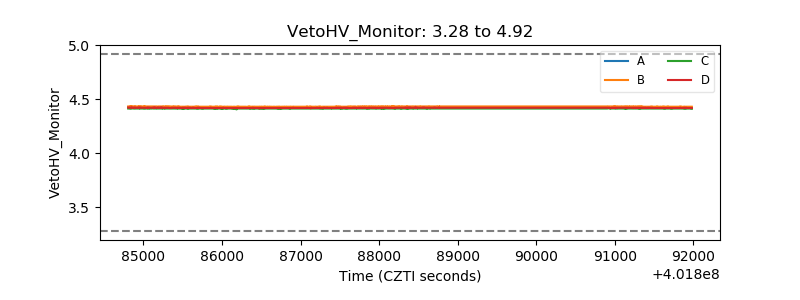 |
| Veto LLD | 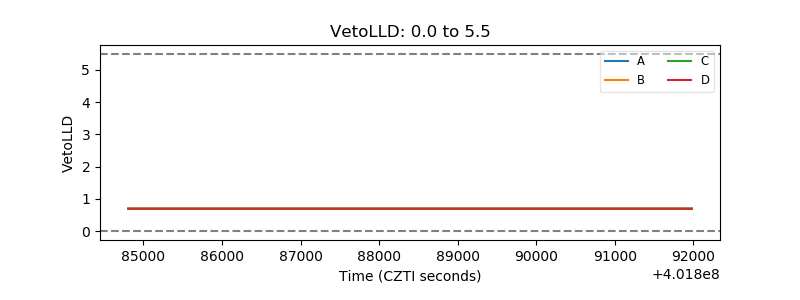 |
| Alpha Counter | 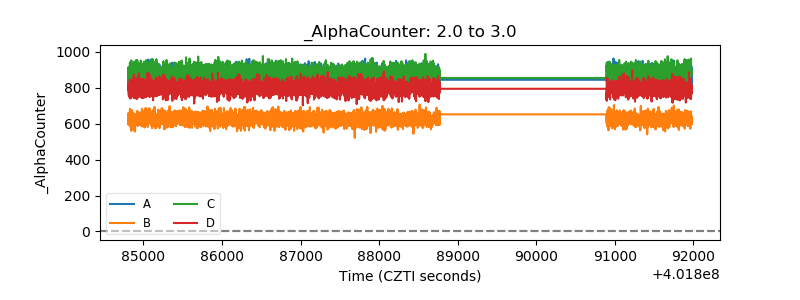 |
| _CPM_Rate | 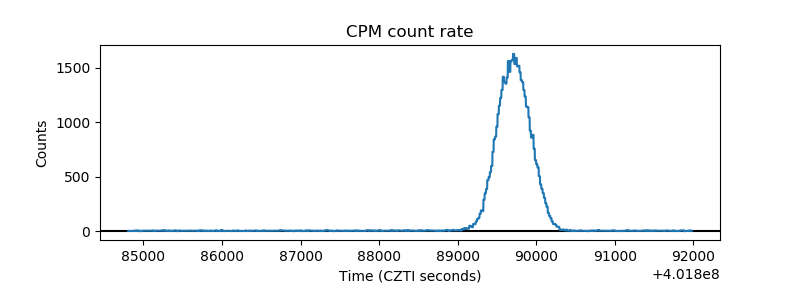 |
| CZT Counter | 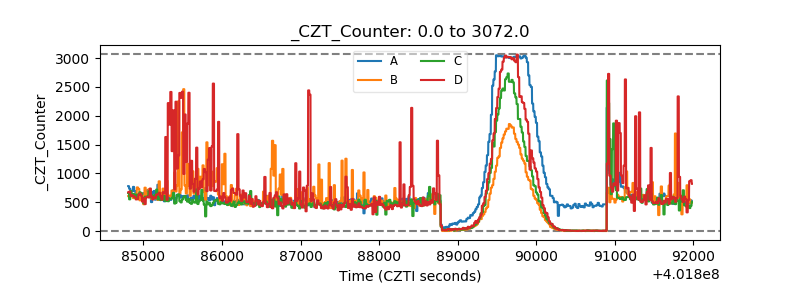 |
| +2.5 Volts monitor | 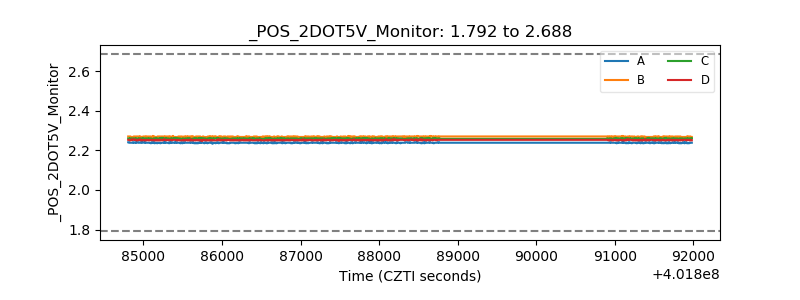 |
| +5 Volts monitor | 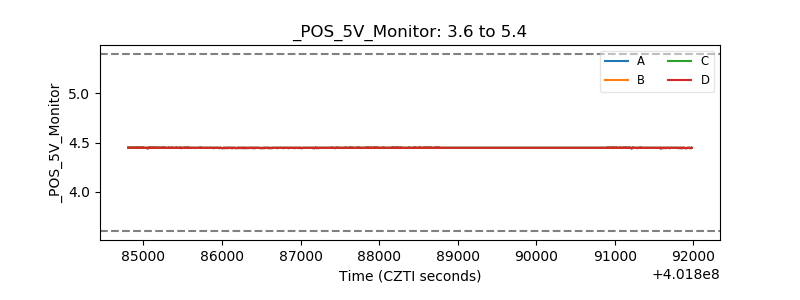 |
| _ROLL_ROT | 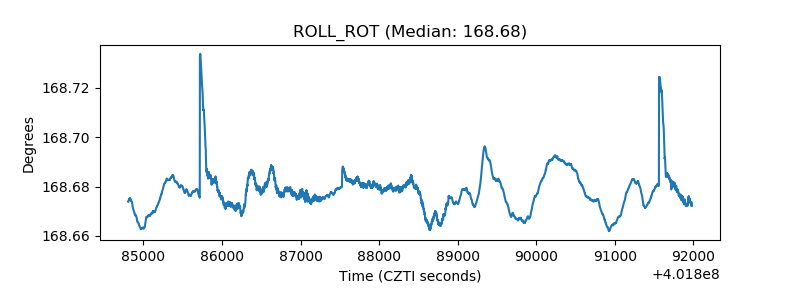 |
| _Roll_DEC | 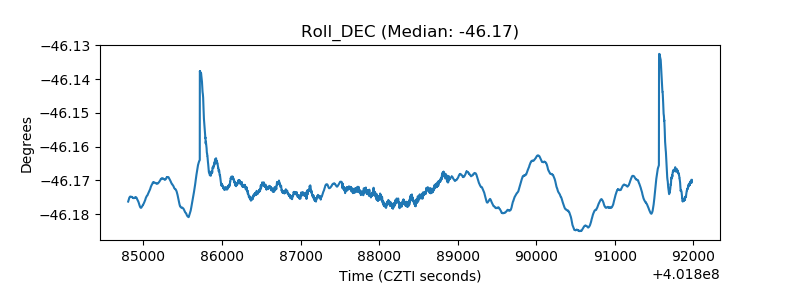 |
| _Roll_RA | 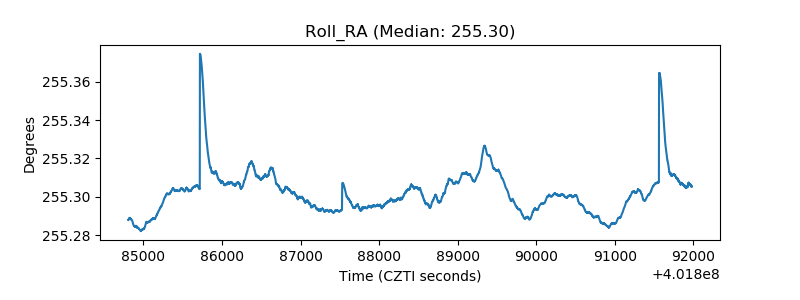 |
| Veto Counter | 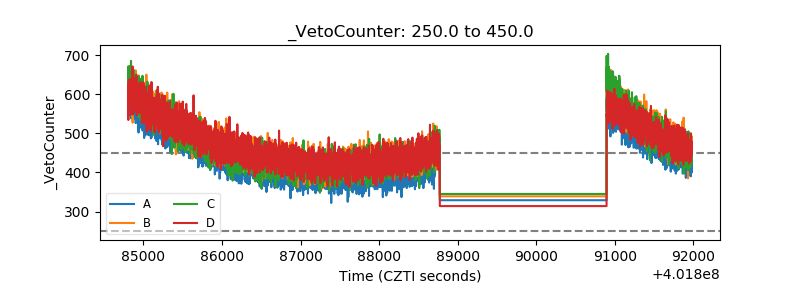 |