| Param | Original file | Final file |
|---|---|---|
| Filename | modeM0/AS1T05_054T01_9000005350_37826cztM0_level2.evt | modeM0/AS1T05_054T01_9000005350_37826cztM0_level2_quad_clean.evt |
| Size (bytes) | 409,354,560 | 80,939,520 |
| Size | 390.4 MB | 77.2 MB |
| Events in quadrant A | 2,790,291 | 536,850 |
| Events in quadrant B | 2,902,644 | 536,590 |
| Events in quadrant C | 2,759,187 | 524,860 |
| Events in quadrant D | 3,598,358 | 494,869 |
| Mode M9 | |||
|---|---|---|---|
| Quadrant | BADHDUFLAG | Total packets | Discarded packets |
| A | 0 | 21 | 0 |
| B | 0 | 21 | 0 |
| C | 0 | 21 | 0 |
| D | 0 | 21 | 0 |
| Mode SS | |||
|---|---|---|---|
| Quadrant | BADHDUFLAG | Total packets | Discarded packets |
| A | 0 | 104 | 0 |
| B | 0 | 104 | 0 |
| C | 0 | 104 | 0 |
| D | 0 | 104 | 0 |
| Mode M0 | |||
|---|---|---|---|
| Quadrant | BADHDUFLAG | Total packets | Discarded packets |
| A | 0 | 11297 | 2 |
| B | 0 | 11884 | 1 |
| C | 0 | 11256 | 1 |
| D | 0 | 13916 | 1 |
| Quadrant | Total seconds | Saturated seconds | Saturation percentage |
|---|---|---|---|
| A | 5104 | 15 | 0.293887% |
| B | 5104 | 34 | 0.666144% |
| C | 5104 | 36 | 0.705329% |
| D | 5104 | 229 | 4.486677% |
Noise dominated data is calculated using 1-second bins in cleaned event files. If a bin has >2000 counts, and if more than 50% of those come from <1% of pixels, then it is considered to be noise-dominated and hence unusable.
| Quadrant | # 1 sec bins | Bins with >0 counts | Bins with >2000 counts | High rate bins dominated by noise | Noise dominated (total time) | Noise dominated (detector-on time) | Marked lightcurve |
|---|---|---|---|---|---|---|---|
| A | 7226 | 5104 | 9 | 9 | 0.12% | 0.18% | 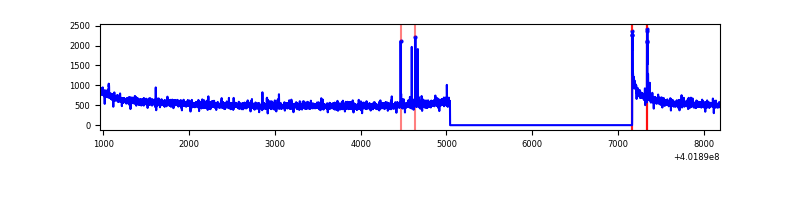 |
| B | 7226 | 5103 | 21 | 21 | 0.29% | 0.41% | 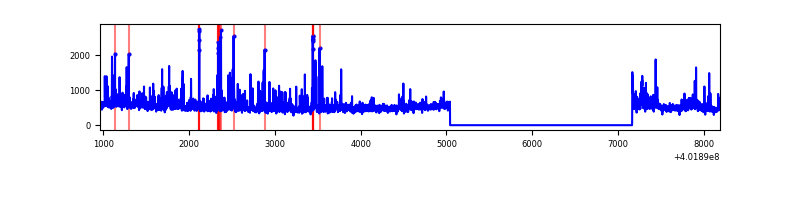 |
| C | 7226 | 5103 | 38 | 38 | 0.53% | 0.74% | 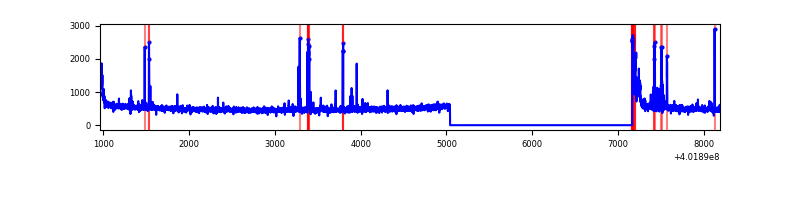 |
| D | 7226 | 5103 | 253 | 253 | 3.50% | 4.96% | 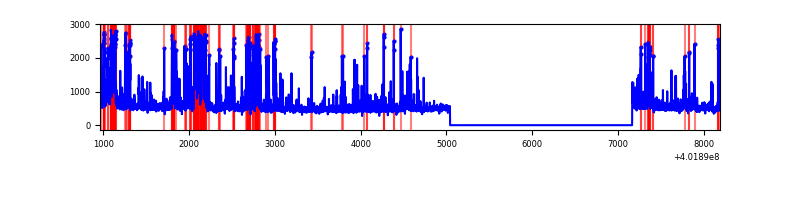 |
Top three noisy pixels from each quadrant. If the there are fewer than three noisy pixels in the level2.evt file, extra rows are filled as -1
| Pixel properties | Quadrant properties | ||||||
|---|---|---|---|---|---|---|---|
| Quadrant | DetID | PixID | Counts | Sigma | Mean | Median | Sigma |
| A | 10 | 83 | 336752 | 2749.79 | 611 | 601 | 122.2 |
| A | 9 | 143 | 31986 | 256.74 | 611 | 601 | 122.2 |
| A | 13 | 6 | 26660 | 213.17 | 611 | 601 | 122.2 |
| B | 5 | 172 | 145930 | 1269.97 | 604 | 589 | 114.4 |
| B | 4 | 171 | 108064 | 939.1 | 604 | 589 | 114.4 |
| B | 0 | 229 | 104721 | 909.89 | 604 | 589 | 114.4 |
| C | 15 | 214 | 217612 | 1634.19 | 577 | 582 | 132.8 |
| C | 0 | 10 | 122632 | 919.01 | 577 | 582 | 132.8 |
| C | 15 | 159 | 77093 | 576.11 | 577 | 582 | 132.8 |
| D | 2 | 249 | 336254 | 2387.26 | 577 | 561 | 140.6 |
| D | 12 | 233 | 326231 | 2315.98 | 577 | 561 | 140.6 |
| D | 12 | 218 | 147842 | 1047.38 | 577 | 561 | 140.6 |
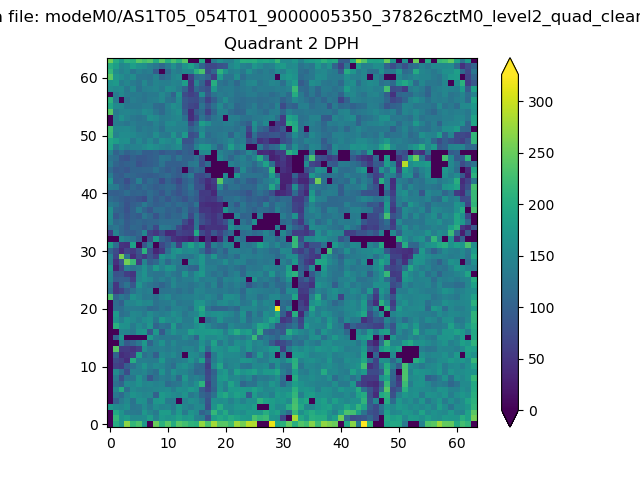
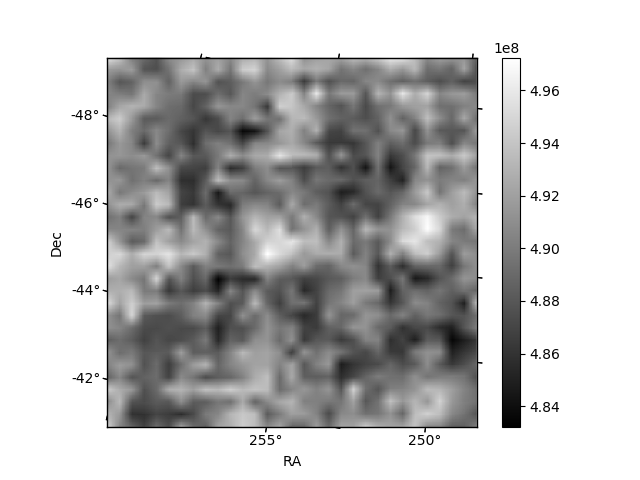
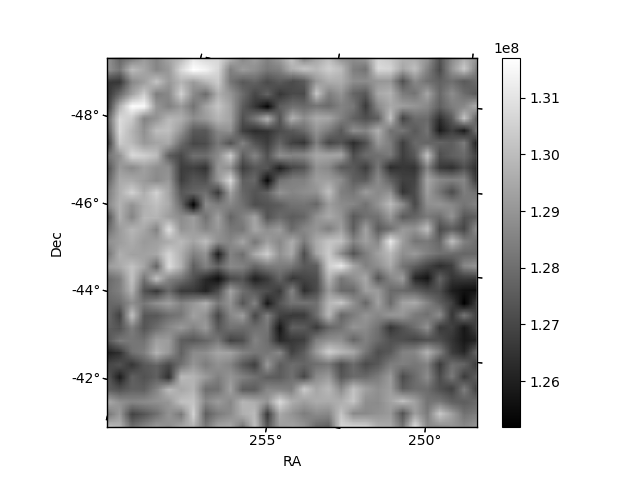
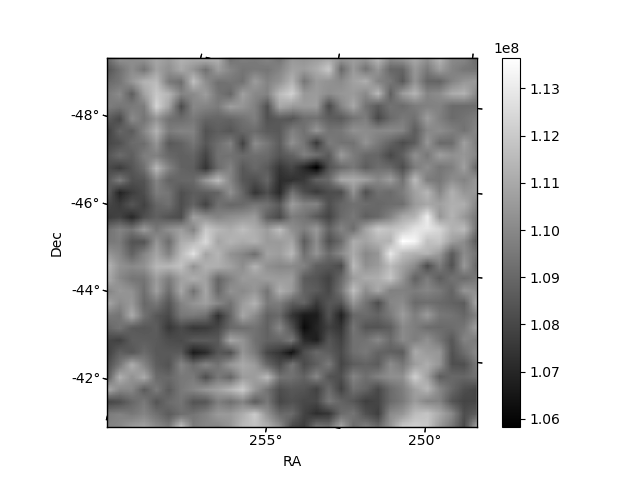
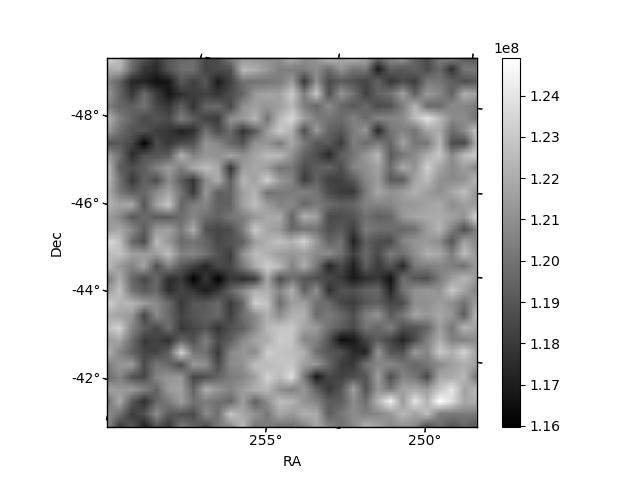
Histogram calculated using DETX and DETY for each event in the final _common_clean file
| Quadrant A | 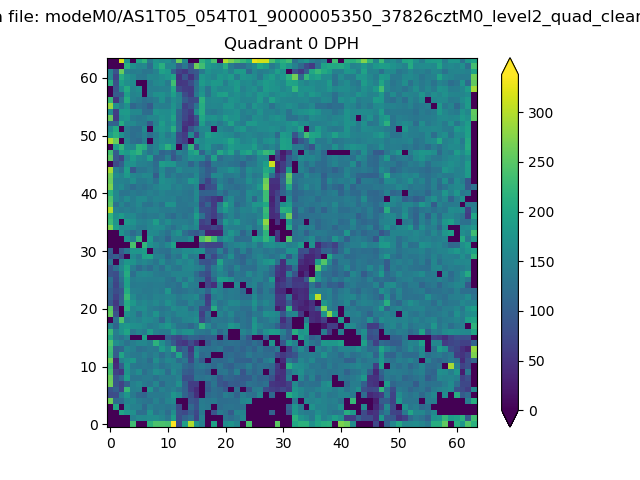 |
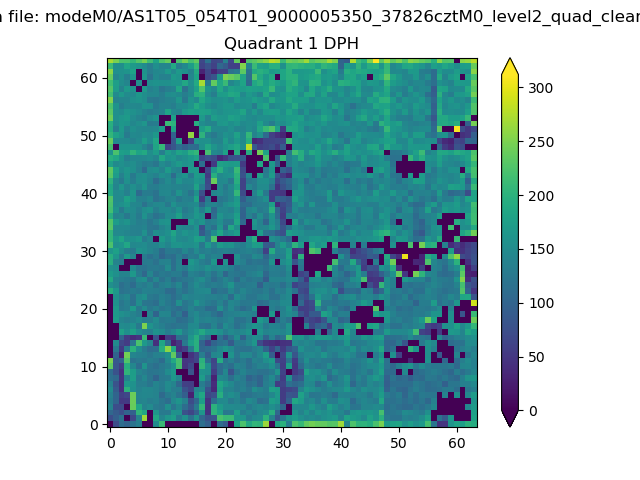 |
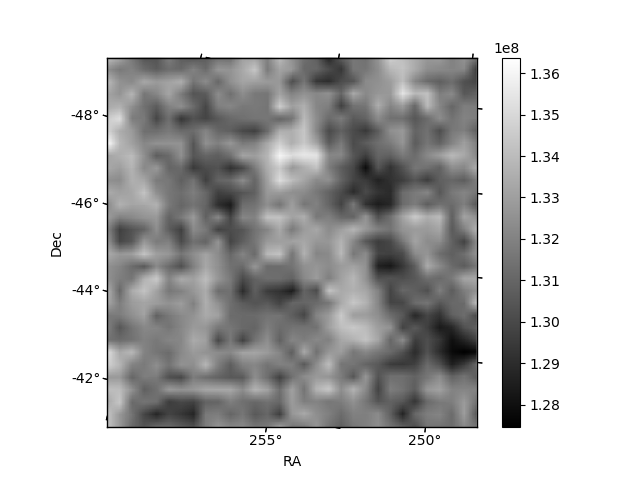
Quadrant B |
|---|---|---|---|
| Quadrant D | 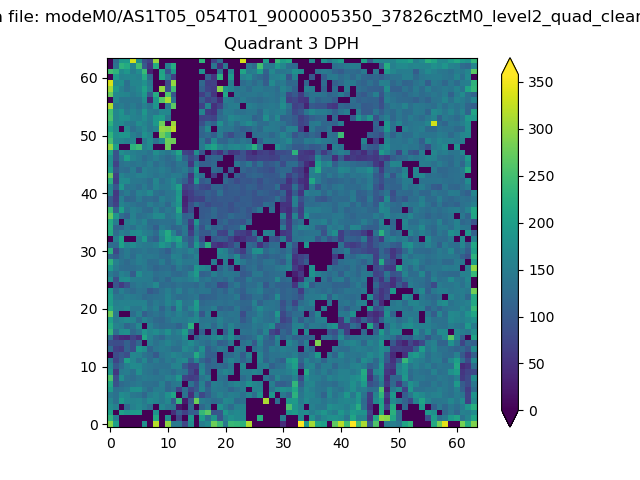 |
 |
Quadrant C |
| Plot type | Count rate plots | Images |
|---|---|---|
| Comparison with Poisson distribution Blue bars denote a histogram of data divided into 1 sec bins. Red curve is a Poisson curve with rate = median count rate of data. |
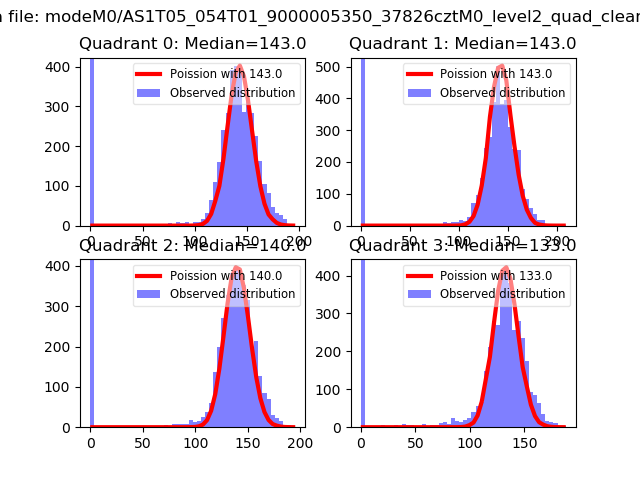 |
 |
| Quadrant-wise count rates Data is divided into 100 sec bins |
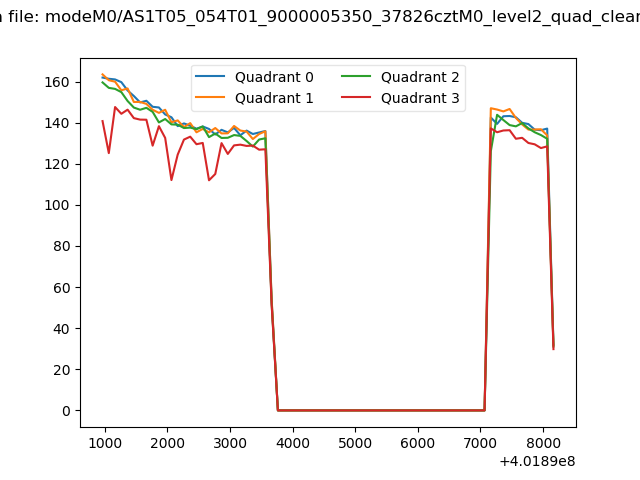 |
|
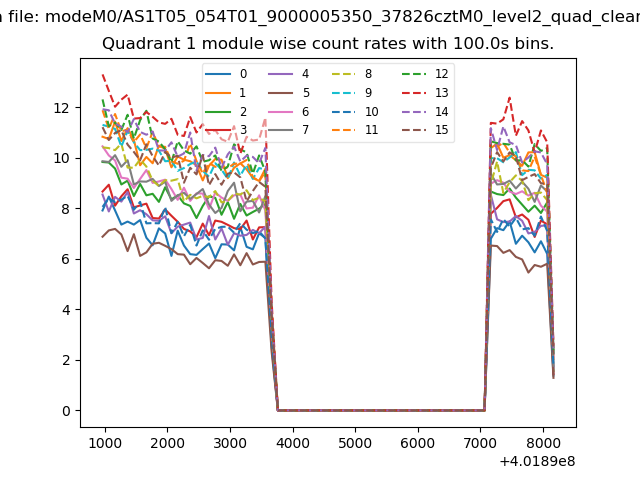
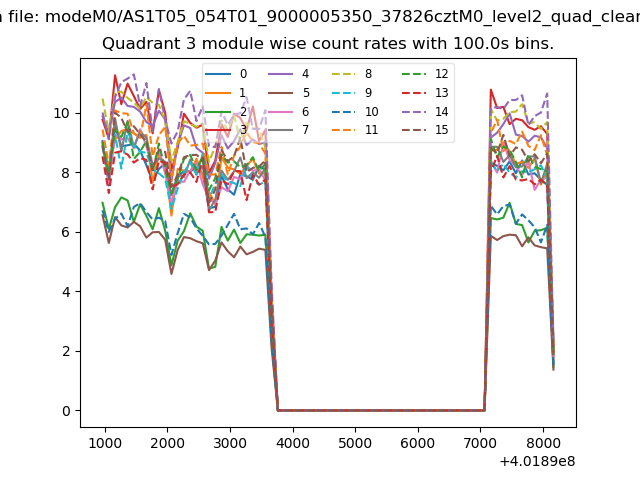
| Module-wise count rates for Quadrant A Data is divided into 100 sec bins |
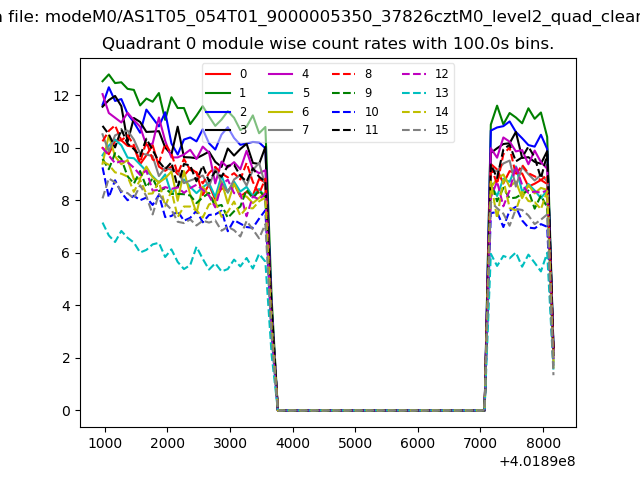 |
 |
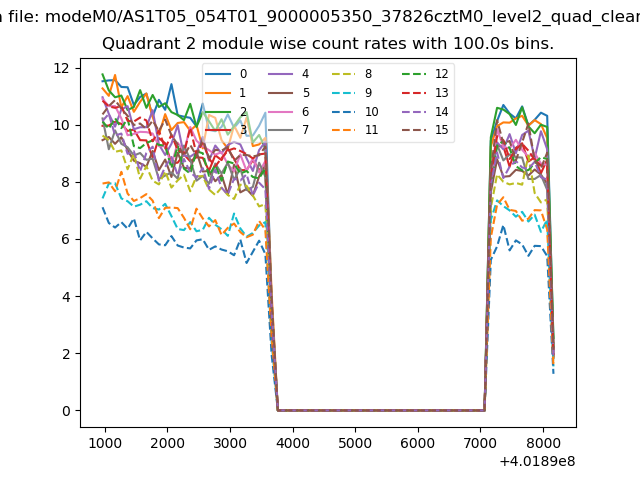
| Module-wise count rates for Quadrant B Data is divided into 100 sec bins |
 |
 |
| Module-wise count rates for Quadrant C Data is divided into 100 sec bins |
 |
 |
| Module-wise count rates for Quadrant D Data is divided into 100 sec bins |
 |
 |
| Parameter | Plot |
|---|---|
| CZT HV Monitor | 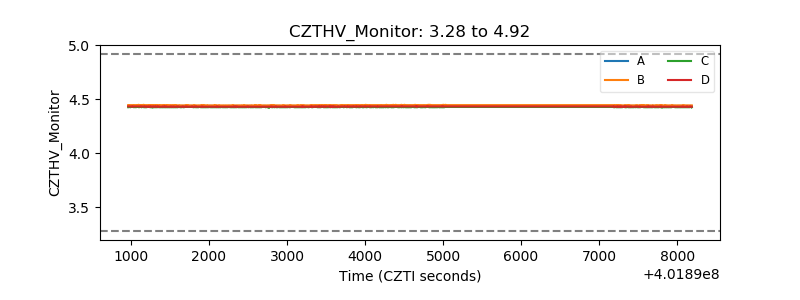 |
| D_VDD | 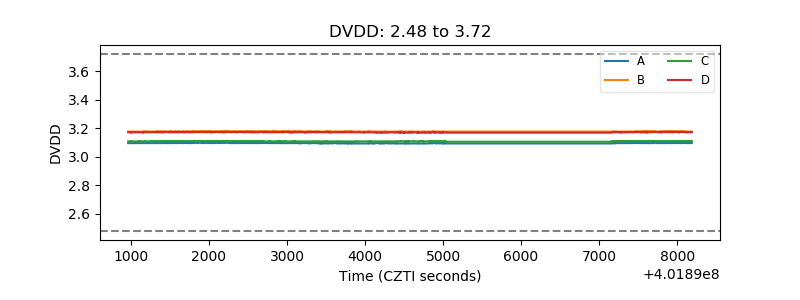 |
| Temperature 1 | 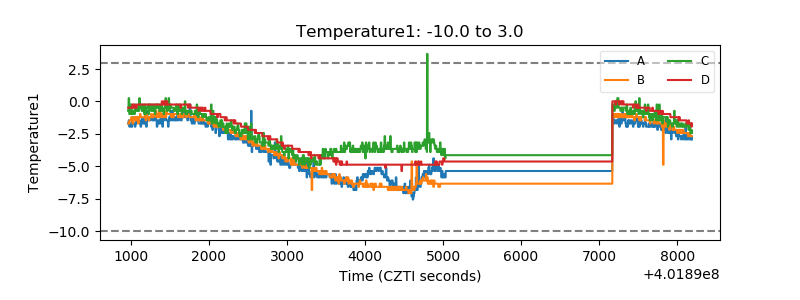 |
| Veto HV Monitor | 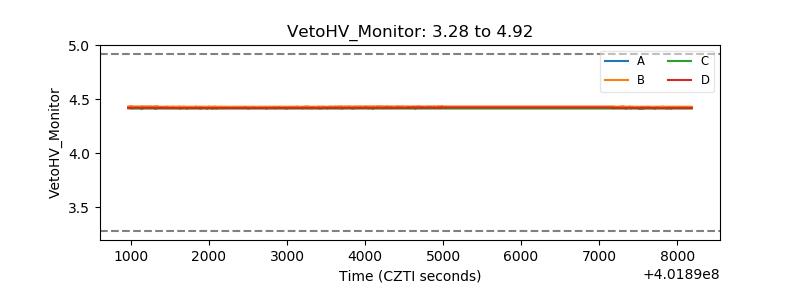 |
| Veto LLD | 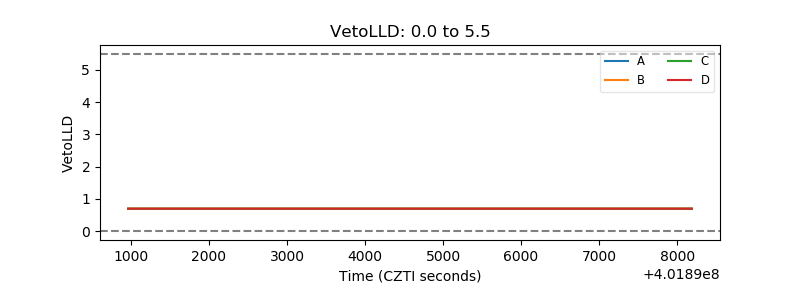 |
| Alpha Counter | 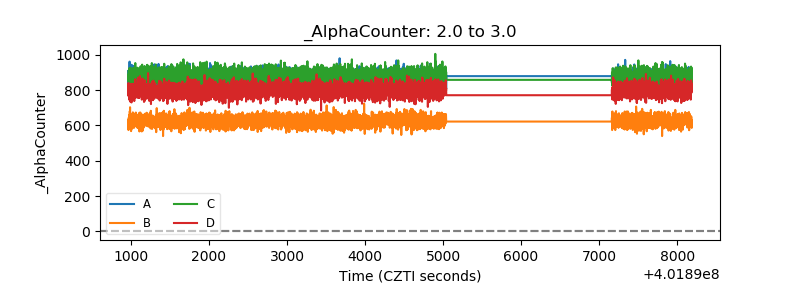 |
| _CPM_Rate |  |
| CZT Counter | 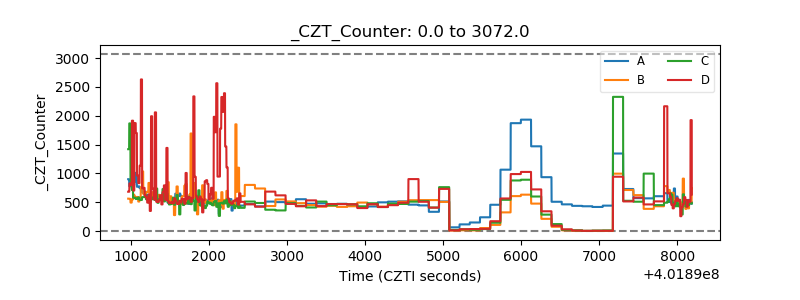 |
| +2.5 Volts monitor | 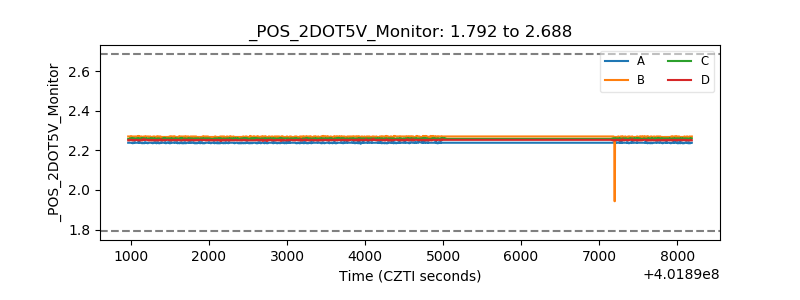 |
| +5 Volts monitor |  |
| _ROLL_ROT | 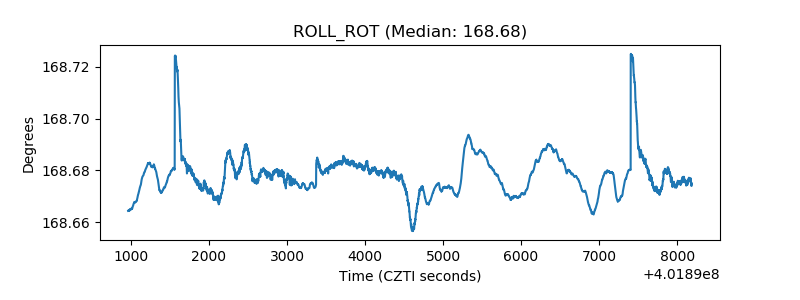 |
| _Roll_DEC | 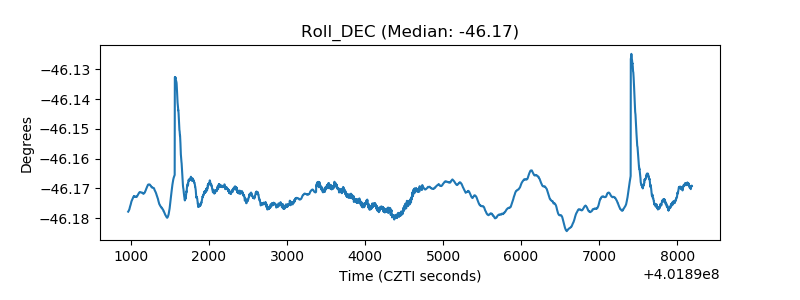 |
| _Roll_RA | 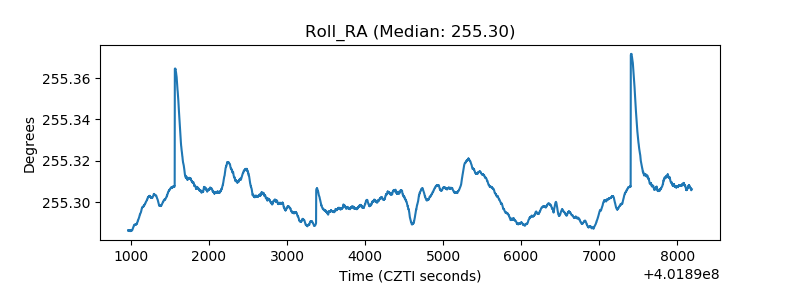 |
| Veto Counter | 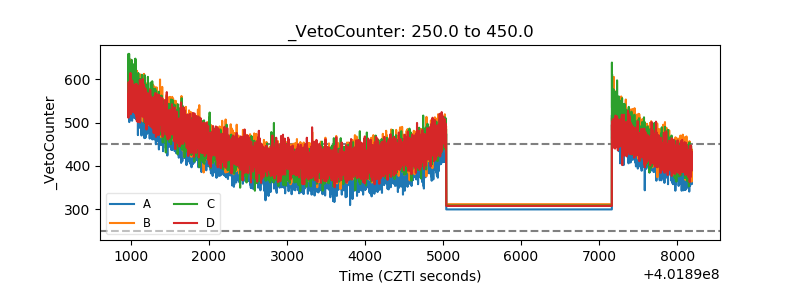 |