| Param | Original file | Final file |
|---|---|---|
| Filename | modeM0/AS1T05_054T01_9000005350_37827cztM0_level2.evt | modeM0/AS1T05_054T01_9000005350_37827cztM0_level2_quad_clean.evt |
| Size (bytes) | 156,024,000 | 38,376,000 |
| Size | 148.8 MB | 36.6 MB |
| Events in quadrant A | 1,064,291 | 260,848 |
| Events in quadrant B | 1,145,535 | 260,379 |
| Events in quadrant C | 1,093,141 | 256,059 |
| Events in quadrant D | 1,288,928 | 244,029 |
| Mode SS | |||
|---|---|---|---|
| Quadrant | BADHDUFLAG | Total packets | Discarded packets |
| A | 0 | 38 | 0 |
| B | 0 | 38 | 0 |
| C | 0 | 38 | 0 |
| D | 0 | 38 | 0 |
| Mode M0 | |||
|---|---|---|---|
| Quadrant | BADHDUFLAG | Total packets | Discarded packets |
| A | 0 | 4343 | 1 |
| B | 0 | 4673 | 1 |
| C | 0 | 4484 | 1 |
| D | 0 | 5088 | 1 |
| Quadrant | Total seconds | Saturated seconds | Saturation percentage |
|---|---|---|---|
| A | 1929 | 13 | 0.673924% |
| B | 1929 | 26 | 1.347849% |
| C | 1929 | 25 | 1.296008% |
| D | 1930 | 76 | 3.937824% |
Noise dominated data is calculated using 1-second bins in cleaned event files. If a bin has >2000 counts, and if more than 50% of those come from <1% of pixels, then it is considered to be noise-dominated and hence unusable.
| Quadrant | # 1 sec bins | Bins with >0 counts | Bins with >2000 counts | High rate bins dominated by noise | Noise dominated (total time) | Noise dominated (detector-on time) | Marked lightcurve |
|---|---|---|---|---|---|---|---|
| A | 1929 | 1929 | 8 | 8 | 0.41% | 0.41% | 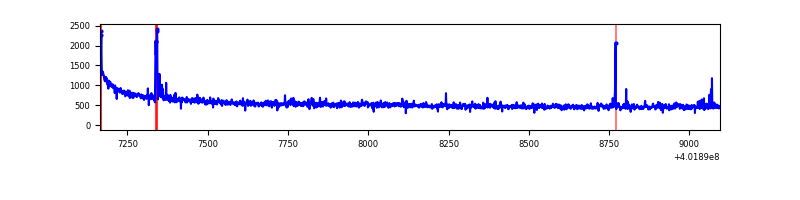 |
| B | 1928 | 1928 | 16 | 16 | 0.83% | 0.83% | 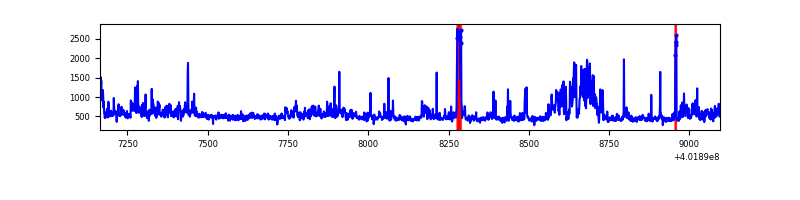 |
| C | 1929 | 1929 | 26 | 26 | 1.35% | 1.35% | 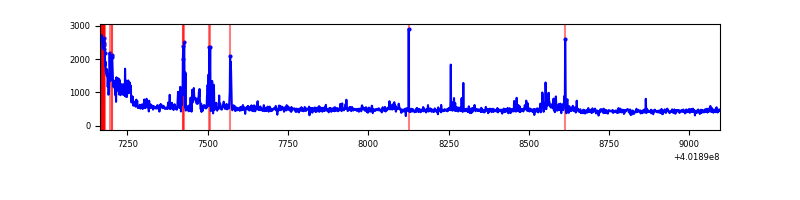 |
| D | 1929 | 1929 | 84 | 84 | 4.35% | 4.35% | 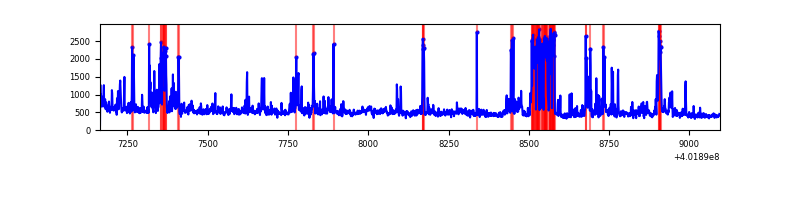 |
Top three noisy pixels from each quadrant. If the there are fewer than three noisy pixels in the level2.evt file, extra rows are filled as -1
| Pixel properties | Quadrant properties | ||||||
|---|---|---|---|---|---|---|---|
| Quadrant | DetID | PixID | Counts | Sigma | Mean | Median | Sigma |
| A | 10 | 83 | 161746 | 3505.07 | 222 | 218 | 46.1 |
| A | 9 | 143 | 23114 | 496.83 | 222 | 218 | 46.1 |
| A | 13 | 6 | 14737 | 315.05 | 222 | 218 | 46.1 |
| B | 4 | 232 | 90851 | 2085.68 | 217 | 212 | 43.5 |
| B | 5 | 172 | 66539 | 1526.24 | 217 | 212 | 43.5 |
| B | 0 | 213 | 56288 | 1290.36 | 217 | 212 | 43.5 |
| C | 0 | 10 | 91036 | 1817.06 | 206 | 208 | 50.0 |
| C | 15 | 214 | 84437 | 1685.05 | 206 | 208 | 50.0 |
| C | 15 | 159 | 76758 | 1531.43 | 206 | 208 | 50.0 |
| D | 2 | 249 | 196922 | 3755.95 | 208 | 202 | 52.4 |
| D | 12 | 233 | 68362 | 1301.37 | 208 | 202 | 52.4 |
| D | 10 | 199 | 54111 | 1029.28 | 208 | 202 | 52.4 |
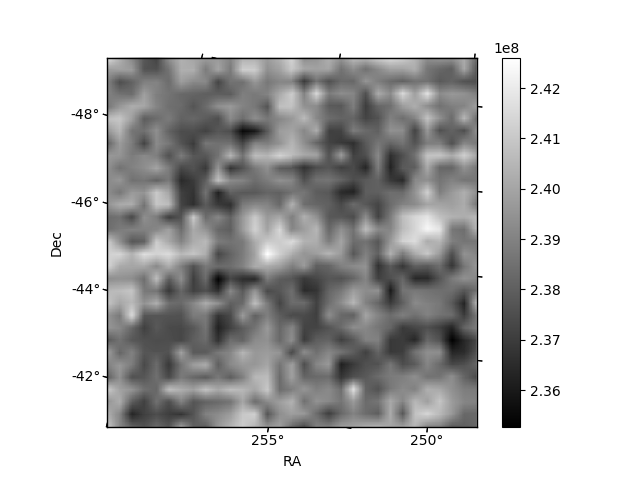
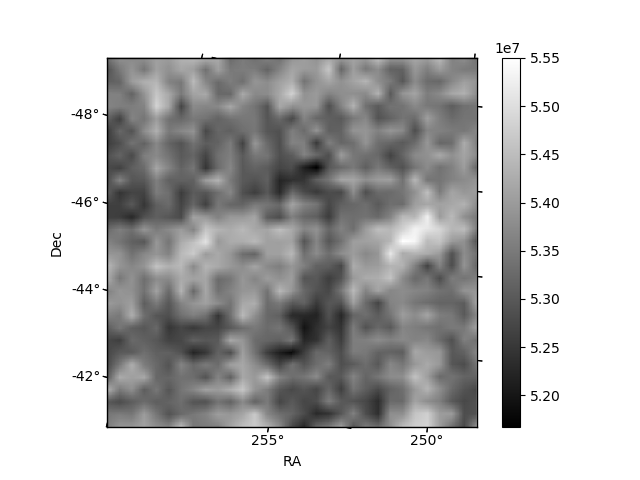
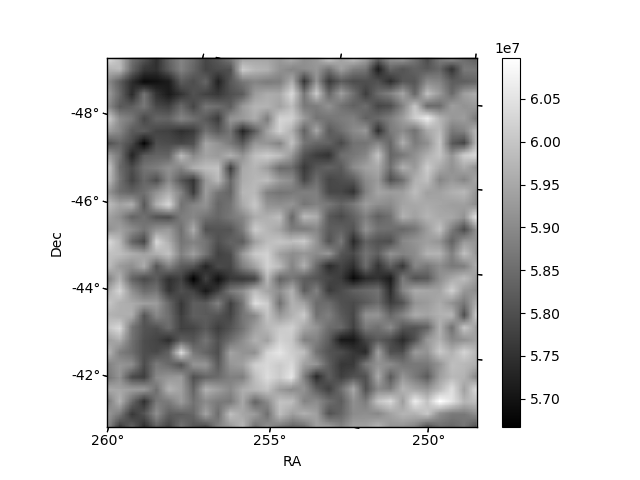
Histogram calculated using DETX and DETY for each event in the final _common_clean file
| Quadrant A | 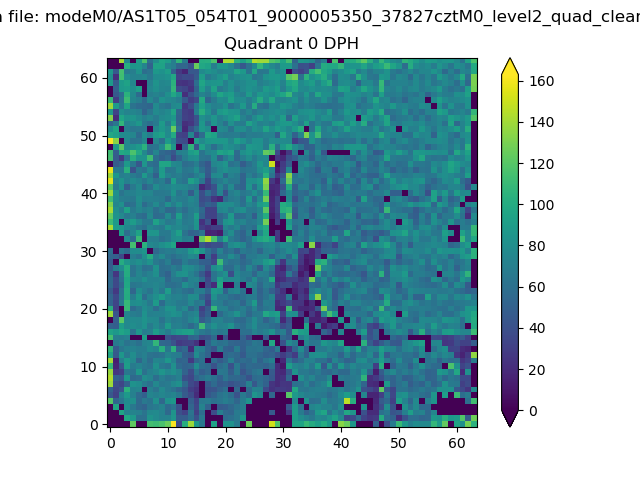 |
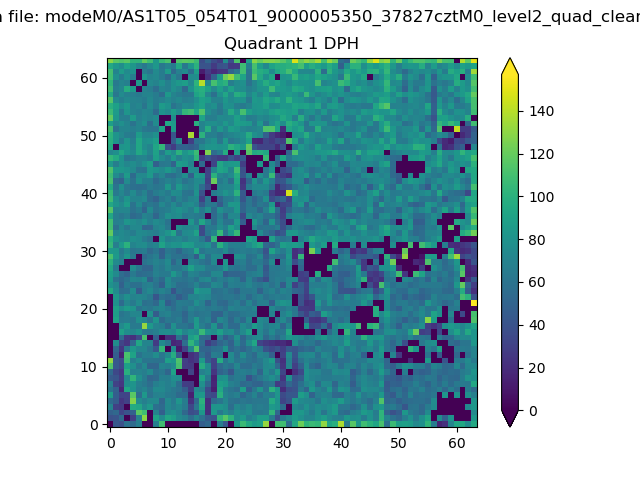 |
Quadrant B |
|---|---|---|---|
| Quadrant D | 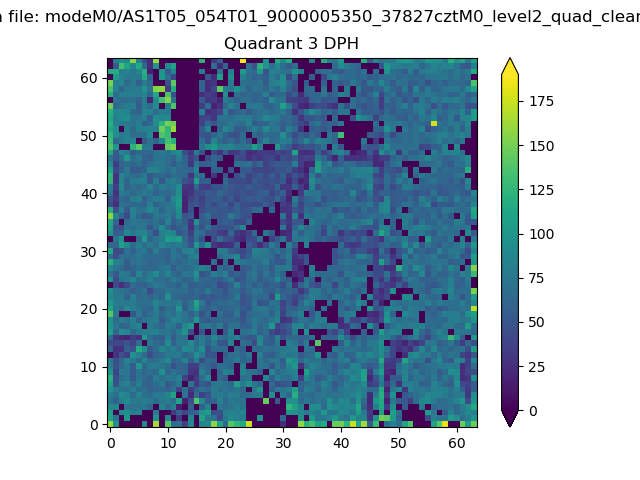 |
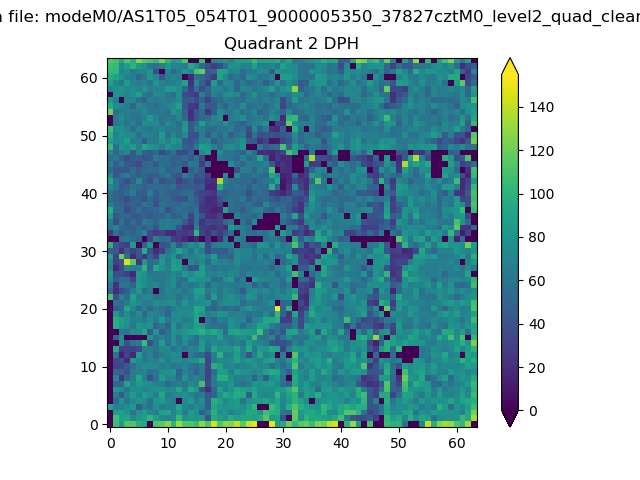 |
Quadrant C |
| Plot type | Count rate plots | Images |
|---|---|---|
| Comparison with Poisson distribution Blue bars denote a histogram of data divided into 1 sec bins. Red curve is a Poisson curve with rate = median count rate of data. |
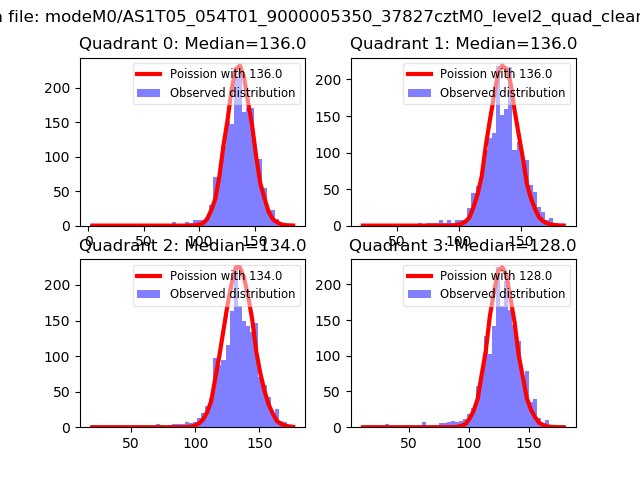 |
 |
| Quadrant-wise count rates Data is divided into 100 sec bins |
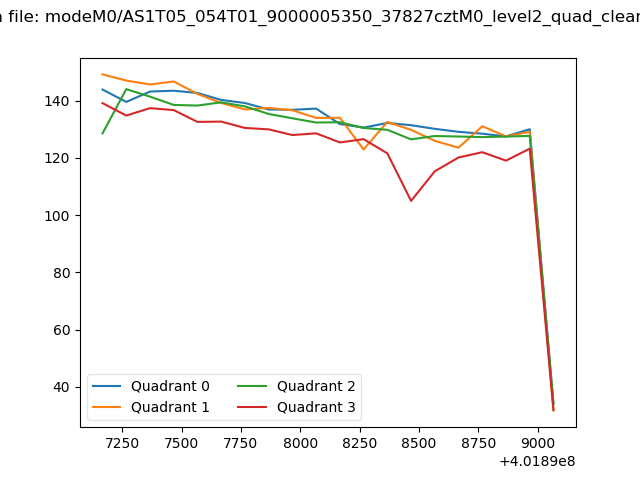 |
|
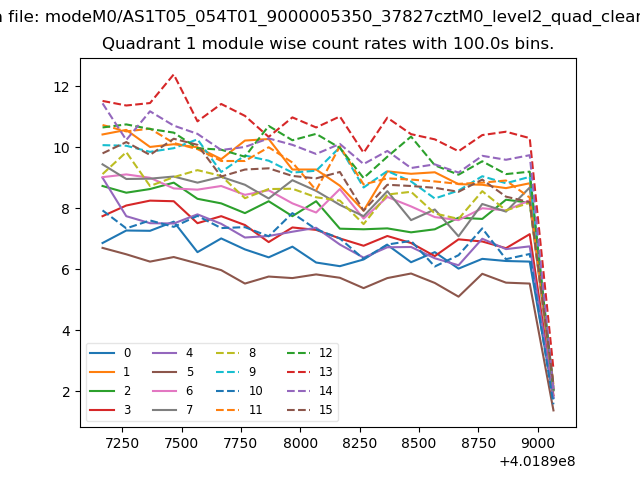
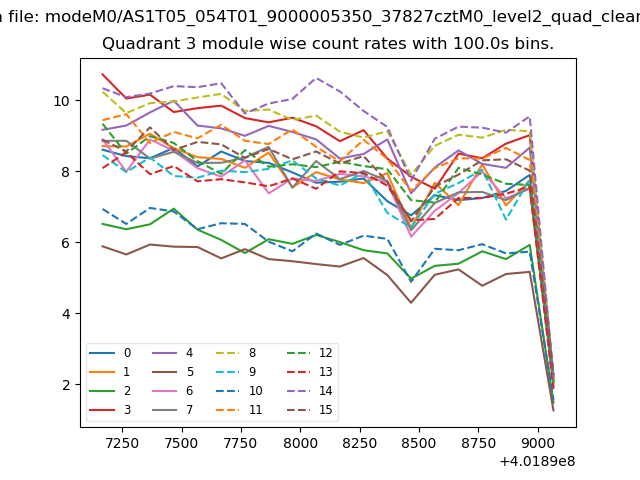
| Module-wise count rates for Quadrant A Data is divided into 100 sec bins |
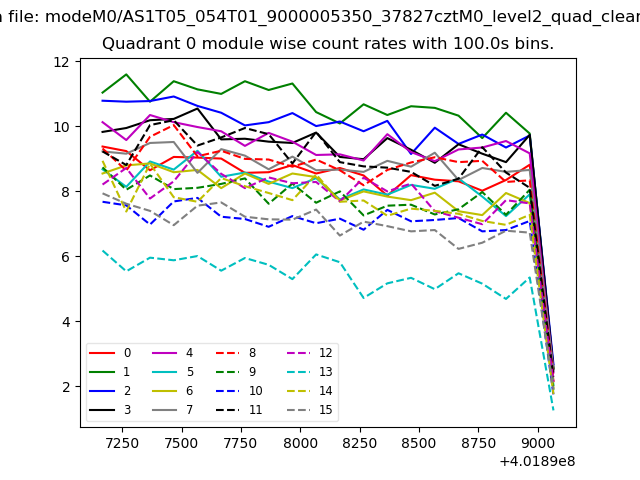 |
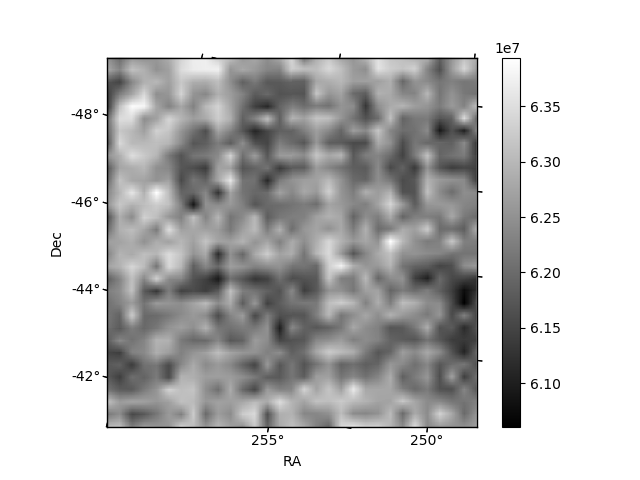 |
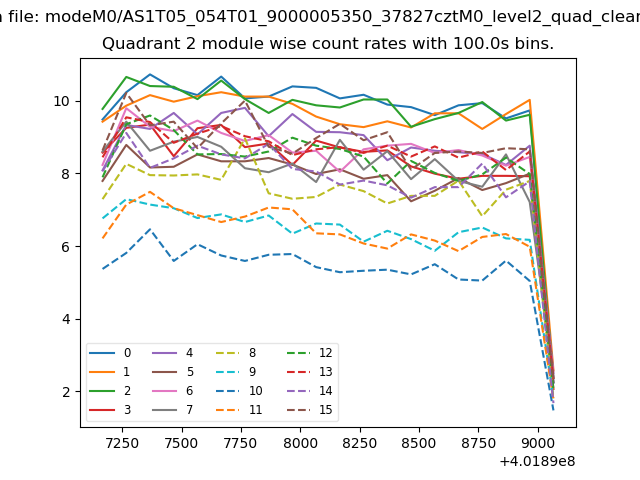
| Module-wise count rates for Quadrant B Data is divided into 100 sec bins |
 |
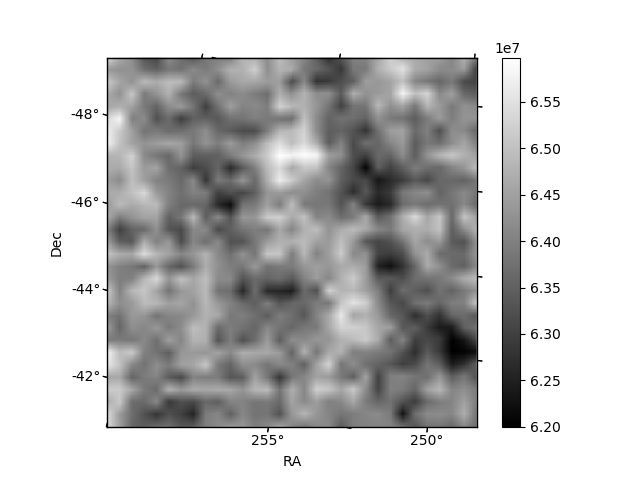 |
| Module-wise count rates for Quadrant C Data is divided into 100 sec bins |
 |
 |
| Module-wise count rates for Quadrant D Data is divided into 100 sec bins |
 |
 |
| Parameter | Plot |
|---|---|
| CZT HV Monitor | 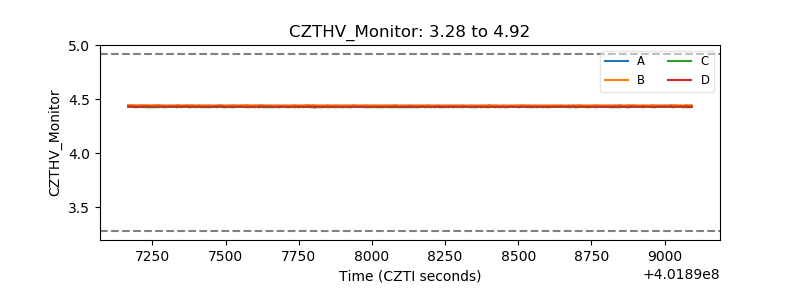 |
| D_VDD | 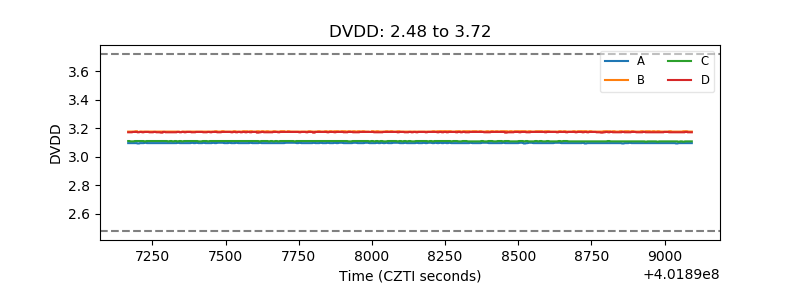 |
| Temperature 1 | 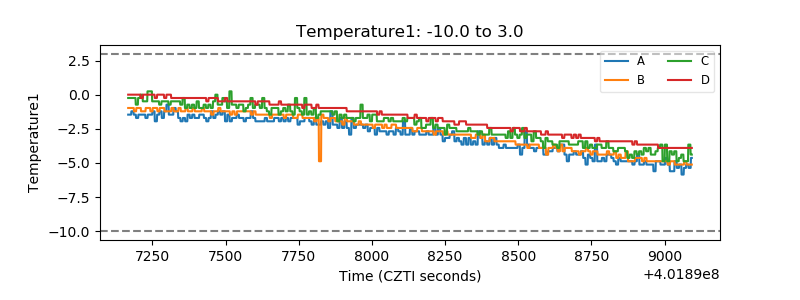 |
| Veto HV Monitor | 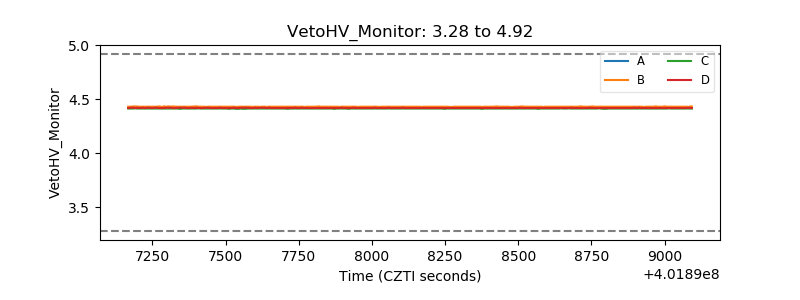 |
| Veto LLD | 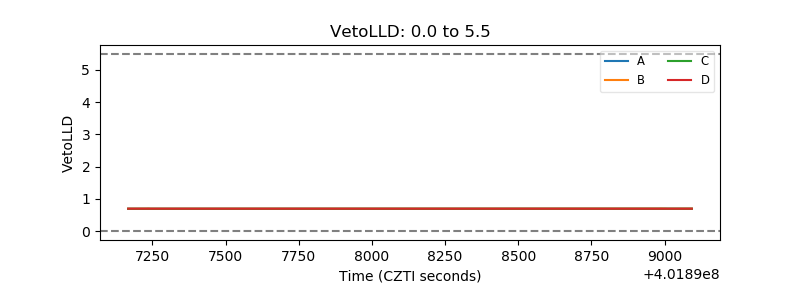 |
| Alpha Counter | 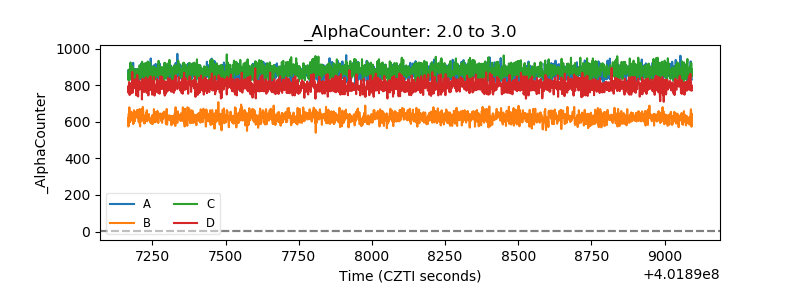 |
| _CPM_Rate | 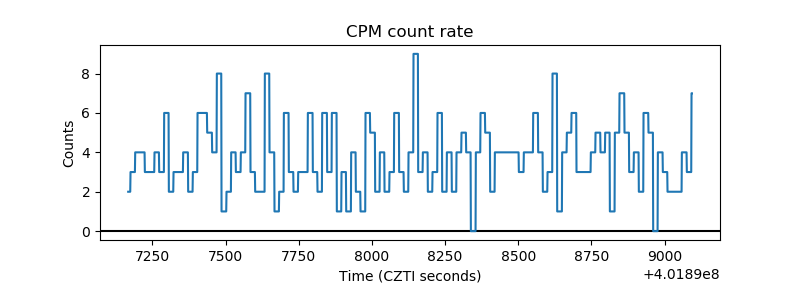 |
| CZT Counter | 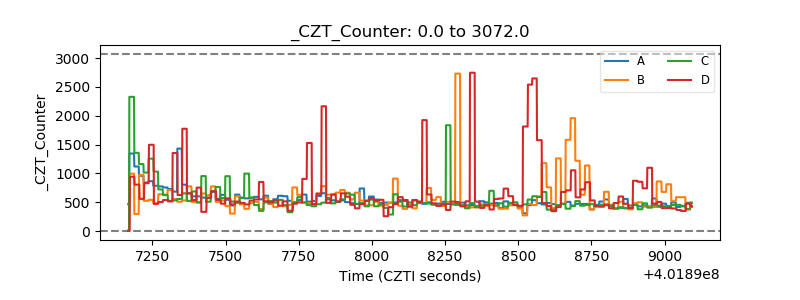 |
| +2.5 Volts monitor | 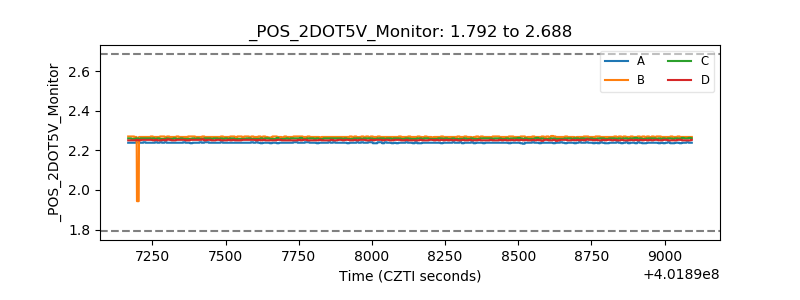 |
| +5 Volts monitor | 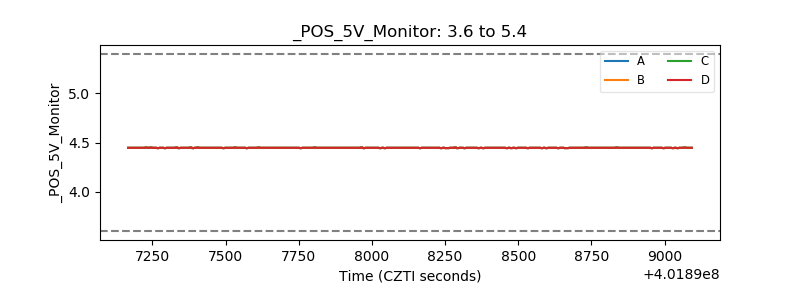 |
| _ROLL_ROT | 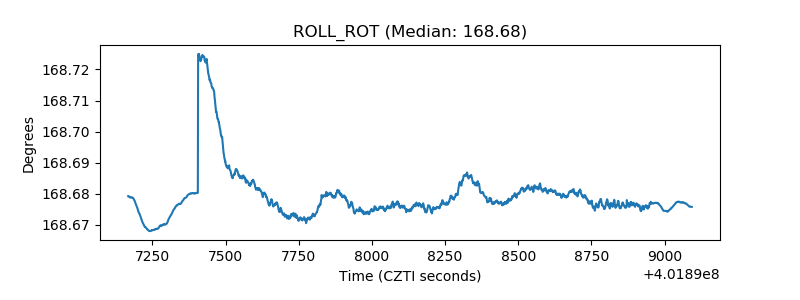 |
| _Roll_DEC | 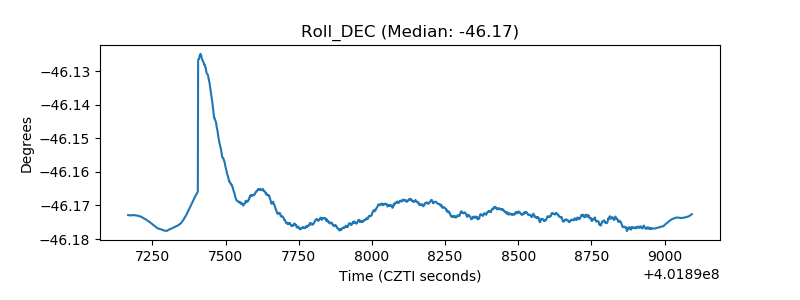 |
| _Roll_RA | 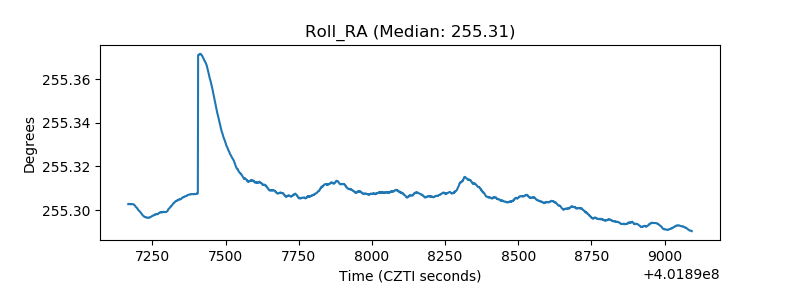 |
| Veto Counter | 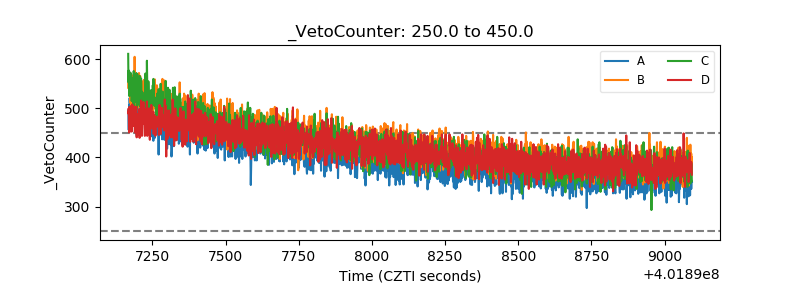 |