| Param | Original file | Final file |
|---|---|---|
| Filename | modeM0/AS1C07_001T12_9000005352_37827cztM0_level2.evt | modeM0/AS1C07_001T12_9000005352_37827cztM0_level2_quad_clean.evt |
| Size (bytes) | 148,262,400 | 28,013,760 |
| Size | 141.4 MB | 26.7 MB |
| Events in quadrant A | 1,071,204 | 180,121 |
| Events in quadrant B | 1,124,962 | 179,797 |
| Events in quadrant C | 1,067,715 | 173,778 |
| Events in quadrant D | 1,088,298 | 169,257 |
| Mode M9 | |||
|---|---|---|---|
| Quadrant | BADHDUFLAG | Total packets | Discarded packets |
| A | 0 | 21 | 0 |
| B | 0 | 21 | 0 |
| C | 0 | 21 | 0 |
| D | 0 | 21 | 0 |
| Mode M0 | |||
|---|---|---|---|
| Quadrant | BADHDUFLAG | Total packets | Discarded packets |
| A | 0 | 4349 | 2 |
| B | 0 | 4589 | 1 |
| C | 0 | 4326 | 1 |
| D | 0 | 4541 | 1 |
| Mode SS | |||
|---|---|---|---|
| Quadrant | BADHDUFLAG | Total packets | Discarded packets |
| A | 0 | 40 | 0 |
| B | 0 | 40 | 0 |
| C | 0 | 40 | 0 |
| D | 0 | 40 | 0 |
| Quadrant | Total seconds | Saturated seconds | Saturation percentage |
|---|---|---|---|
| A | 1997 | 7 | 0.350526% |
| B | 1997 | 36 | 1.802704% |
| C | 1997 | 32 | 1.602404% |
| D | 1997 | 29 | 1.452178% |
Noise dominated data is calculated using 1-second bins in cleaned event files. If a bin has >2000 counts, and if more than 50% of those come from <1% of pixels, then it is considered to be noise-dominated and hence unusable.
| Quadrant | # 1 sec bins | Bins with >0 counts | Bins with >2000 counts | High rate bins dominated by noise | Noise dominated (total time) | Noise dominated (detector-on time) | Marked lightcurve |
|---|---|---|---|---|---|---|---|
| A | 4030 | 1998 | 4 | 4 | 0.10% | 0.20% | 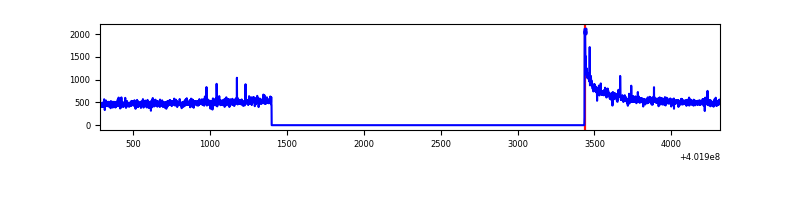 |
| B | 4030 | 1997 | 31 | 31 | 0.77% | 1.55% | 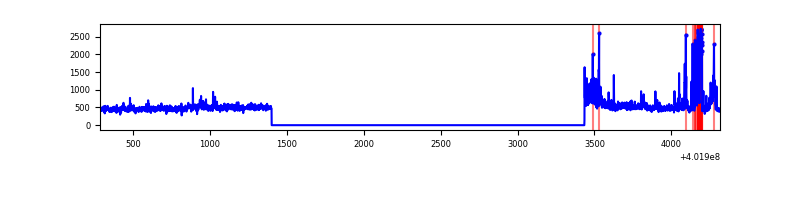 |
| C | 4029 | 1997 | 25 | 25 | 0.62% | 1.25% | 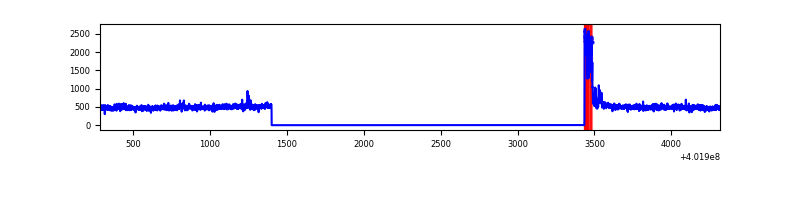 |
| D | 4029 | 1996 | 19 | 19 | 0.47% | 0.95% | 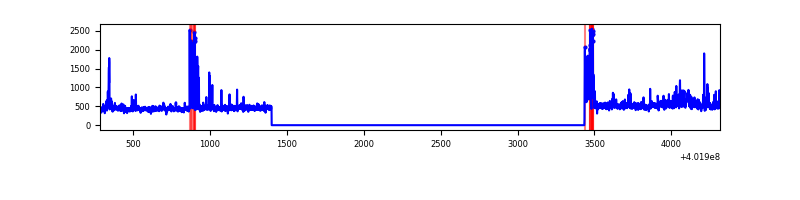 |
Top three noisy pixels from each quadrant. If the there are fewer than three noisy pixels in the level2.evt file, extra rows are filled as -1
| Pixel properties | Quadrant properties | ||||||
|---|---|---|---|---|---|---|---|
| Quadrant | DetID | PixID | Counts | Sigma | Mean | Median | Sigma |
| A | 10 | 83 | 154191 | 3166.79 | 231 | 226 | 48.6 |
| A | 13 | 6 | 6869 | 136.64 | 231 | 226 | 48.6 |
| A | 12 | 189 | 6717 | 133.51 | 231 | 226 | 48.6 |
| B | 4 | 171 | 132503 | 2955.79 | 230 | 224 | 44.8 |
| B | 0 | 229 | 16560 | 365.03 | 230 | 224 | 44.8 |
| B | 0 | 230 | 15569 | 342.89 | 230 | 224 | 44.8 |
| C | 0 | 10 | 96720 | 1822.78 | 223 | 225 | 52.9 |
| C | 15 | 214 | 85672 | 1614.08 | 223 | 225 | 52.9 |
| C | 15 | 159 | 5380 | 97.38 | 223 | 225 | 52.9 |
| D | 2 | 249 | 79971 | 1435.96 | 224 | 218 | 55.5 |
| D | 12 | 233 | 67956 | 1219.63 | 224 | 218 | 55.5 |
| D | 7 | 223 | 15528 | 275.66 | 224 | 218 | 55.5 |
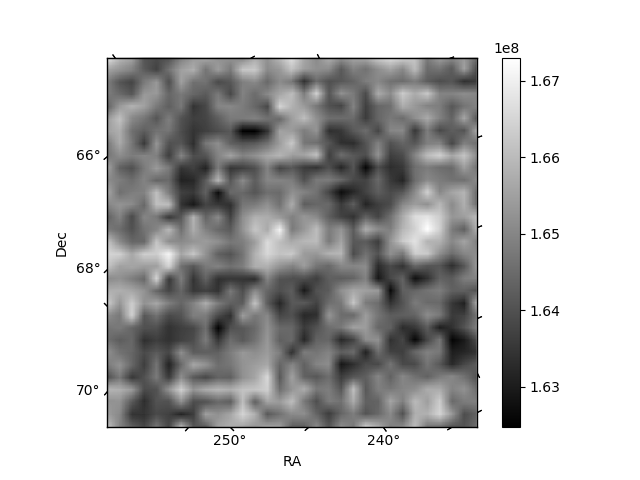
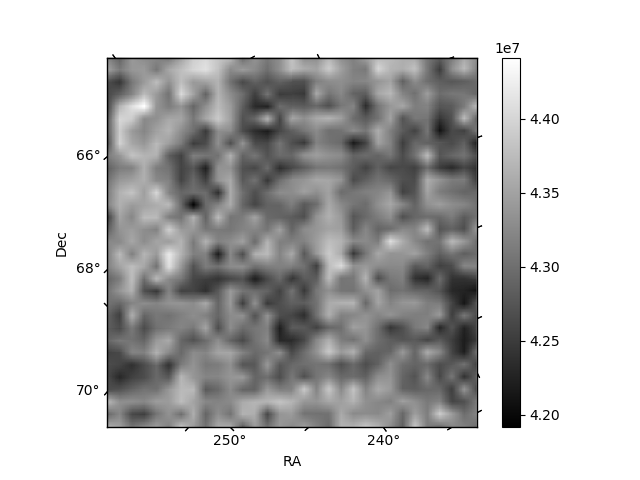
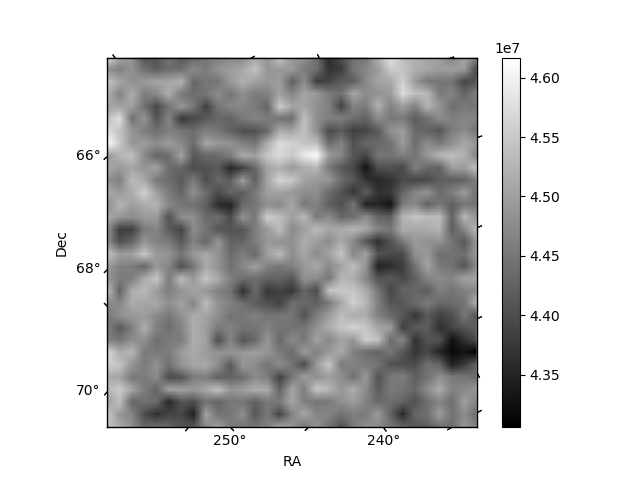
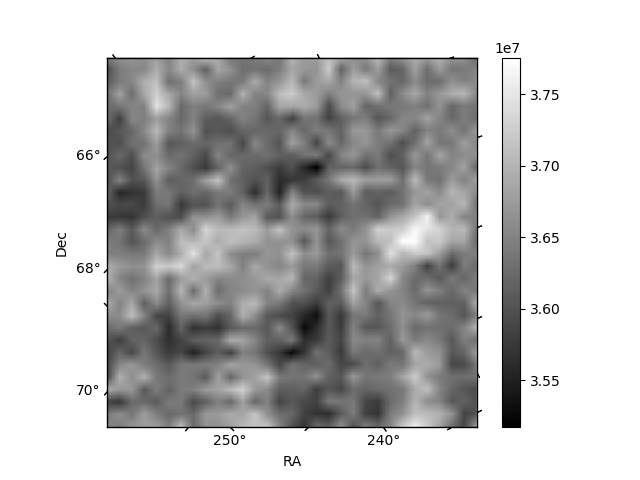
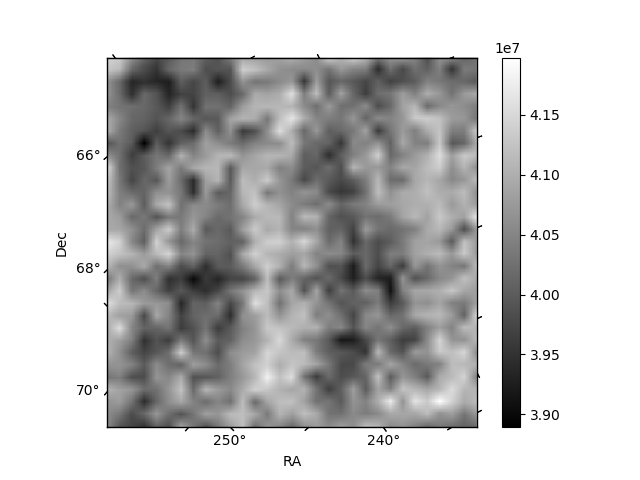
Histogram calculated using DETX and DETY for each event in the final _common_clean file
| Quadrant A | 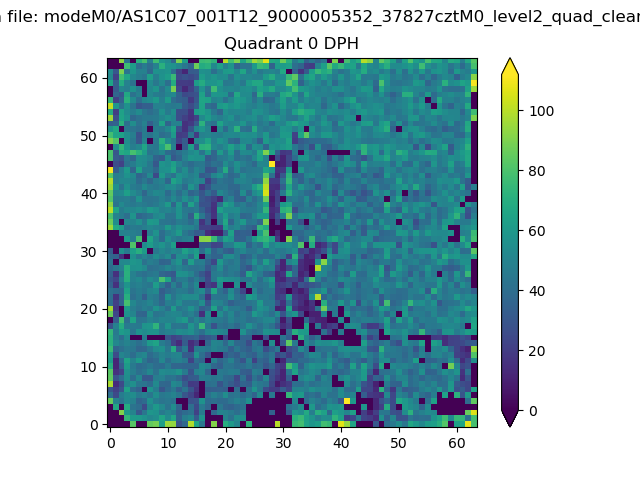 |
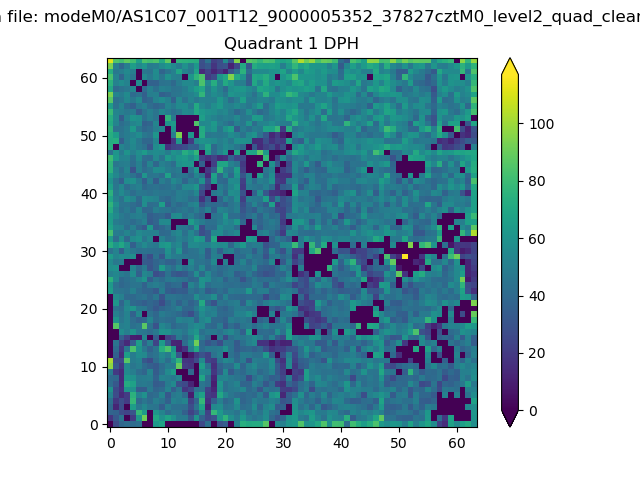 |
Quadrant B |
|---|---|---|---|
| Quadrant D | 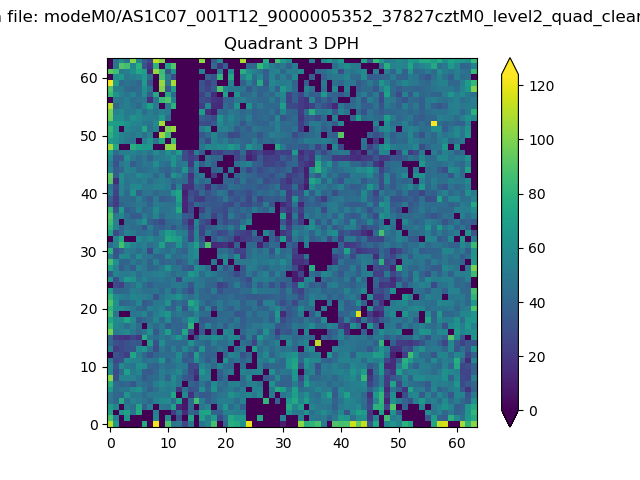 |
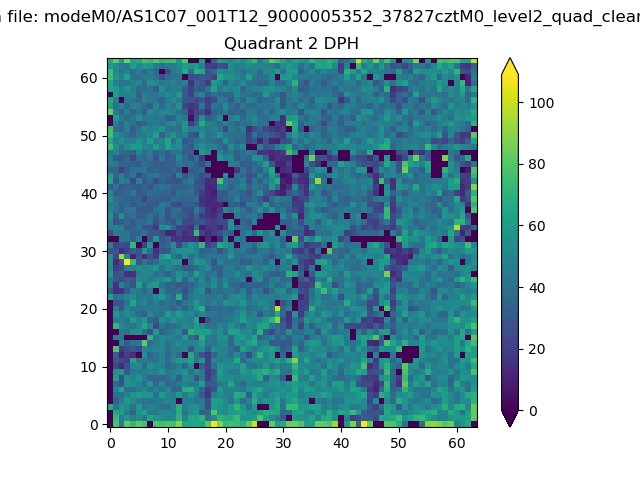 |
Quadrant C |
| Plot type | Count rate plots | Images |
|---|---|---|
| Comparison with Poisson distribution Blue bars denote a histogram of data divided into 1 sec bins. Red curve is a Poisson curve with rate = median count rate of data. |
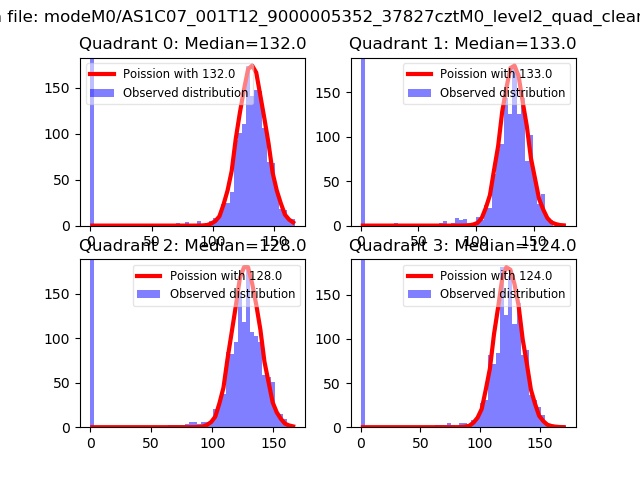 |
 |
| Quadrant-wise count rates Data is divided into 100 sec bins |
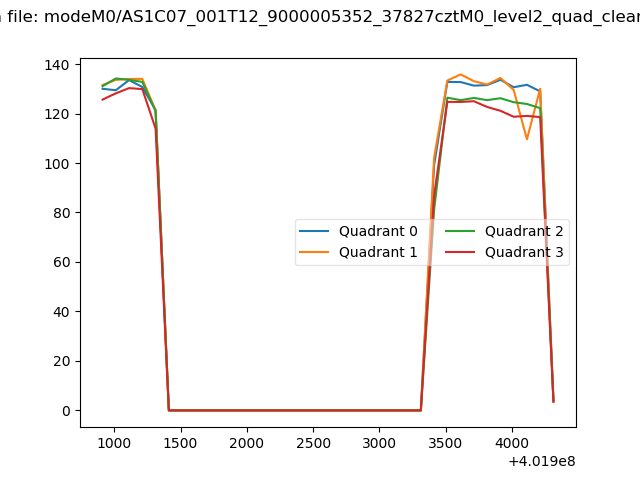 |
|
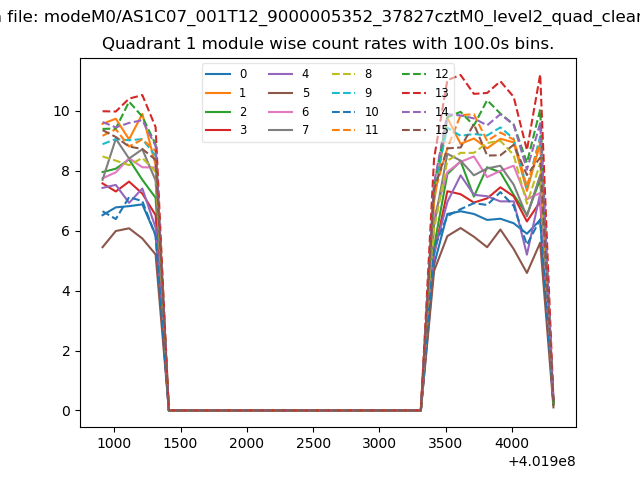
| Module-wise count rates for Quadrant A Data is divided into 100 sec bins |
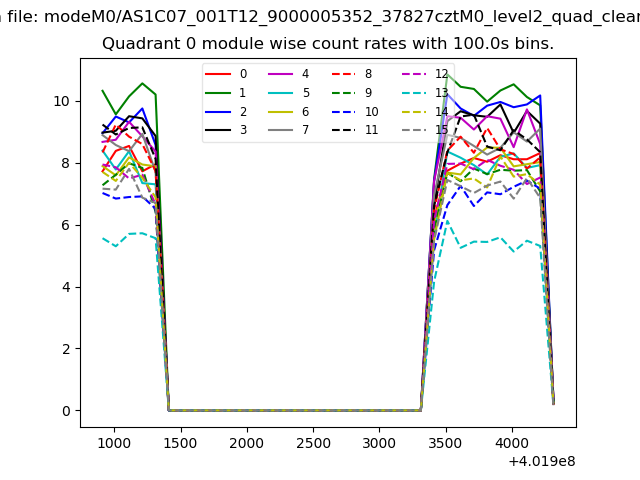 |
 |
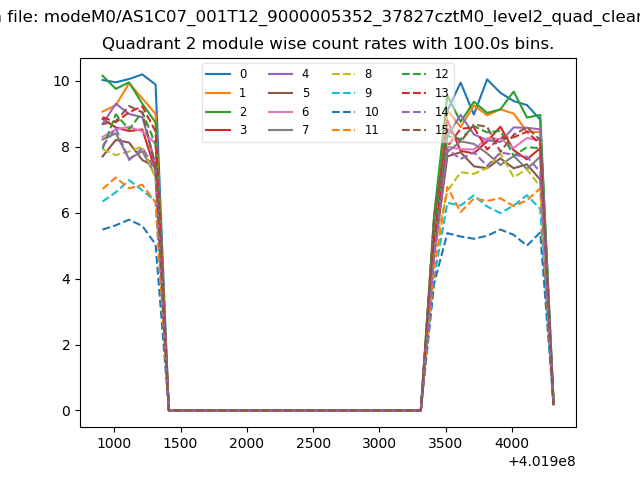
| Module-wise count rates for Quadrant B Data is divided into 100 sec bins |
 |
 |
| Module-wise count rates for Quadrant C Data is divided into 100 sec bins |
 |
 |
| Module-wise count rates for Quadrant D Data is divided into 100 sec bins |
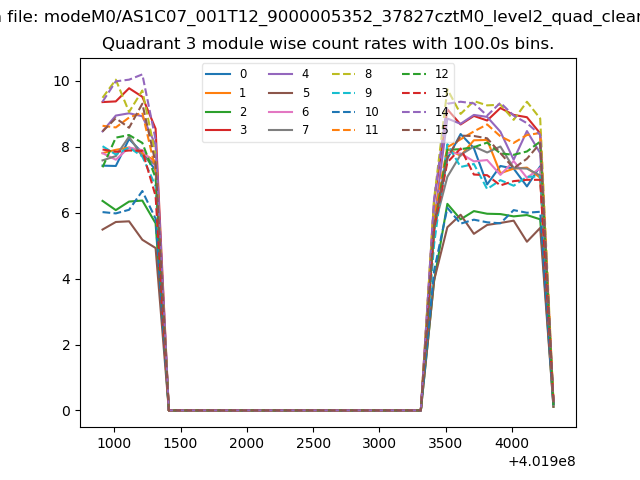 |
 |
| Parameter | Plot |
|---|---|
| CZT HV Monitor | 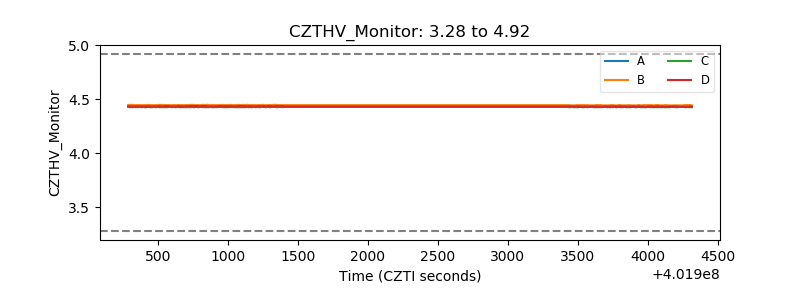 |
| D_VDD | 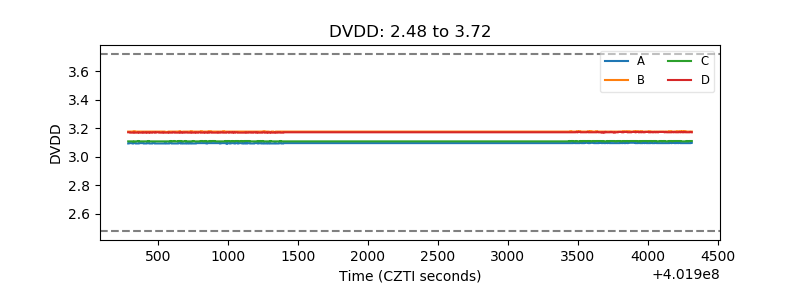 |
| Temperature 1 | 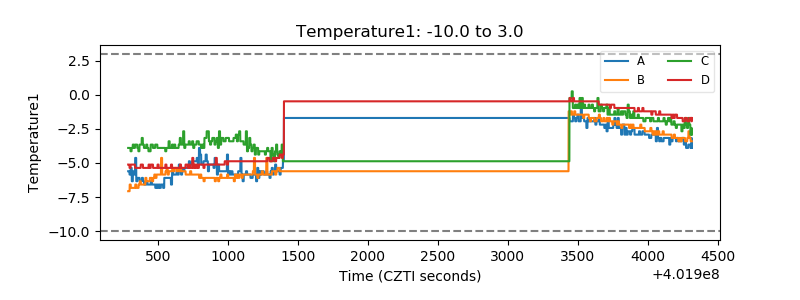 |
| Veto HV Monitor | 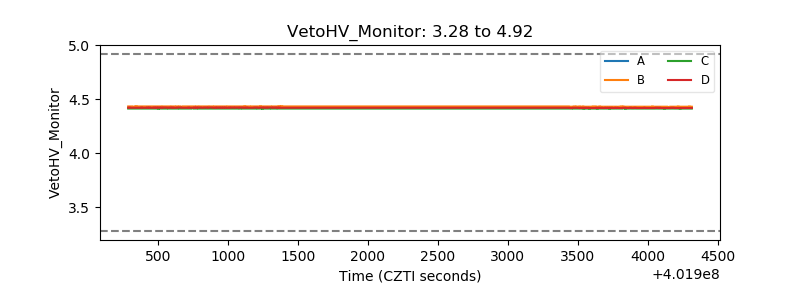 |
| Veto LLD | 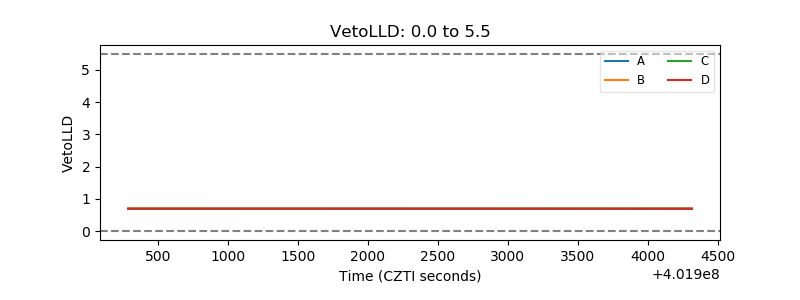 |
| Alpha Counter | 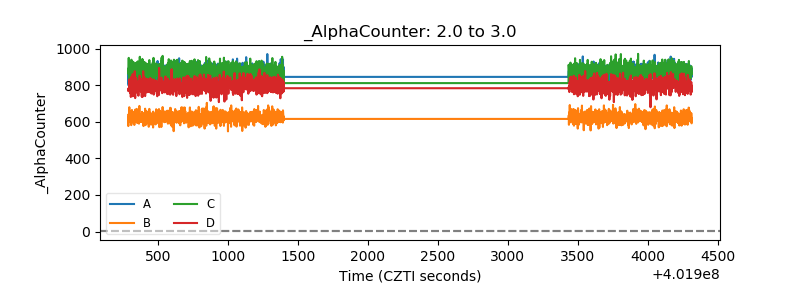 |
| _CPM_Rate | 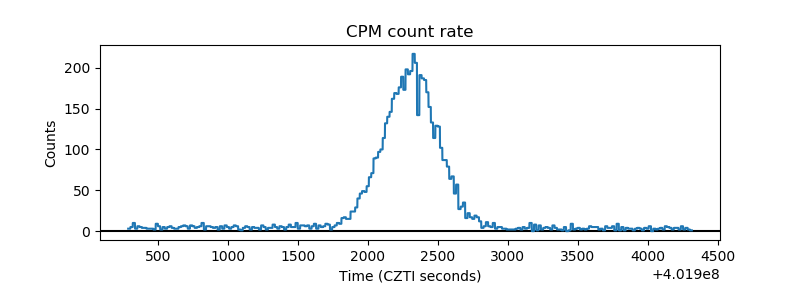 |
| CZT Counter | 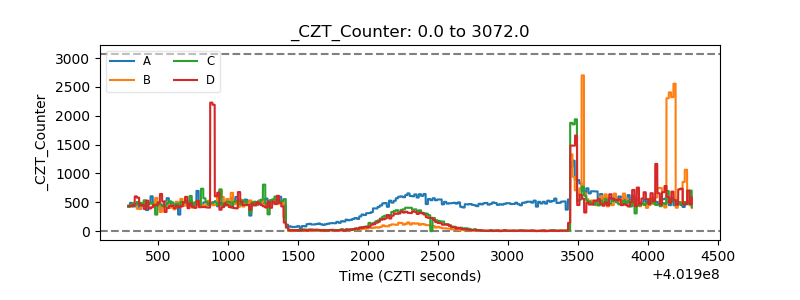 |
| +2.5 Volts monitor | 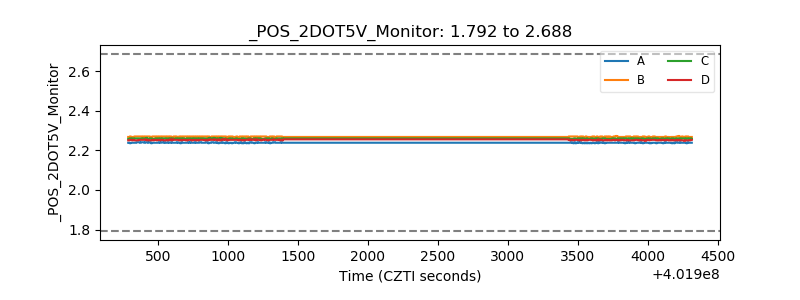 |
| +5 Volts monitor | 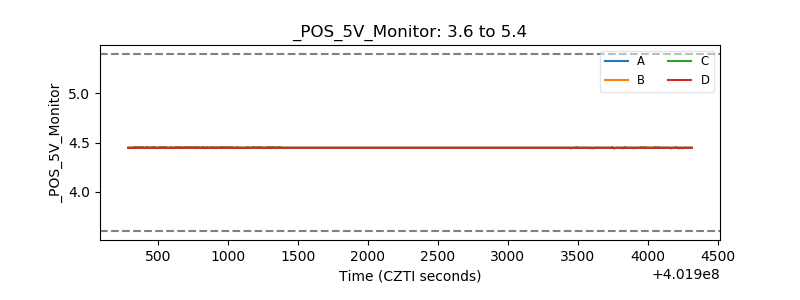 |
| _ROLL_ROT | 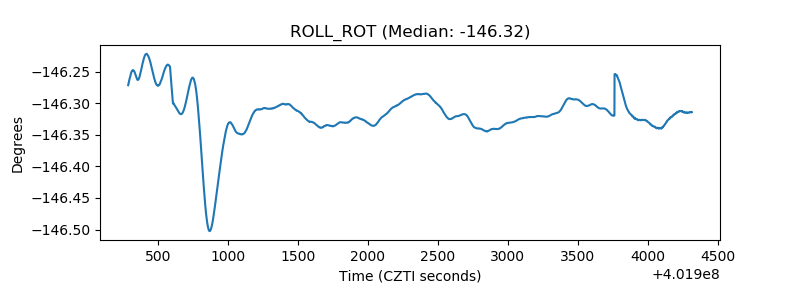 |
| _Roll_DEC | 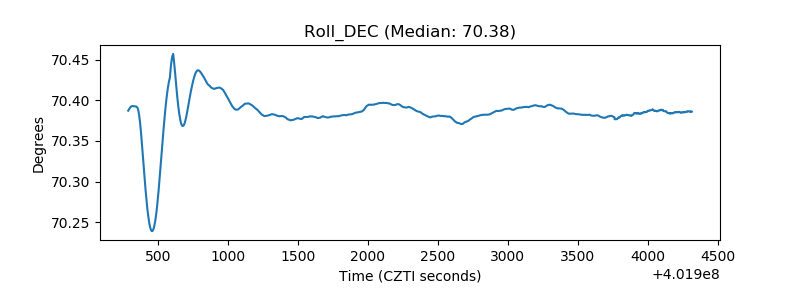 |
| _Roll_RA | 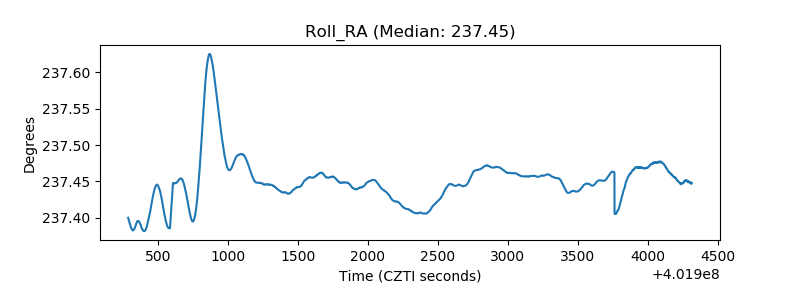 |
| Veto Counter | 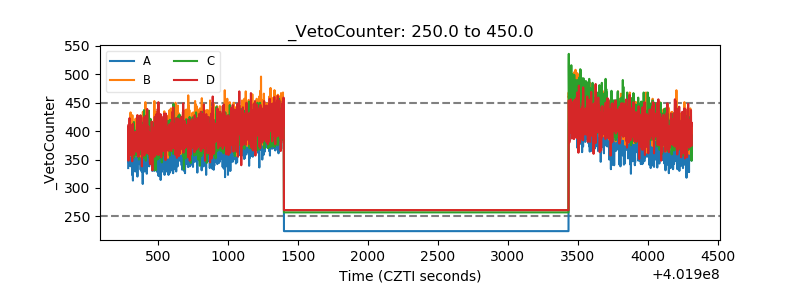 |