| Param | Original file | Final file |
|---|---|---|
| Filename | modeM0/AS1C07_001T12_9000005352_37828cztM0_level2.evt | modeM0/AS1C07_001T12_9000005352_37828cztM0_level2_quad_clean.evt |
| Size (bytes) | 394,012,800 | 79,770,240 |
| Size | 375.8 MB | 76.1 MB |
| Events in quadrant A | 2,723,597 | 523,900 |
| Events in quadrant B | 3,165,608 | 519,767 |
| Events in quadrant C | 2,683,818 | 507,944 |
| Events in quadrant D | 2,997,069 | 490,653 |
| Mode M9 | |||
|---|---|---|---|
| Quadrant | BADHDUFLAG | Total packets | Discarded packets |
| A | 0 | 20 | 0 |
| B | 0 | 20 | 0 |
| C | 0 | 20 | 0 |
| D | 0 | 21 | 0 |
| Mode M0 | |||
|---|---|---|---|
| Quadrant | BADHDUFLAG | Total packets | Discarded packets |
| A | 0 | 11376 | 3 |
| B | 0 | 12879 | 2 |
| C | 0 | 11284 | 2 |
| D | 0 | 12542 | 2 |
| Mode SS | |||
|---|---|---|---|
| Quadrant | BADHDUFLAG | Total packets | Discarded packets |
| A | 0 | 108 | 0 |
| B | 0 | 108 | 0 |
| C | 0 | 108 | 0 |
| D | 0 | 108 | 0 |
| Quadrant | Total seconds | Saturated seconds | Saturation percentage |
|---|---|---|---|
| A | 5333 | 17 | 0.318770% |
| B | 5333 | 134 | 2.512657% |
| C | 5333 | 52 | 0.975061% |
| D | 5333 | 94 | 1.762610% |
Noise dominated data is calculated using 1-second bins in cleaned event files. If a bin has >2000 counts, and if more than 50% of those come from <1% of pixels, then it is considered to be noise-dominated and hence unusable.
| Quadrant | # 1 sec bins | Bins with >0 counts | Bins with >2000 counts | High rate bins dominated by noise | Noise dominated (total time) | Noise dominated (detector-on time) | Marked lightcurve |
|---|---|---|---|---|---|---|---|
| A | 7066 | 5334 | 9 | 9 | 0.13% | 0.17% | 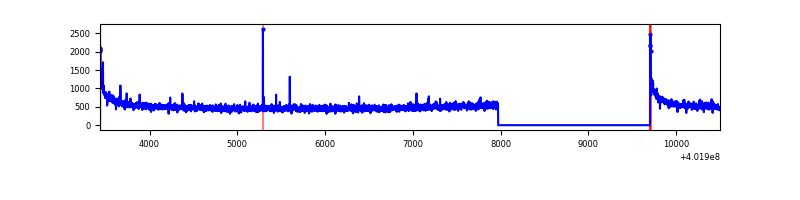 |
| B | 7065 | 5332 | 122 | 122 | 1.73% | 2.29% | 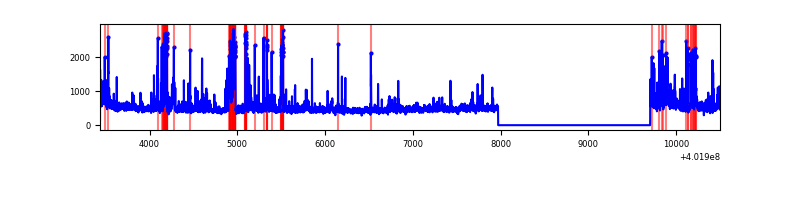 |
| C | 7066 | 5333 | 41 | 41 | 0.58% | 0.77% | 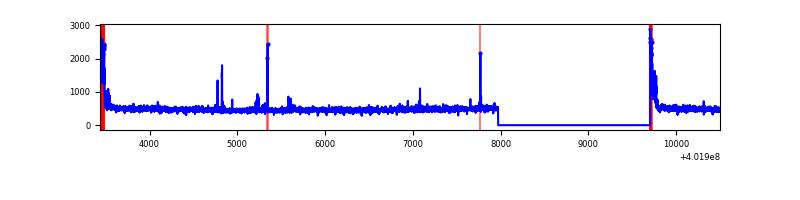 |
| D | 7065 | 5332 | 84 | 84 | 1.19% | 1.58% | 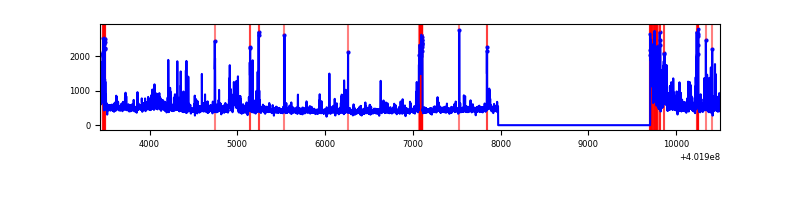 |
Top three noisy pixels from each quadrant. If the there are fewer than three noisy pixels in the level2.evt file, extra rows are filled as -1
| Pixel properties | Quadrant properties | ||||||
|---|---|---|---|---|---|---|---|
| Quadrant | DetID | PixID | Counts | Sigma | Mean | Median | Sigma |
| A | 10 | 83 | 362275 | 3009.17 | 594 | 582 | 120.2 |
| A | 12 | 189 | 22400 | 181.52 | 594 | 582 | 120.2 |
| A | 13 | 6 | 17894 | 144.03 | 594 | 582 | 120.2 |
| B | 5 | 172 | 291759 | 2599.54 | 586 | 571 | 112.0 |
| B | 4 | 171 | 232651 | 2071.86 | 586 | 571 | 112.0 |
| B | 0 | 229 | 126602 | 1125.13 | 586 | 571 | 112.0 |
| C | 15 | 214 | 224975 | 1659.38 | 579 | 583 | 135.2 |
| C | 0 | 10 | 167395 | 1233.58 | 579 | 583 | 135.2 |
| C | 14 | 254 | 21466 | 154.43 | 579 | 583 | 135.2 |
| D | 12 | 233 | 279871 | 1962.06 | 579 | 564 | 142.4 |
| D | 13 | 249 | 116588 | 815.04 | 579 | 564 | 142.4 |
| D | 2 | 249 | 98324 | 686.74 | 579 | 564 | 142.4 |
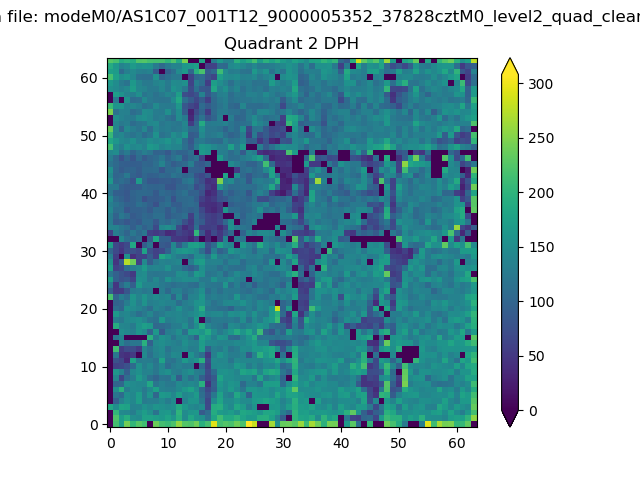
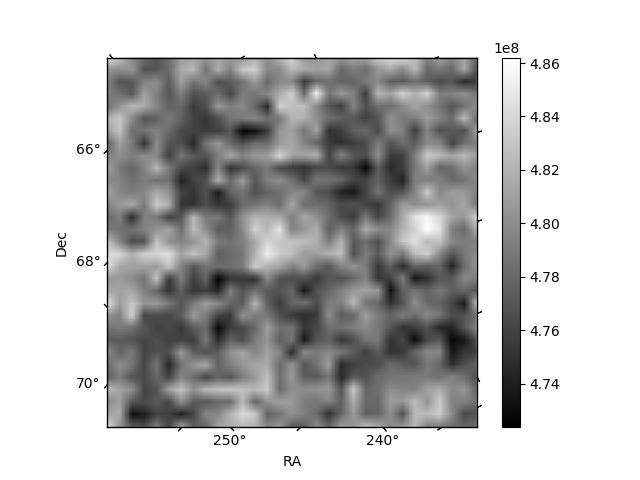
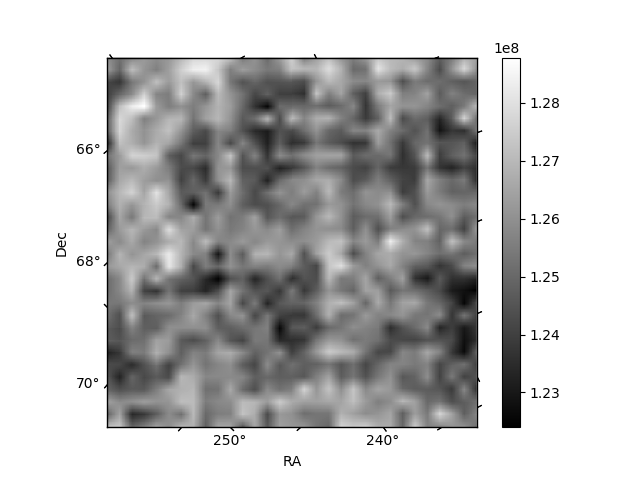
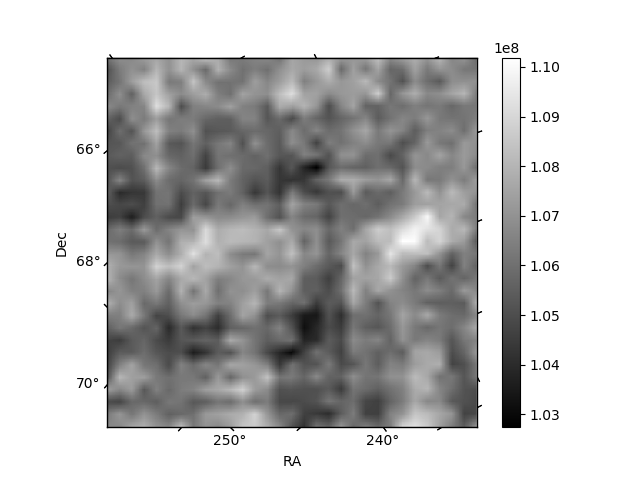
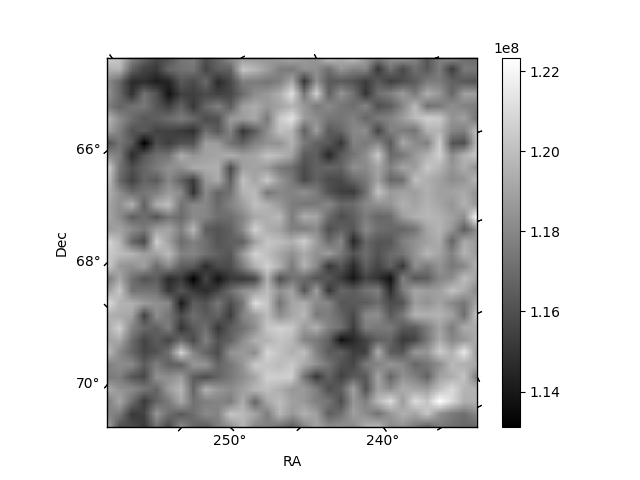
Histogram calculated using DETX and DETY for each event in the final _common_clean file
| Quadrant A | 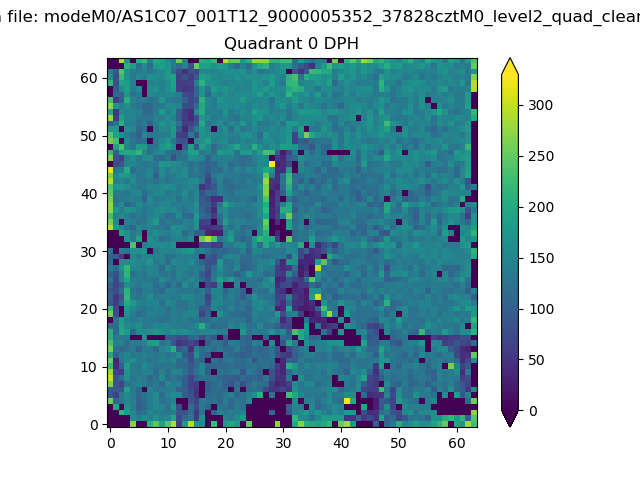 |
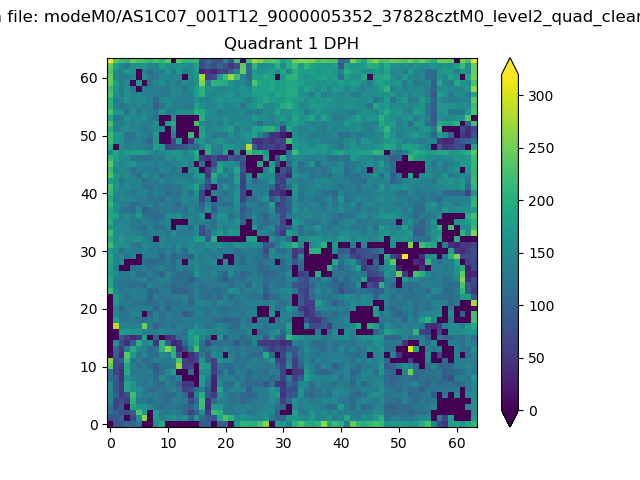 |
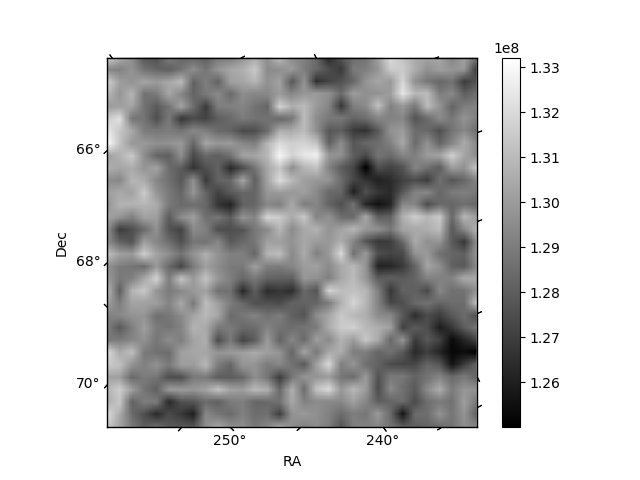
Quadrant B |
|---|---|---|---|
| Quadrant D | 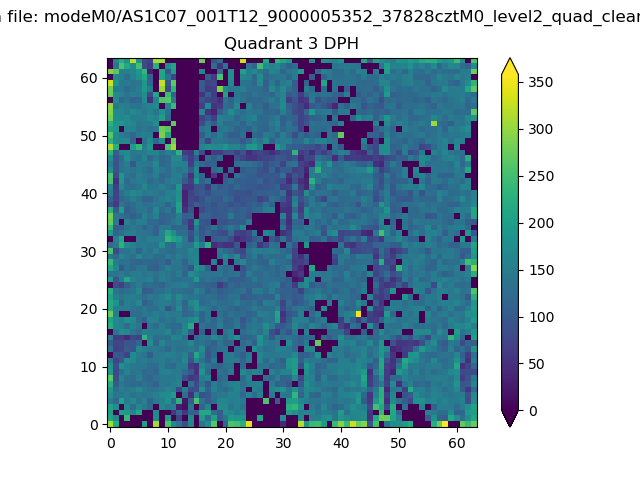 |
 |
Quadrant C |
| Plot type | Count rate plots | Images |
|---|---|---|
| Comparison with Poisson distribution Blue bars denote a histogram of data divided into 1 sec bins. Red curve is a Poisson curve with rate = median count rate of data. |
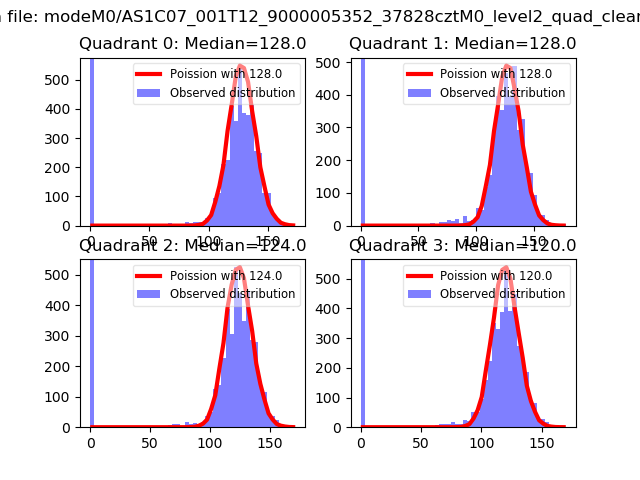 |
 |
| Quadrant-wise count rates Data is divided into 100 sec bins |
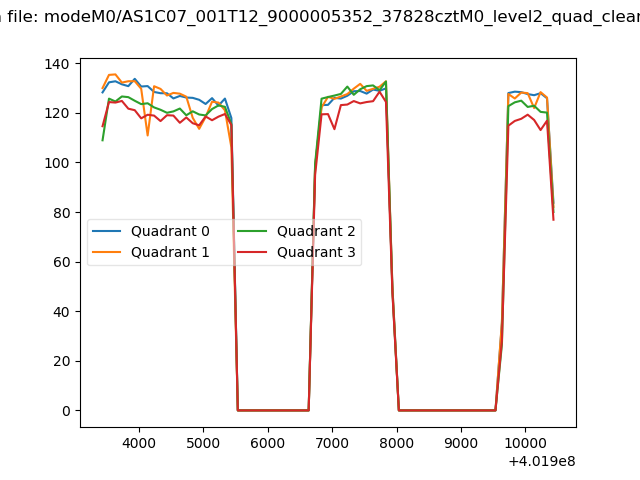 |
|
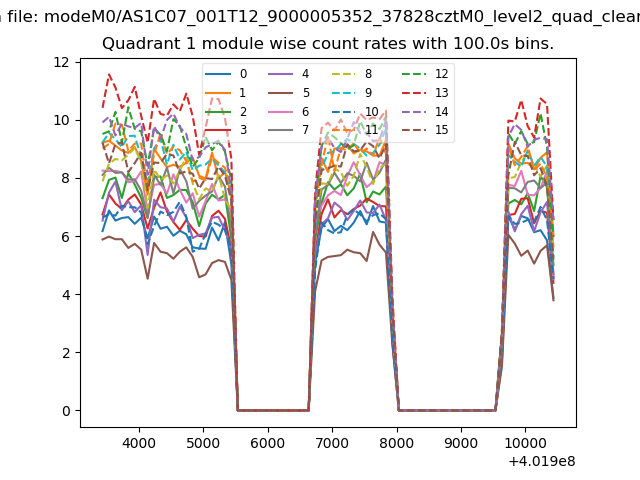
| Module-wise count rates for Quadrant A Data is divided into 100 sec bins |
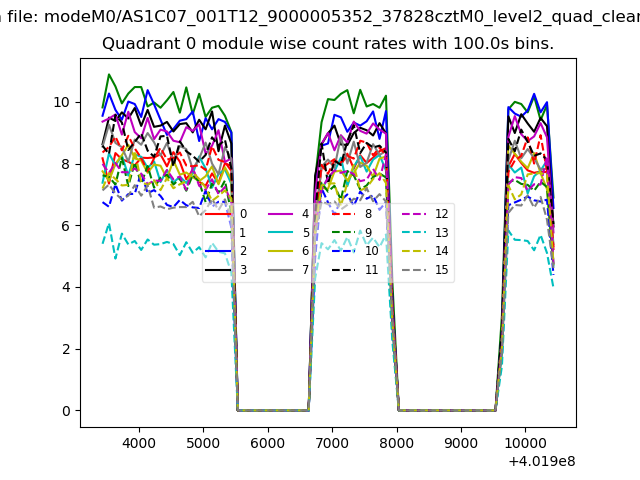 |
 |
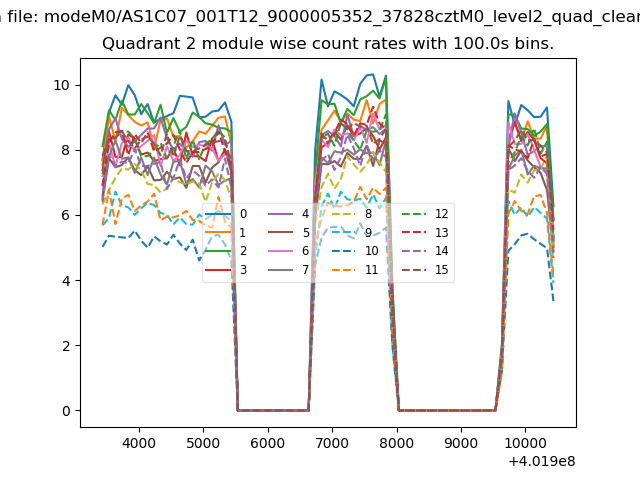
| Module-wise count rates for Quadrant B Data is divided into 100 sec bins |
 |
 |
| Module-wise count rates for Quadrant C Data is divided into 100 sec bins |
 |
 |
| Module-wise count rates for Quadrant D Data is divided into 100 sec bins |
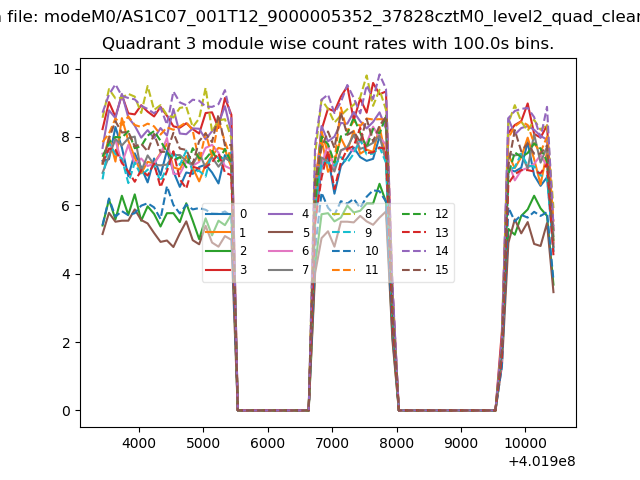 |
 |
| Parameter | Plot |
|---|---|
| CZT HV Monitor | 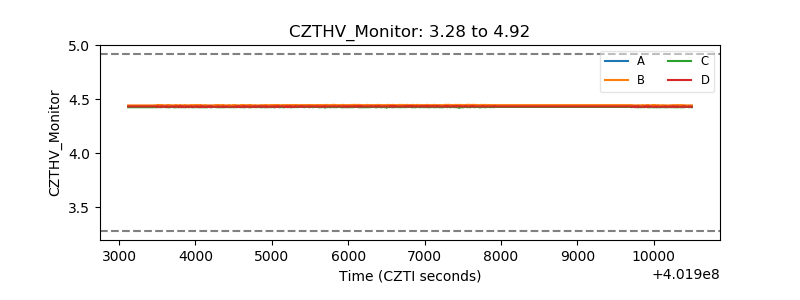 |
| D_VDD | 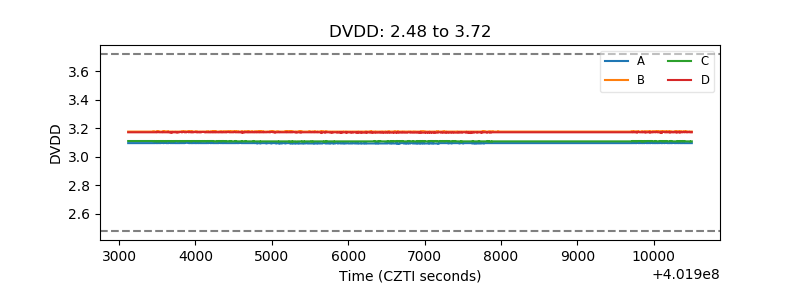 |
| Temperature 1 | 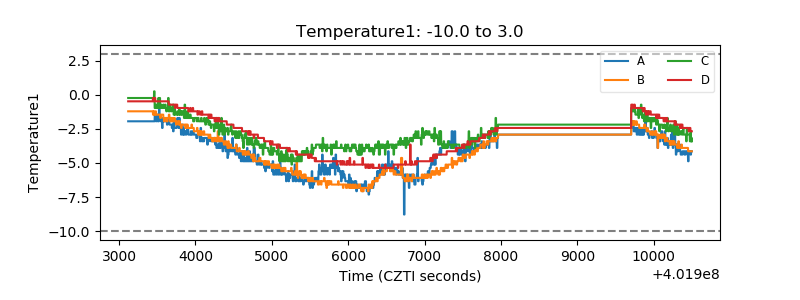 |
| Veto HV Monitor | 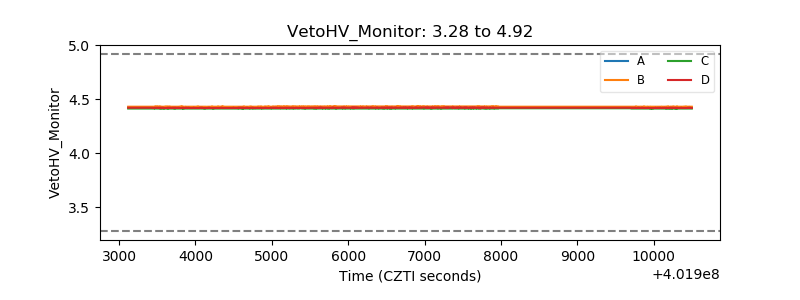 |
| Veto LLD | 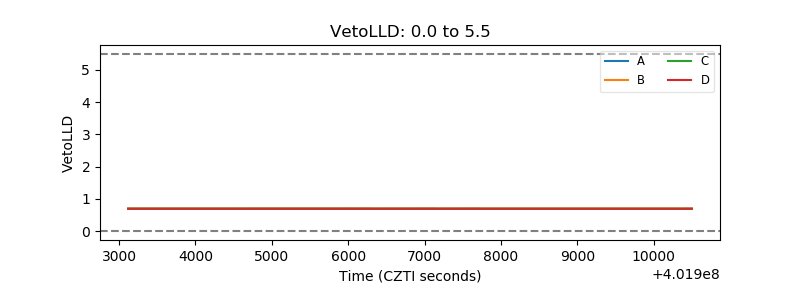 |
| Alpha Counter | 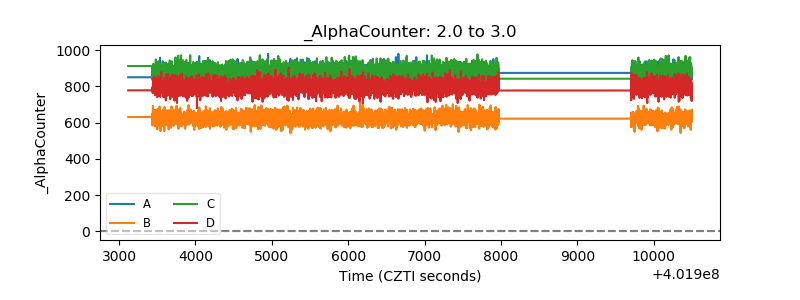 |
| _CPM_Rate | 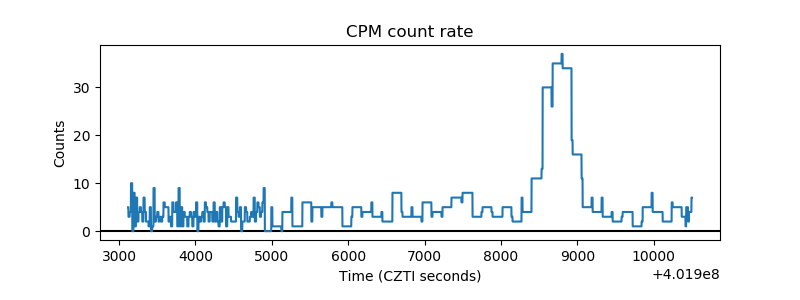 |
| CZT Counter | 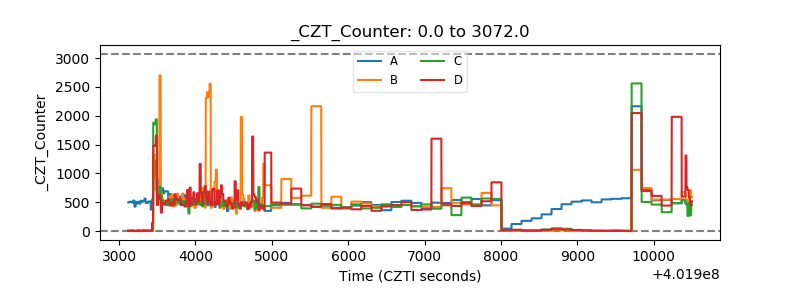 |
| +2.5 Volts monitor | 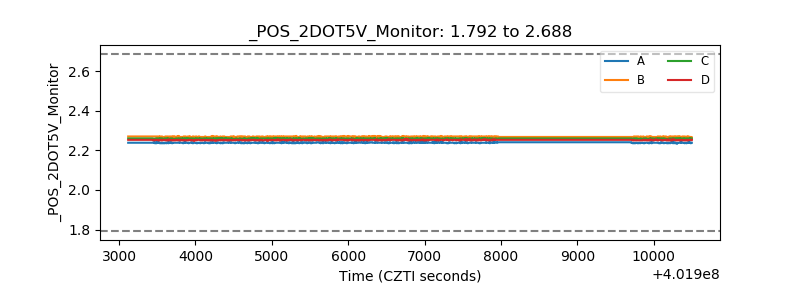 |
| +5 Volts monitor | 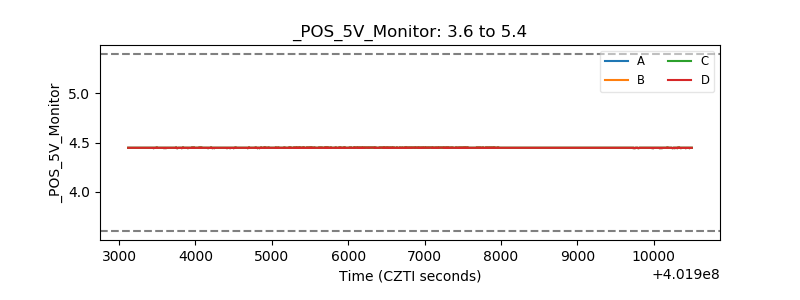 |
| _ROLL_ROT | 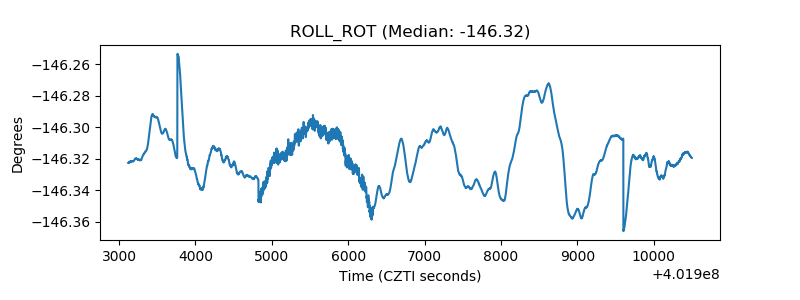 |
| _Roll_DEC | 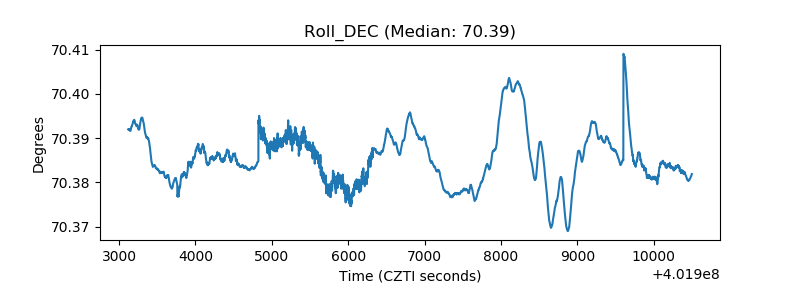 |
| _Roll_RA | 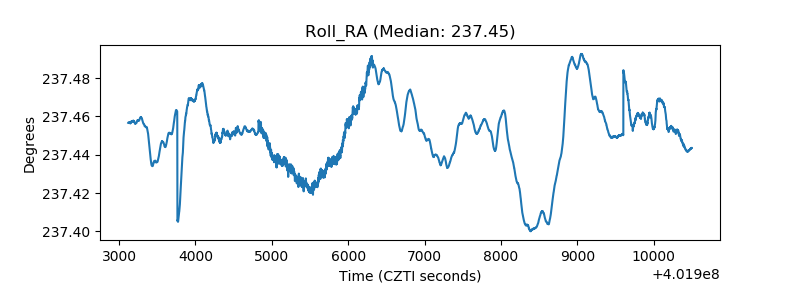 |
| Veto Counter | 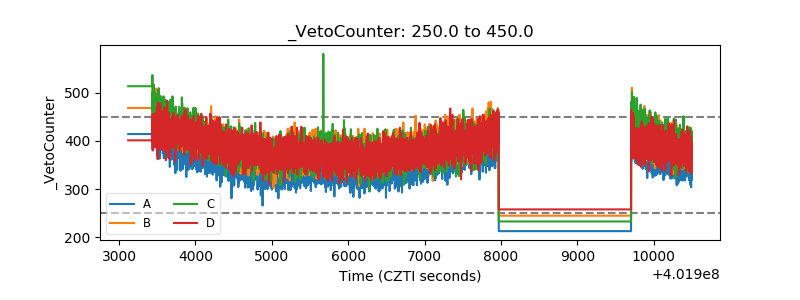 |