| Param | Original file | Final file |
|---|---|---|
| Filename | modeM0/AS1C07_001T12_9000005352_37829cztM0_level2.evt | modeM0/AS1C07_001T12_9000005352_37829cztM0_level2_quad_clean.evt |
| Size (bytes) | 427,080,960 | 84,107,520 |
| Size | 407.3 MB | 80.2 MB |
| Events in quadrant A | 2,910,078 | 549,781 |
| Events in quadrant B | 3,236,201 | 549,414 |
| Events in quadrant C | 2,958,807 | 537,216 |
| Events in quadrant D | 3,446,233 | 516,539 |
| Mode M9 | |||
|---|---|---|---|
| Quadrant | BADHDUFLAG | Total packets | Discarded packets |
| A | 0 | 19 | 0 |
| B | 0 | 19 | 0 |
| C | 0 | 19 | 0 |
| D | 0 | 20 | 0 |
| Mode M0 | |||
|---|---|---|---|
| Quadrant | BADHDUFLAG | Total packets | Discarded packets |
| A | 0 | 12172 | 3 |
| B | 0 | 13376 | 2 |
| C | 0 | 12305 | 2 |
| D | 0 | 14143 | 2 |
| Mode SS | |||
|---|---|---|---|
| Quadrant | BADHDUFLAG | Total packets | Discarded packets |
| A | 0 | 116 | 0 |
| B | 0 | 116 | 0 |
| C | 0 | 116 | 0 |
| D | 0 | 116 | 0 |
| Quadrant | Total seconds | Saturated seconds | Saturation percentage |
|---|---|---|---|
| A | 5629 | 17 | 0.302007% |
| B | 5629 | 105 | 1.865340% |
| C | 5629 | 72 | 1.279090% |
| D | 5629 | 150 | 2.664772% |
Noise dominated data is calculated using 1-second bins in cleaned event files. If a bin has >2000 counts, and if more than 50% of those come from <1% of pixels, then it is considered to be noise-dominated and hence unusable.
| Quadrant | # 1 sec bins | Bins with >0 counts | Bins with >2000 counts | High rate bins dominated by noise | Noise dominated (total time) | Noise dominated (detector-on time) | Marked lightcurve |
|---|---|---|---|---|---|---|---|
| A | 7061 | 5630 | 14 | 14 | 0.20% | 0.25% | 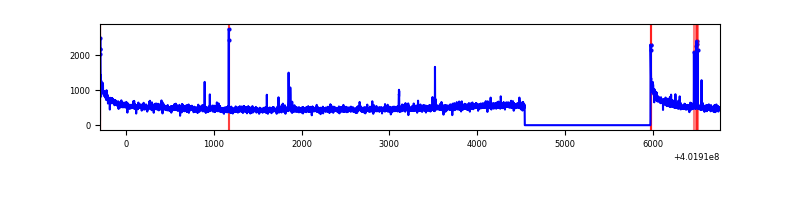 |
| B | 7060 | 5628 | 89 | 89 | 1.26% | 1.58% | 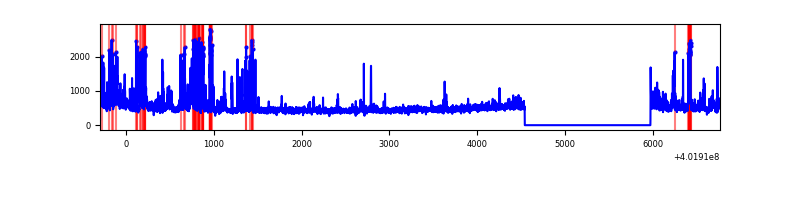 |
| C | 7060 | 5628 | 71 | 71 | 1.01% | 1.26% | 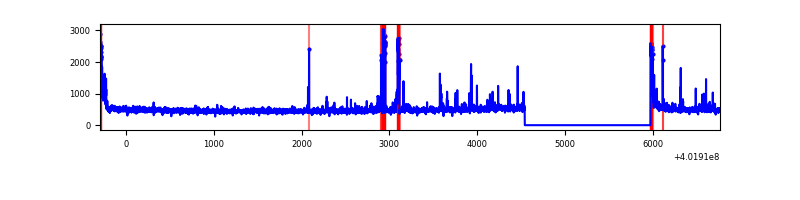 |
| D | 7060 | 5628 | 154 | 154 | 2.18% | 2.74% | 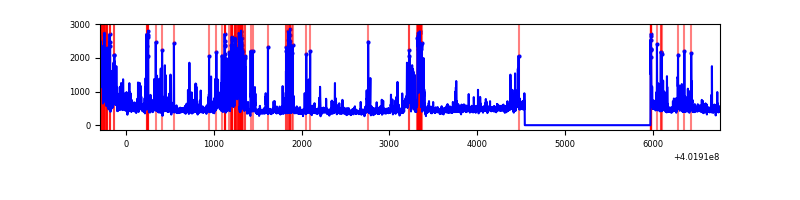 |
Top three noisy pixels from each quadrant. If the there are fewer than three noisy pixels in the level2.evt file, extra rows are filled as -1
| Pixel properties | Quadrant properties | ||||||
|---|---|---|---|---|---|---|---|
| Quadrant | DetID | PixID | Counts | Sigma | Mean | Median | Sigma |
| A | 10 | 83 | 371996 | 2960.57 | 624 | 612 | 125.4 |
| A | 7 | 3 | 27864 | 217.25 | 624 | 612 | 125.4 |
| A | 13 | 6 | 27027 | 210.57 | 624 | 612 | 125.4 |
| B | 5 | 172 | 344232 | 2914.26 | 618 | 603 | 117.9 |
| B | 4 | 171 | 146851 | 1240.31 | 618 | 603 | 117.9 |
| B | 0 | 189 | 115140 | 971.37 | 618 | 603 | 117.9 |
| C | 15 | 214 | 235794 | 1673.39 | 605 | 609 | 140.5 |
| C | 1 | 23 | 196469 | 1393.58 | 605 | 609 | 140.5 |
| C | 0 | 10 | 139801 | 990.38 | 605 | 609 | 140.5 |
| D | 2 | 249 | 435921 | 2953.2 | 606 | 589 | 147.4 |
| D | 12 | 233 | 256675 | 1737.23 | 606 | 589 | 147.4 |
| D | 13 | 249 | 168988 | 1142.38 | 606 | 589 | 147.4 |
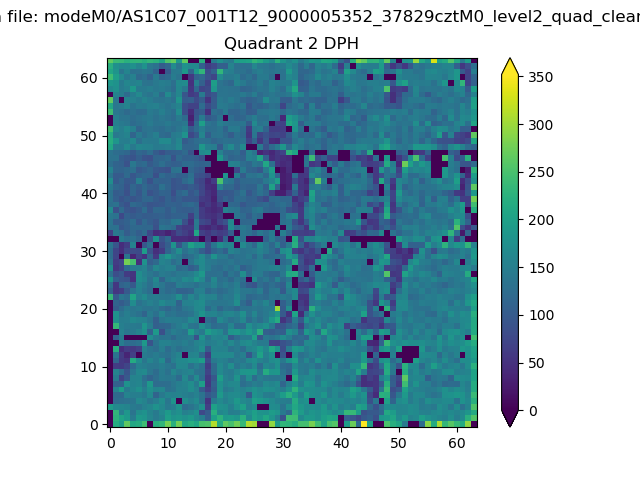
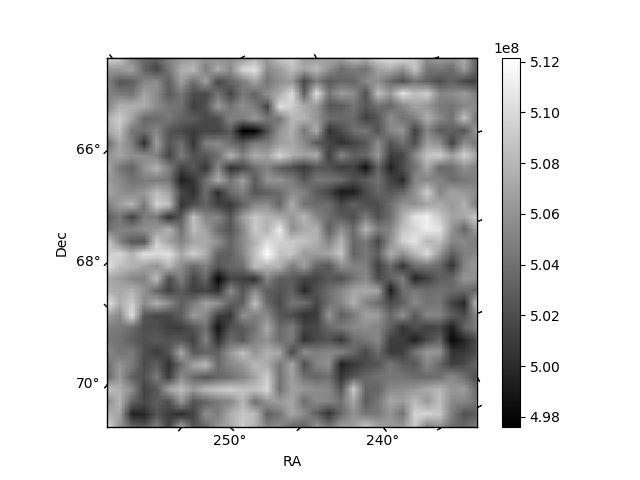
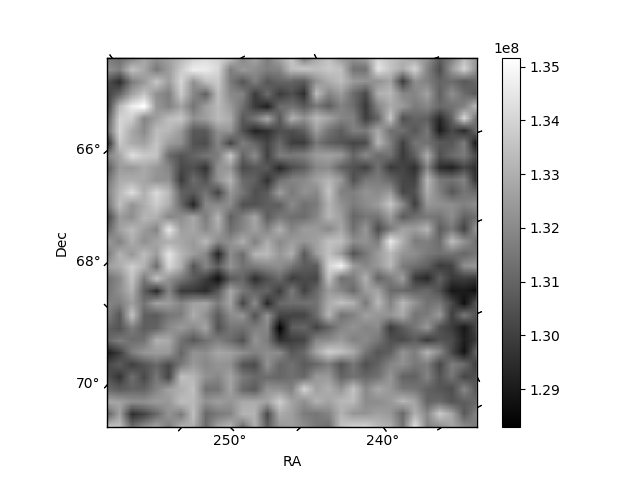
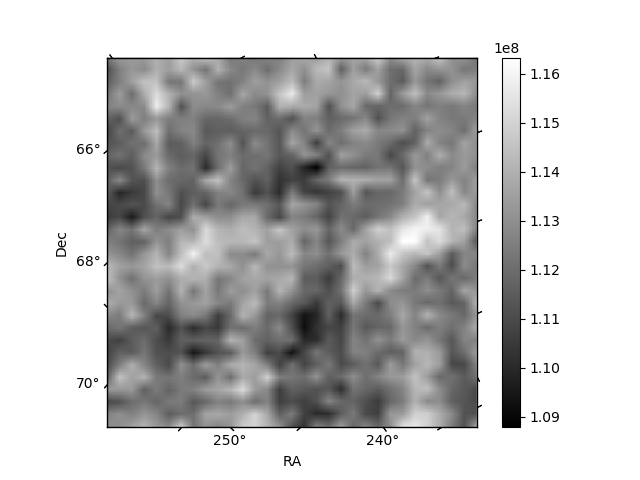
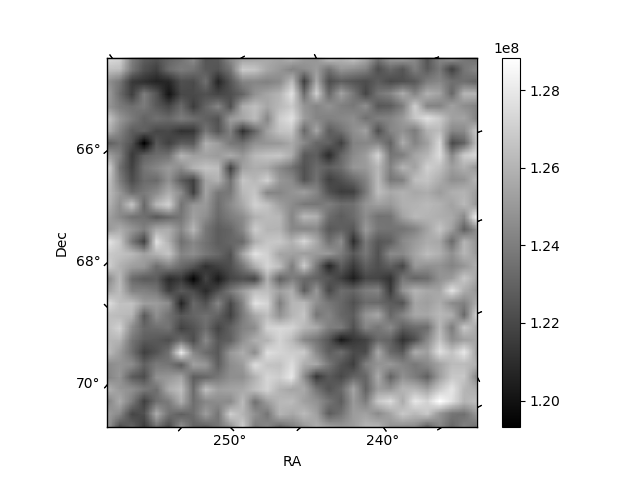
Histogram calculated using DETX and DETY for each event in the final _common_clean file
| Quadrant A | 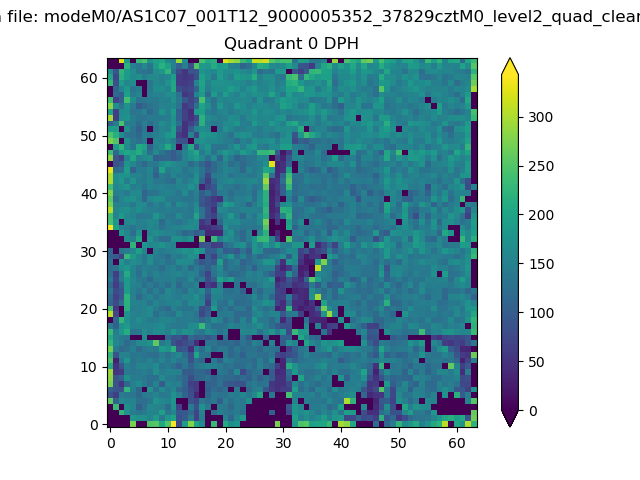 |
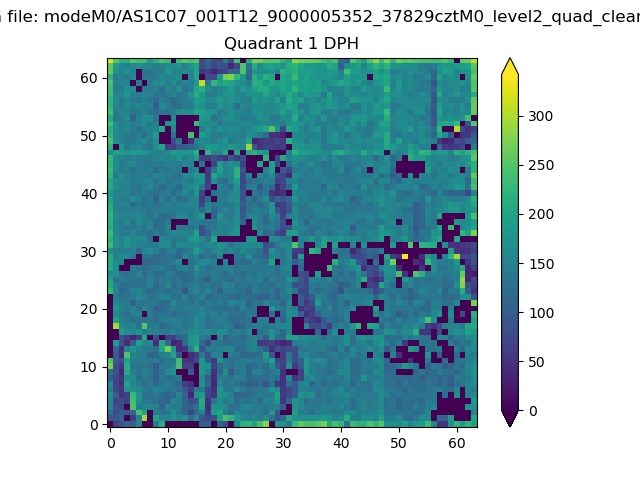 |
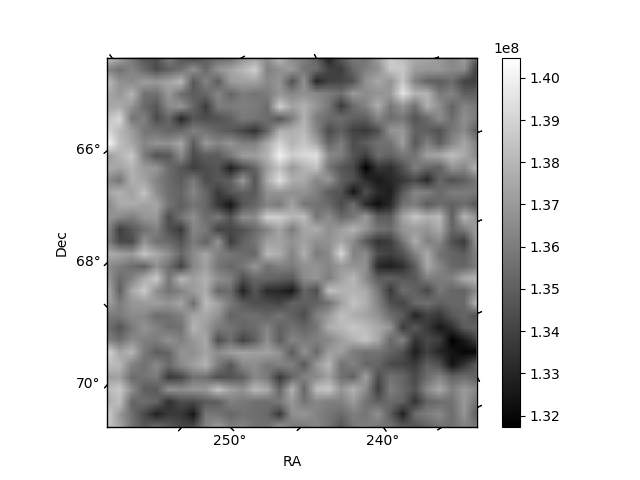
Quadrant B |
|---|---|---|---|
| Quadrant D | 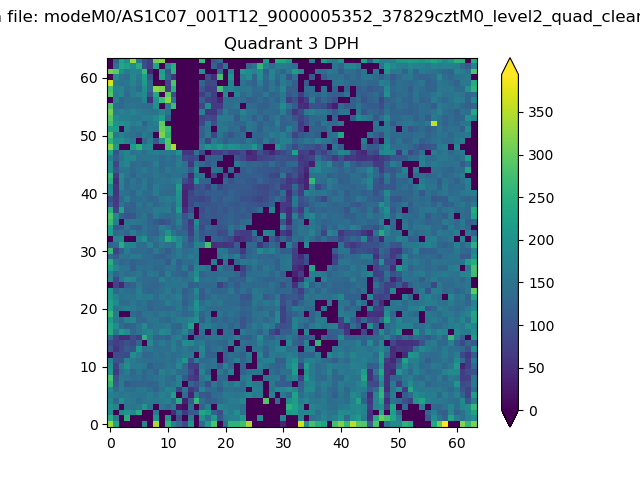 |
 |
Quadrant C |
| Plot type | Count rate plots | Images |
|---|---|---|
| Comparison with Poisson distribution Blue bars denote a histogram of data divided into 1 sec bins. Red curve is a Poisson curve with rate = median count rate of data. |
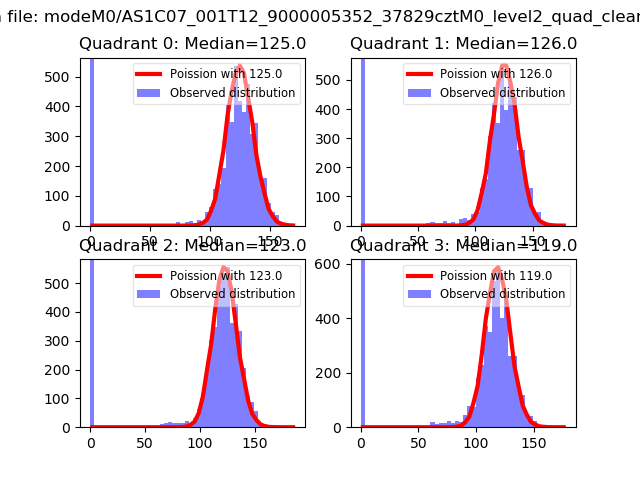 |
 |
| Quadrant-wise count rates Data is divided into 100 sec bins |
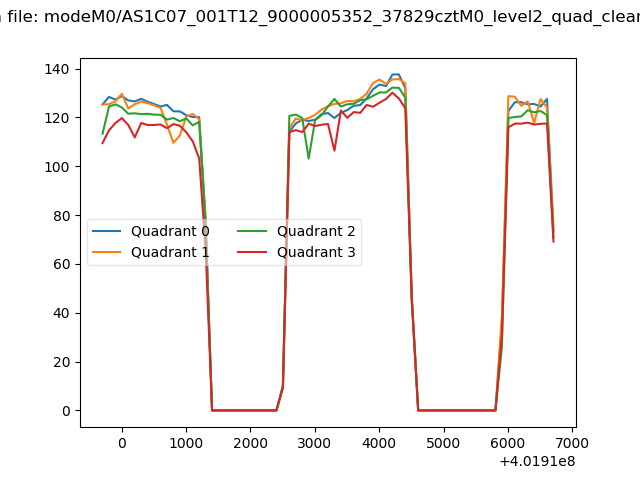 |
|
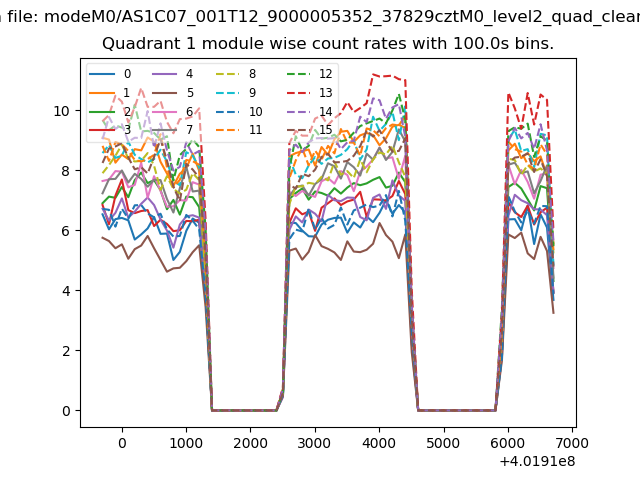
| Module-wise count rates for Quadrant A Data is divided into 100 sec bins |
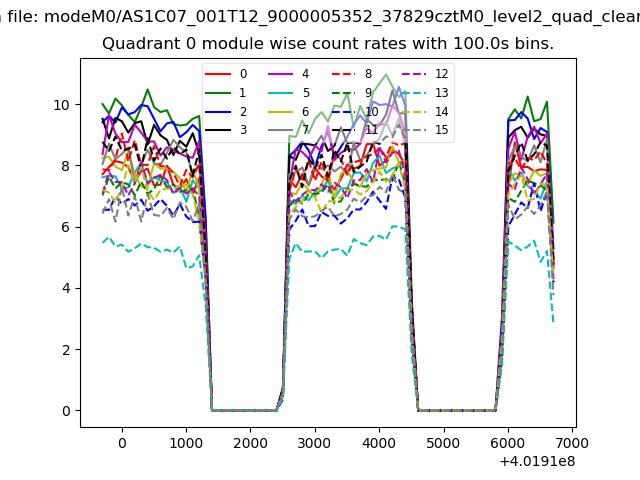 |
 |
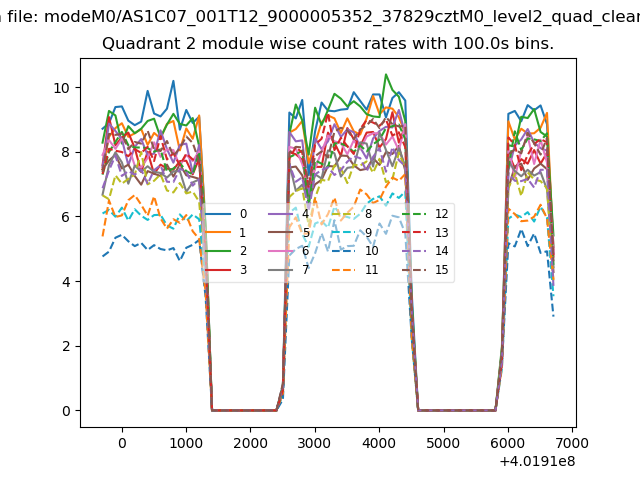
| Module-wise count rates for Quadrant B Data is divided into 100 sec bins |
 |
 |
| Module-wise count rates for Quadrant C Data is divided into 100 sec bins |
 |
 |
| Module-wise count rates for Quadrant D Data is divided into 100 sec bins |
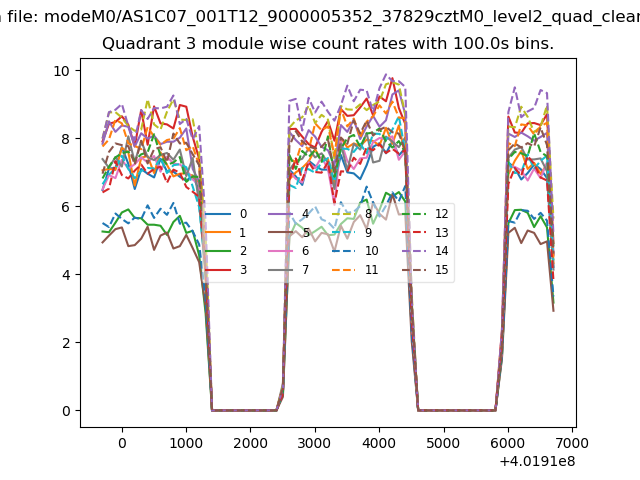 |
 |
| Parameter | Plot |
|---|---|
| CZT HV Monitor | 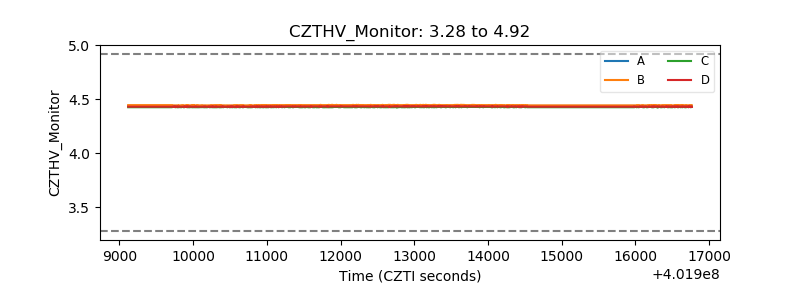 |
| D_VDD | 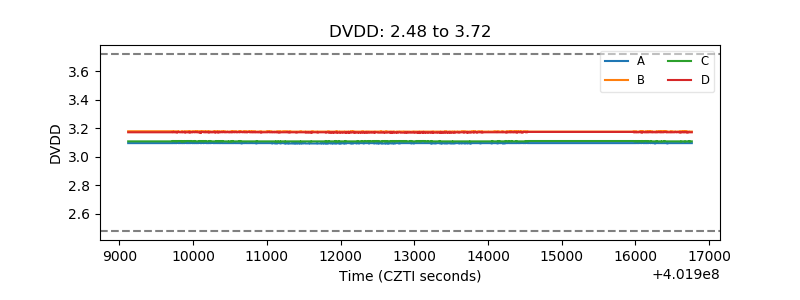 |
| Temperature 1 | 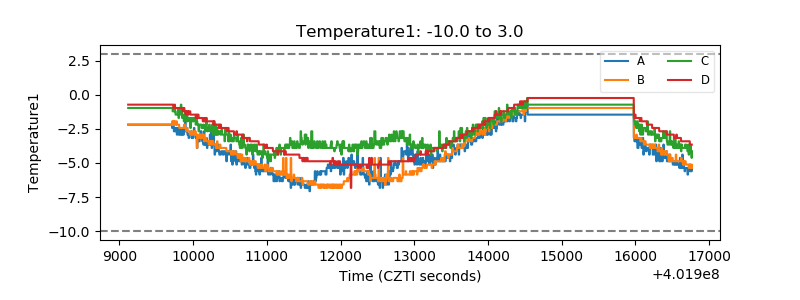 |
| Veto HV Monitor | 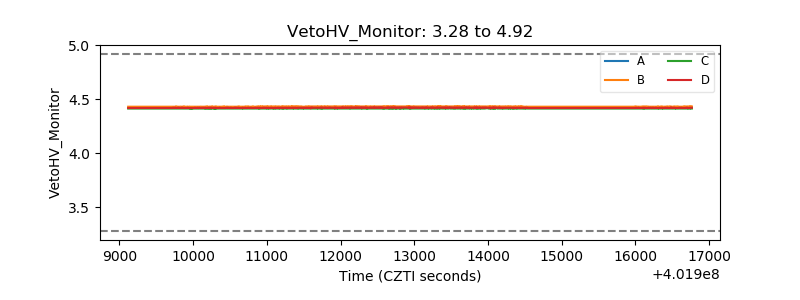 |
| Veto LLD | 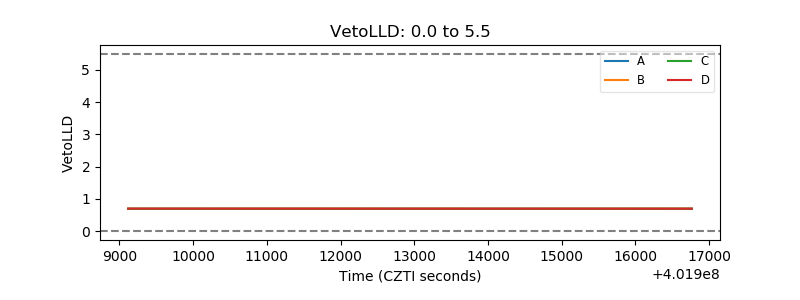 |
| Alpha Counter | 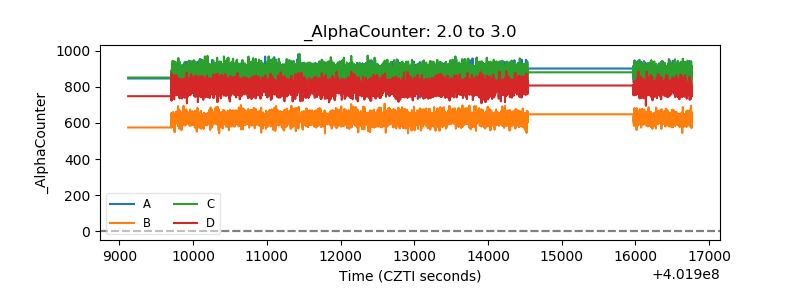 |
| _CPM_Rate |  |
| CZT Counter | 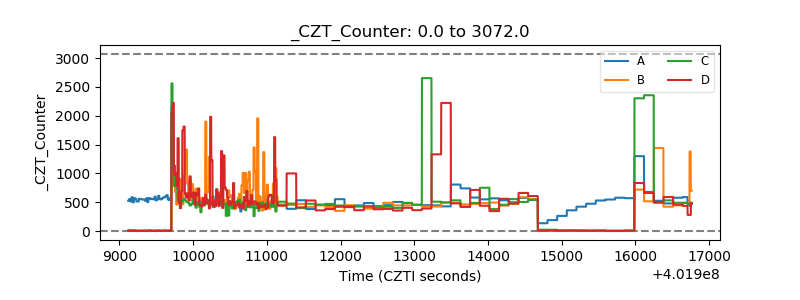 |
| +2.5 Volts monitor | 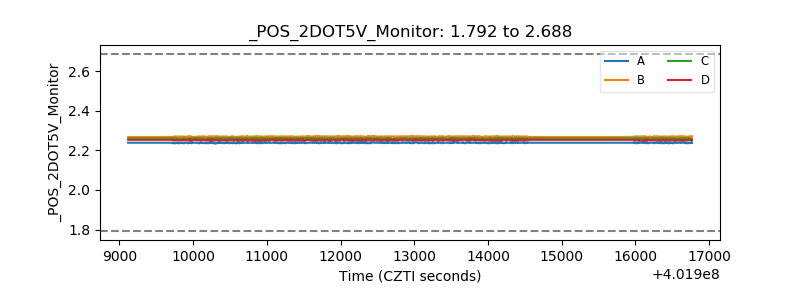 |
| +5 Volts monitor | 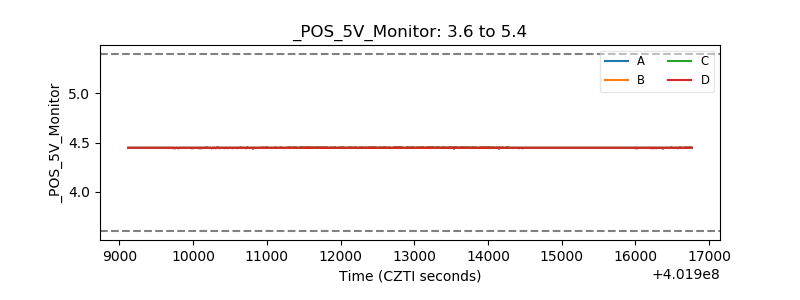 |
| _ROLL_ROT | 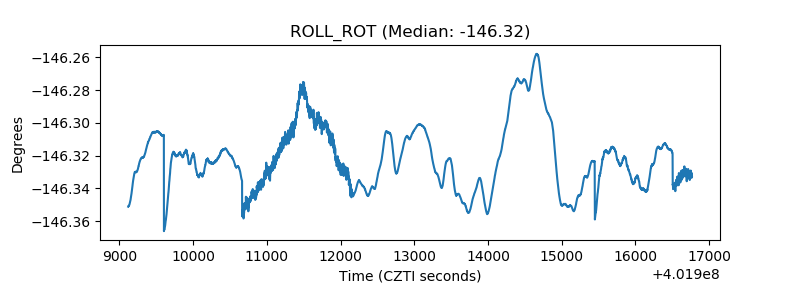 |
| _Roll_DEC |  |
| _Roll_RA | 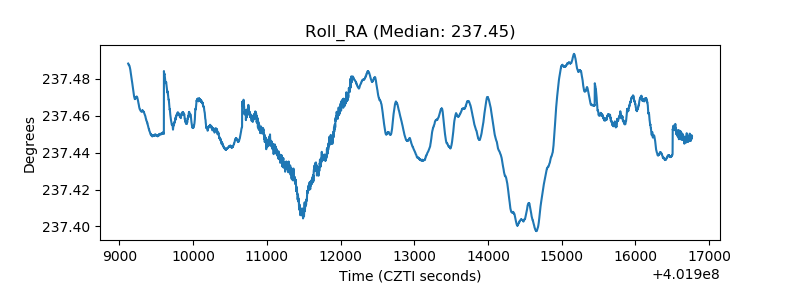 |
| Veto Counter | 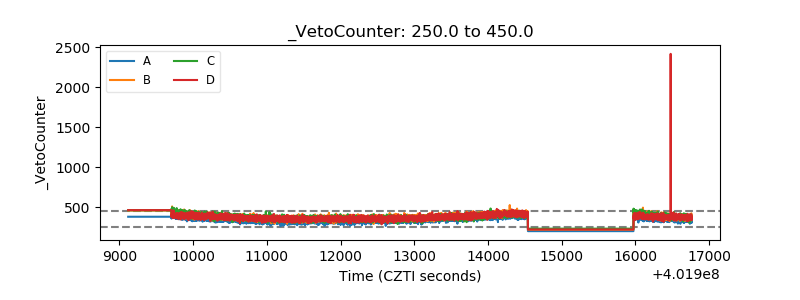 |