| Param | Original file | Final file |
|---|---|---|
| Filename | modeM0/AS1C07_001T12_9000005352_37830cztM0_level2.evt | modeM0/AS1C07_001T12_9000005352_37830cztM0_level2_quad_clean.evt |
| Size (bytes) | 424,054,080 | 86,728,320 |
| Size | 404.4 MB | 82.7 MB |
| Events in quadrant A | 2,988,439 | 562,733 |
| Events in quadrant B | 3,390,934 | 564,618 |
| Events in quadrant C | 2,959,448 | 552,200 |
| Events in quadrant D | 3,102,917 | 534,897 |
| Mode M9 | |||
|---|---|---|---|
| Quadrant | BADHDUFLAG | Total packets | Discarded packets |
| A | 0 | 21 | 0 |
| B | 0 | 21 | 0 |
| C | 0 | 21 | 0 |
| D | 0 | 22 | 0 |
| Mode M0 | |||
|---|---|---|---|
| Quadrant | BADHDUFLAG | Total packets | Discarded packets |
| A | 0 | 12656 | 3 |
| B | 0 | 14001 | 2 |
| C | 0 | 12500 | 2 |
| D | 0 | 13371 | 2 |
| Mode SS | |||
|---|---|---|---|
| Quadrant | BADHDUFLAG | Total packets | Discarded packets |
| A | 0 | 120 | 0 |
| B | 0 | 120 | 0 |
| C | 0 | 120 | 0 |
| D | 0 | 120 | 0 |
| Quadrant | Total seconds | Saturated seconds | Saturation percentage |
|---|---|---|---|
| A | 5895 | 19 | 0.322307% |
| B | 5895 | 112 | 1.899915% |
| C | 5895 | 46 | 0.780322% |
| D | 5895 | 68 | 1.153520% |
Noise dominated data is calculated using 1-second bins in cleaned event files. If a bin has >2000 counts, and if more than 50% of those come from <1% of pixels, then it is considered to be noise-dominated and hence unusable.
| Quadrant | # 1 sec bins | Bins with >0 counts | Bins with >2000 counts | High rate bins dominated by noise | Noise dominated (total time) | Noise dominated (detector-on time) | Marked lightcurve |
|---|---|---|---|---|---|---|---|
| A | 7208 | 5896 | 13 | 13 | 0.18% | 0.22% | 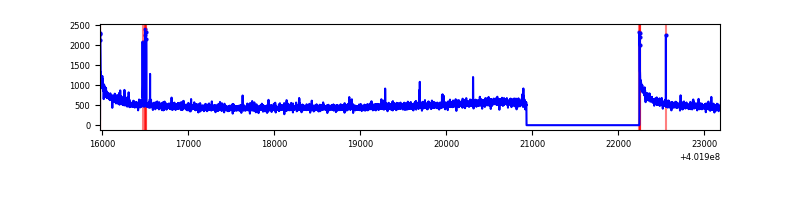 |
| B | 7207 | 5894 | 70 | 70 | 0.97% | 1.19% | 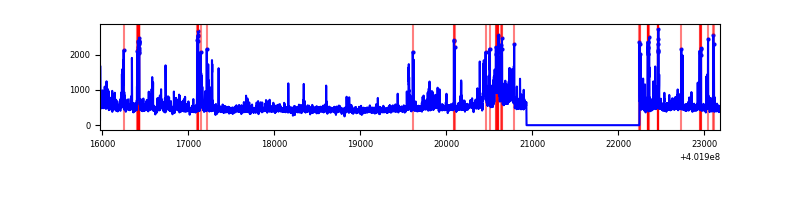 |
| C | 7207 | 5894 | 40 | 40 | 0.56% | 0.68% | 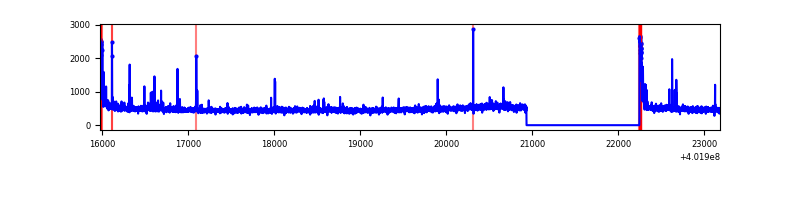 |
| D | 7207 | 5894 | 62 | 62 | 0.86% | 1.05% | 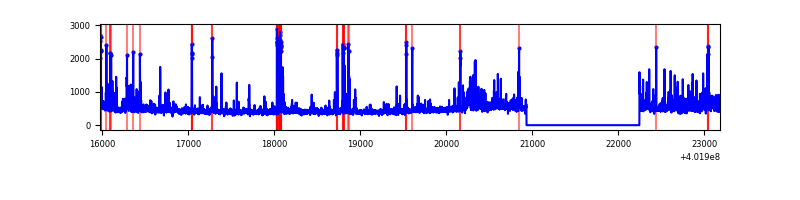 |
Top three noisy pixels from each quadrant. If the there are fewer than three noisy pixels in the level2.evt file, extra rows are filled as -1
| Pixel properties | Quadrant properties | ||||||
|---|---|---|---|---|---|---|---|
| Quadrant | DetID | PixID | Counts | Sigma | Mean | Median | Sigma |
| A | 10 | 83 | 371888 | 2793.41 | 656 | 644 | 132.9 |
| A | 7 | 3 | 26796 | 196.78 | 656 | 644 | 132.9 |
| A | 13 | 6 | 19296 | 140.35 | 656 | 644 | 132.9 |
| B | 5 | 172 | 305617 | 2464.13 | 649 | 632 | 123.8 |
| B | 0 | 189 | 216400 | 1743.3 | 649 | 632 | 123.8 |
| B | 0 | 229 | 86434 | 693.24 | 649 | 632 | 123.8 |
| C | 15 | 214 | 248183 | 1671.45 | 636 | 639 | 148.1 |
| C | 0 | 10 | 145858 | 980.54 | 636 | 639 | 148.1 |
| C | 1 | 23 | 41732 | 277.46 | 636 | 639 | 148.1 |
| D | 2 | 249 | 101519 | 645.05 | 639 | 622 | 156.4 |
| D | 7 | 223 | 94849 | 602.41 | 639 | 622 | 156.4 |
| D | 10 | 199 | 75941 | 481.53 | 639 | 622 | 156.4 |
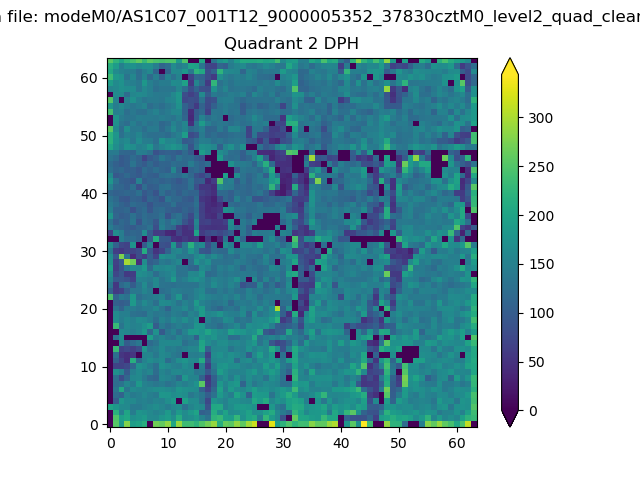
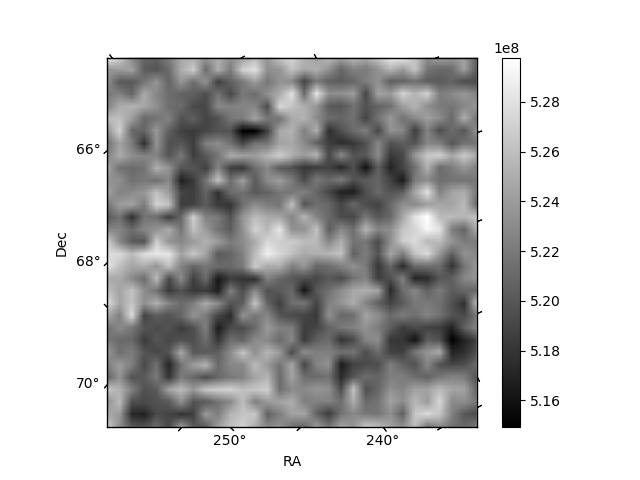
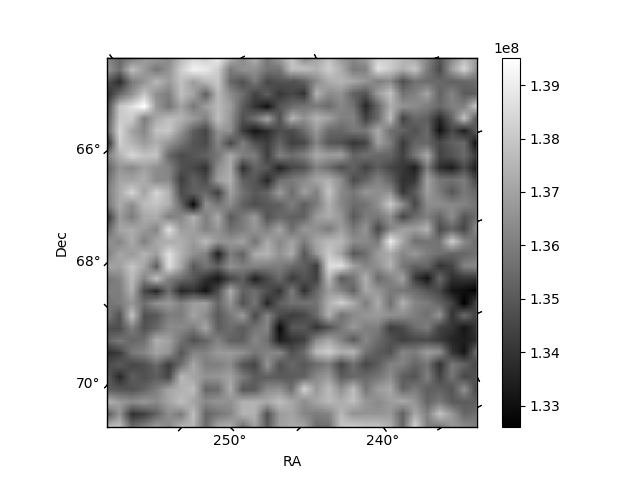
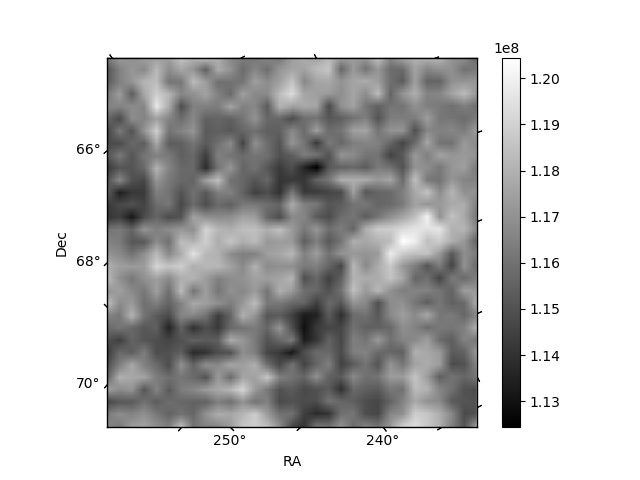
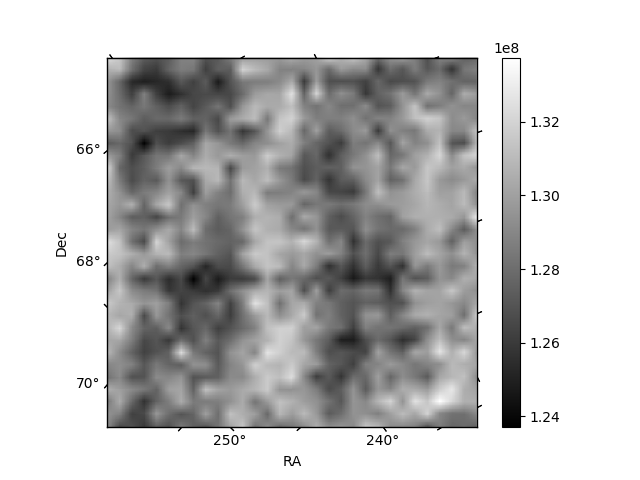
Histogram calculated using DETX and DETY for each event in the final _common_clean file
| Quadrant A | 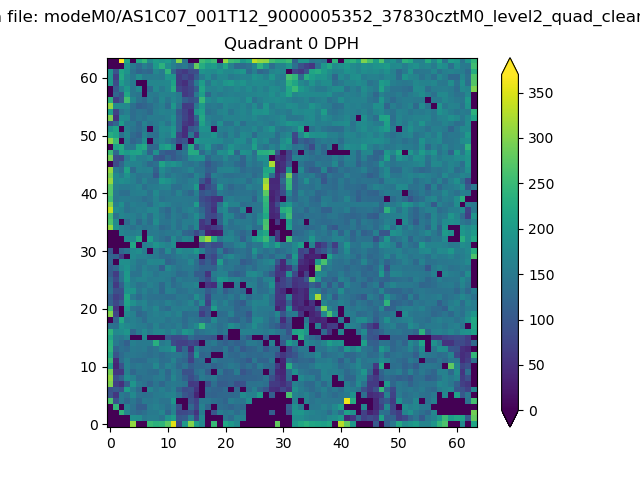 |
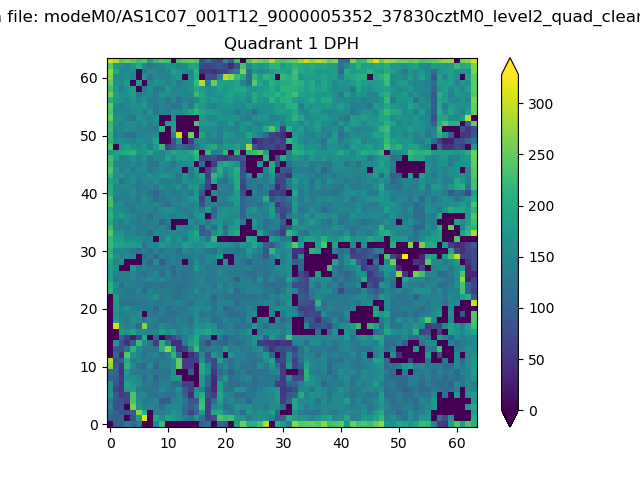 |
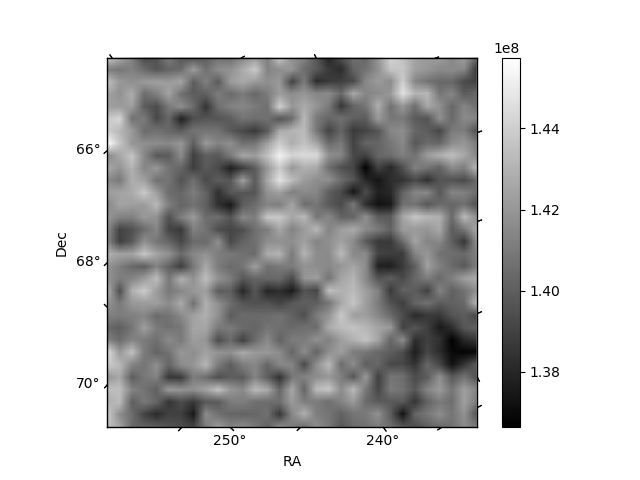
Quadrant B |
|---|---|---|---|
| Quadrant D | 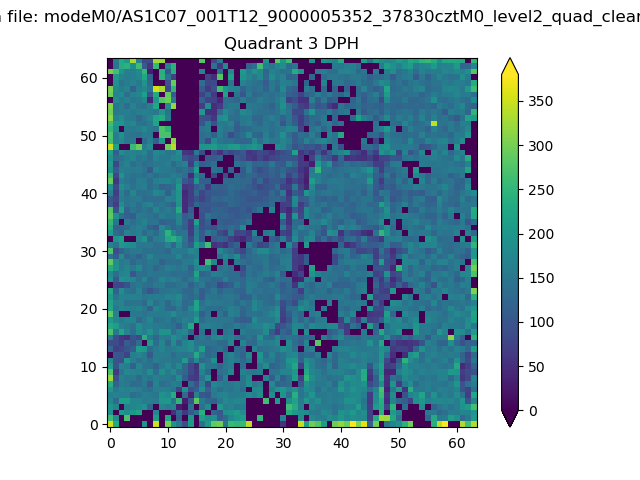 |
 |
Quadrant C |
| Plot type | Count rate plots | Images |
|---|---|---|
| Comparison with Poisson distribution Blue bars denote a histogram of data divided into 1 sec bins. Red curve is a Poisson curve with rate = median count rate of data. |
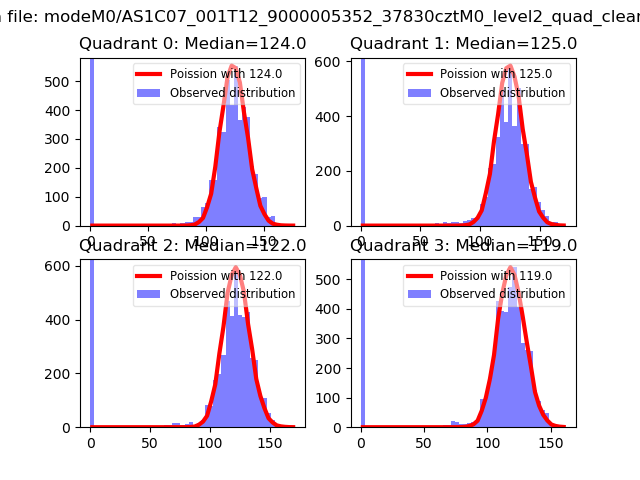 |
 |
| Quadrant-wise count rates Data is divided into 100 sec bins |
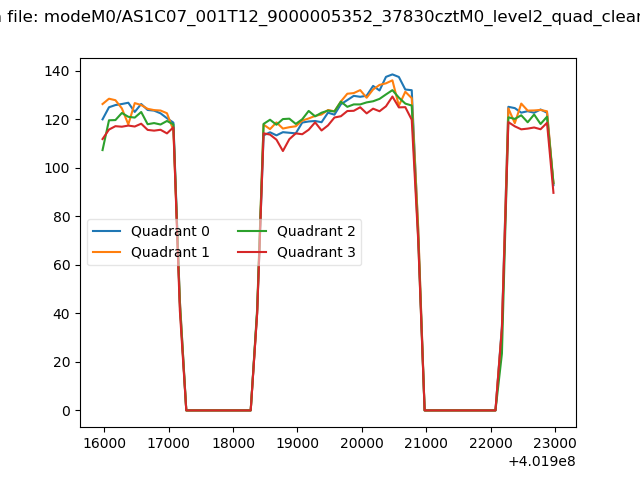 |
|
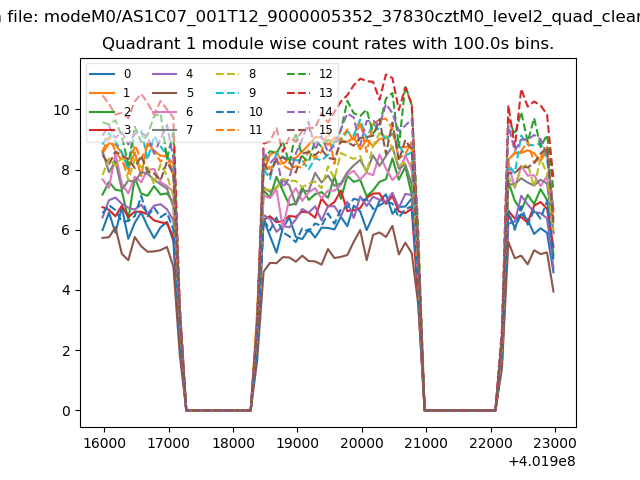
| Module-wise count rates for Quadrant A Data is divided into 100 sec bins |
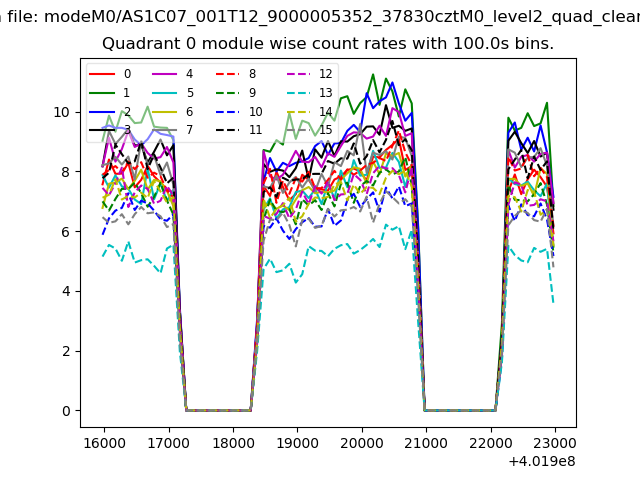 |
 |
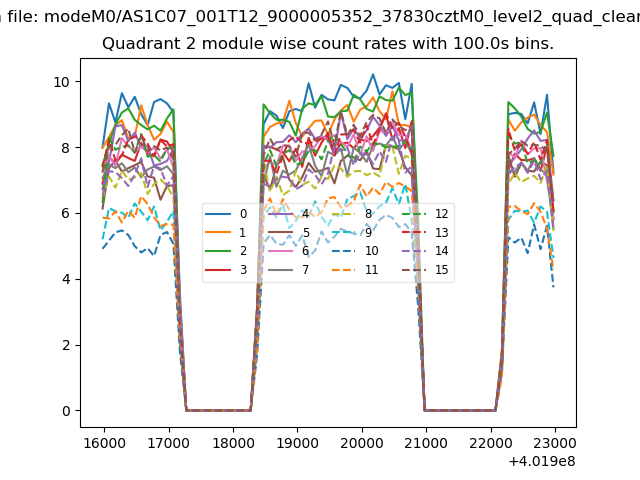
| Module-wise count rates for Quadrant B Data is divided into 100 sec bins |
 |
 |
| Module-wise count rates for Quadrant C Data is divided into 100 sec bins |
 |
 |
| Module-wise count rates for Quadrant D Data is divided into 100 sec bins |
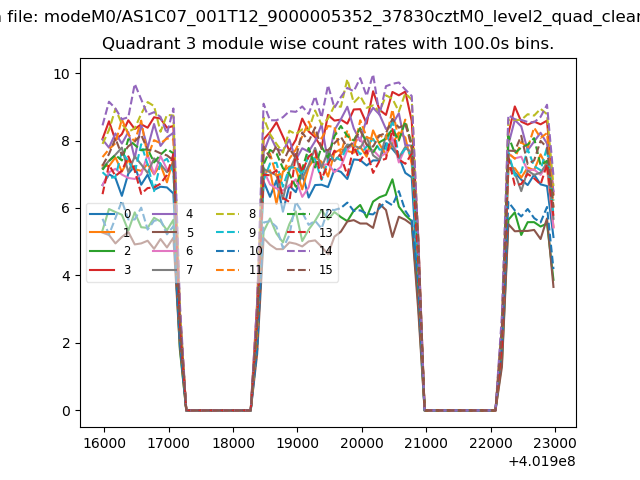 |
 |
| Parameter | Plot |
|---|---|
| CZT HV Monitor | 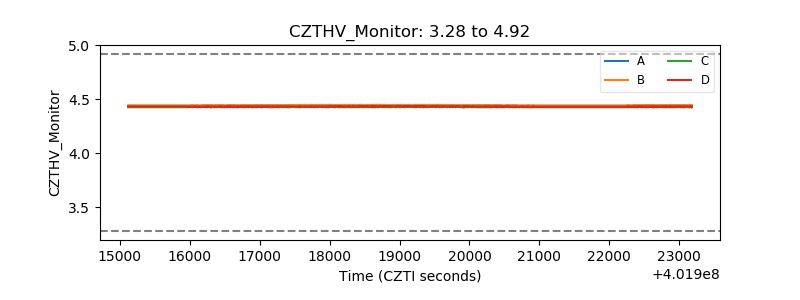 |
| D_VDD | 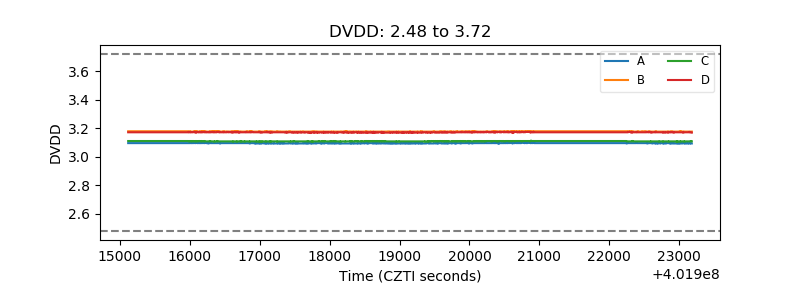 |
| Temperature 1 | 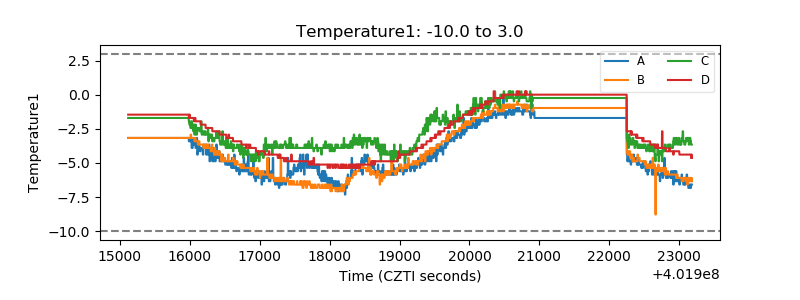 |
| Veto HV Monitor | 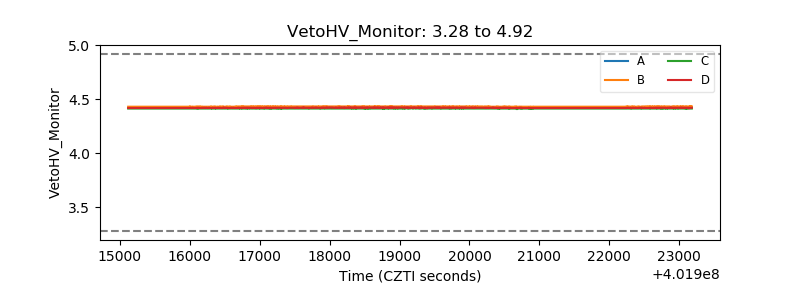 |
| Veto LLD | 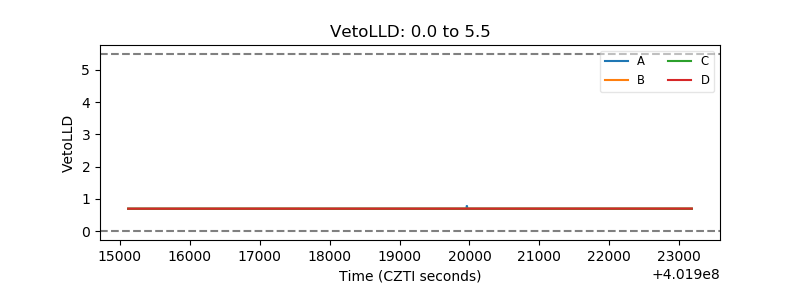 |
| Alpha Counter | 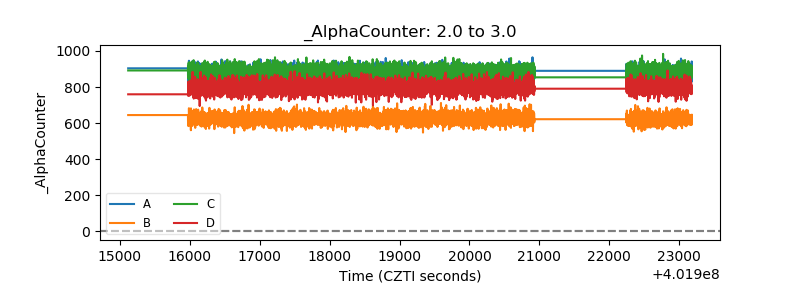 |
| _CPM_Rate | 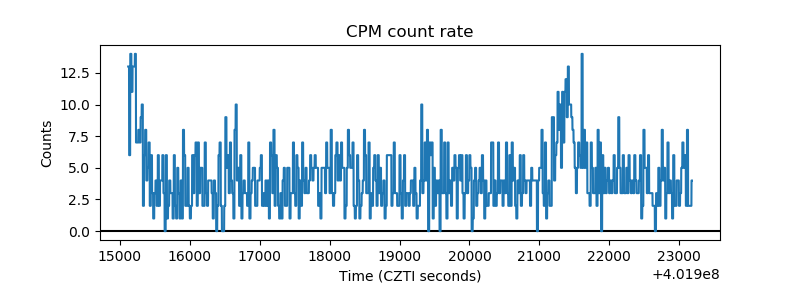 |
| CZT Counter | 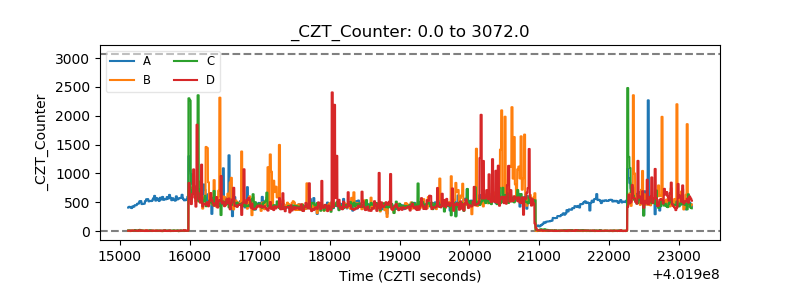 |
| +2.5 Volts monitor | 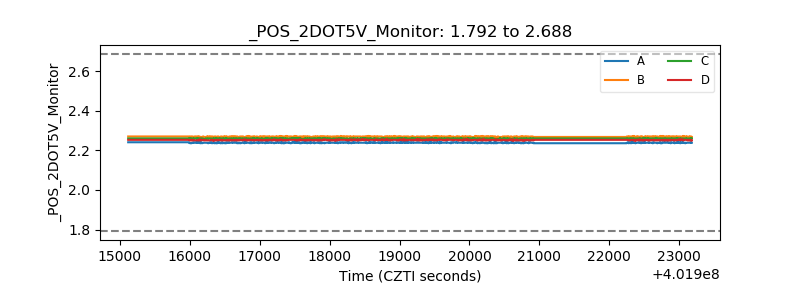 |
| +5 Volts monitor | 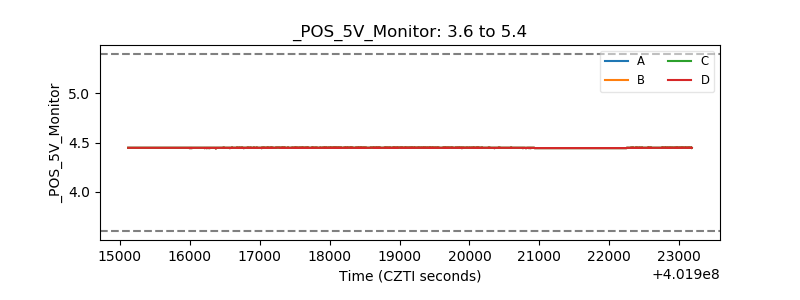 |
| _ROLL_ROT | 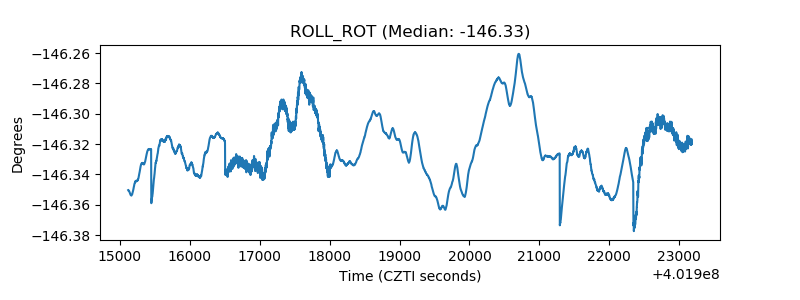 |
| _Roll_DEC | 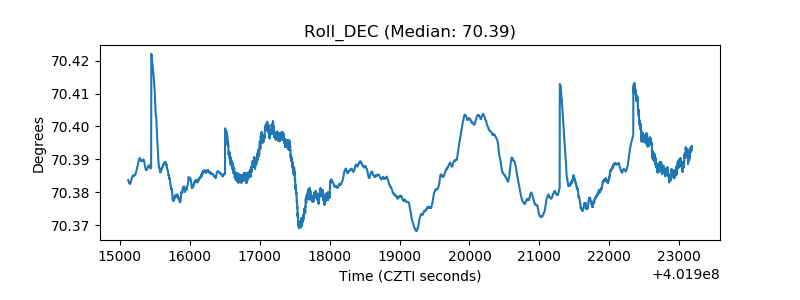 |
| _Roll_RA | 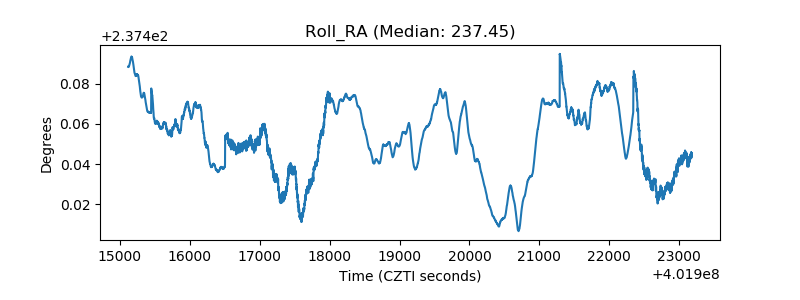 |
| Veto Counter | 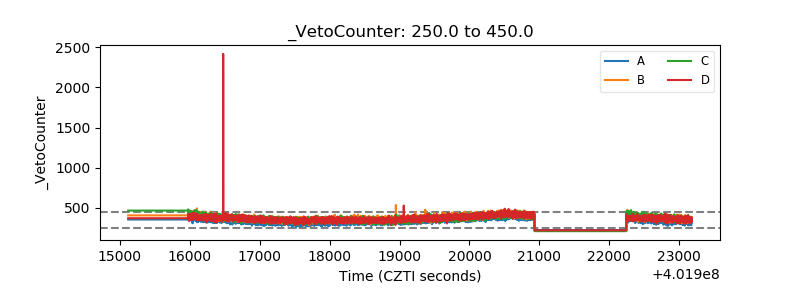 |