| Param | Original file | Final file |
|---|---|---|
| Filename | modeM0/AS1C07_001T12_9000005352_37833cztM0_level2.evt | modeM0/AS1C07_001T12_9000005352_37833cztM0_level2_quad_clean.evt |
| Size (bytes) | 1,221,528,960 | 210,746,880 |
| Size | 1.1 GB | 201.0 MB |
| Events in quadrant A | 7,825,616 | 1,369,801 |
| Events in quadrant B | 8,408,485 | 1,378,882 |
| Events in quadrant C | 8,360,641 | 1,348,639 |
| Events in quadrant D | 11,342,741 | 1,206,117 |
| Mode M9 | |||
|---|---|---|---|
| Quadrant | BADHDUFLAG | Total packets | Discarded packets |
| A | 0 | 53 | 0 |
| B | 0 | 53 | 0 |
| C | 0 | 53 | 0 |
| D | 0 | 54 | 0 |
| Mode M0 | |||
|---|---|---|---|
| Quadrant | BADHDUFLAG | Total packets | Discarded packets |
| A | 0 | 33225 | 5 |
| B | 0 | 35588 | 4 |
| C | 0 | 34696 | 4 |
| D | 0 | 44716 | 4 |
| Mode SS | |||
|---|---|---|---|
| Quadrant | BADHDUFLAG | Total packets | Discarded packets |
| A | 0 | 316 | 0 |
| B | 0 | 316 | 0 |
| C | 0 | 316 | 0 |
| D | 0 | 316 | 0 |
| Quadrant | Total seconds | Saturated seconds | Saturation percentage |
|---|---|---|---|
| A | 15650 | 32 | 0.204473% |
| B | 15650 | 218 | 1.392971% |
| C | 15650 | 168 | 1.073482% |
| D | 15650 | 1413 | 9.028754% |
Noise dominated data is calculated using 1-second bins in cleaned event files. If a bin has >2000 counts, and if more than 50% of those come from <1% of pixels, then it is considered to be noise-dominated and hence unusable.
| Quadrant | # 1 sec bins | Bins with >0 counts | Bins with >2000 counts | High rate bins dominated by noise | Noise dominated (total time) | Noise dominated (detector-on time) | Marked lightcurve |
|---|---|---|---|---|---|---|---|
| A | 19769 | 15653 | 20 | 20 | 0.10% | 0.13% | 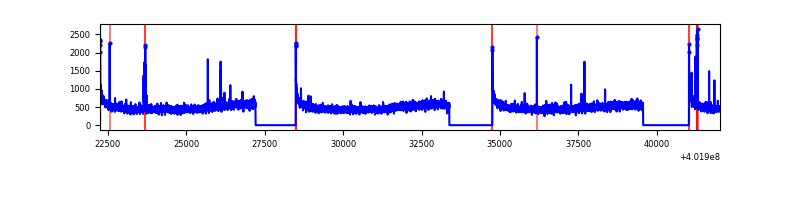 |
| B | 19768 | 15652 | 138 | 138 | 0.70% | 0.88% | 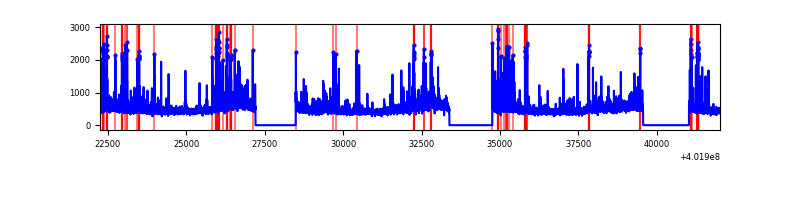 |
| C | 19768 | 15652 | 154 | 154 | 0.78% | 0.98% | 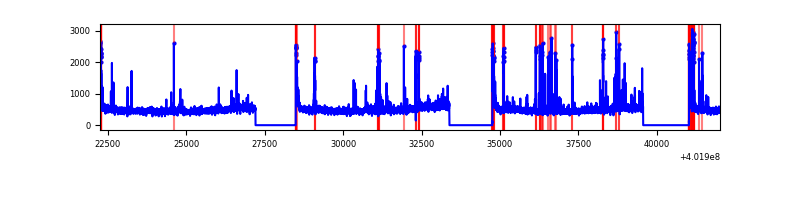 |
| D | 19768 | 15652 | 1148 | 1148 | 5.81% | 7.33% | 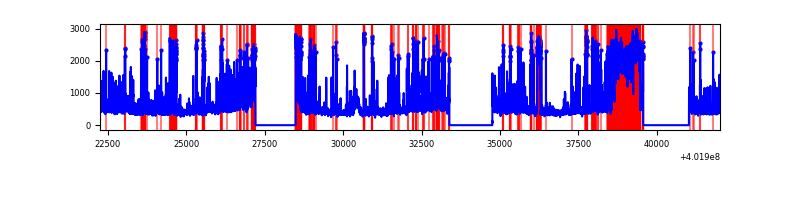 |
Top three noisy pixels from each quadrant. If the there are fewer than three noisy pixels in the level2.evt file, extra rows are filled as -1
| Pixel properties | Quadrant properties | ||||||
|---|---|---|---|---|---|---|---|
| Quadrant | DetID | PixID | Counts | Sigma | Mean | Median | Sigma |
| A | 10 | 83 | 872945 | 2499.31 | 1746 | 1711 | 348.6 |
| A | 9 | 143 | 69523 | 194.53 | 1746 | 1711 | 348.6 |
| A | 15 | 222 | 52671 | 146.19 | 1746 | 1711 | 348.6 |
| B | 5 | 172 | 737174 | 2236.21 | 1731 | 1687 | 328.9 |
| B | 0 | 213 | 303214 | 916.78 | 1731 | 1687 | 328.9 |
| B | 0 | 229 | 210374 | 634.5 | 1731 | 1687 | 328.9 |
| C | 15 | 214 | 656923 | 1671.77 | 1689 | 1698 | 391.9 |
| C | 1 | 23 | 479583 | 1219.3 | 1689 | 1698 | 391.9 |
| C | 0 | 10 | 309912 | 786.39 | 1689 | 1698 | 391.9 |
| D | 13 | 249 | 2292545 | 5857.27 | 1616 | 1573 | 391.1 |
| D | 2 | 249 | 926272 | 2364.15 | 1616 | 1573 | 391.1 |
| D | 1 | 52 | 366285 | 932.45 | 1616 | 1573 | 391.1 |
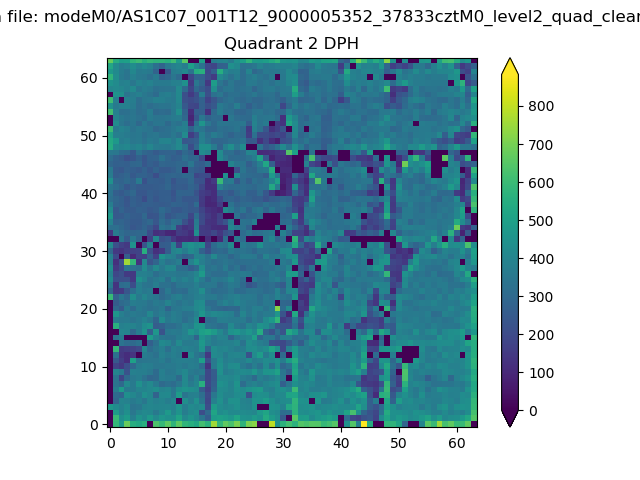
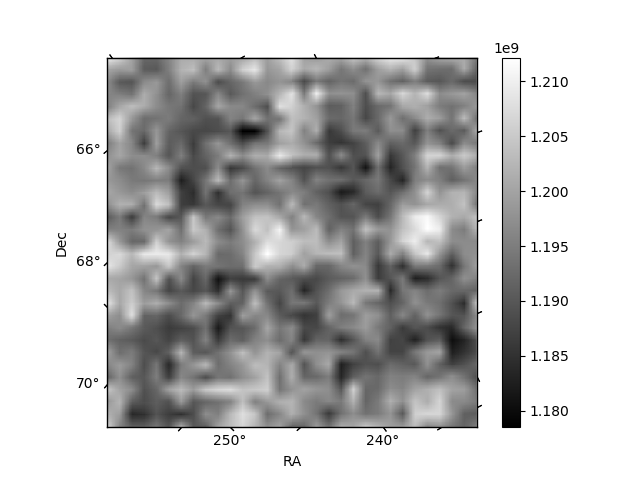
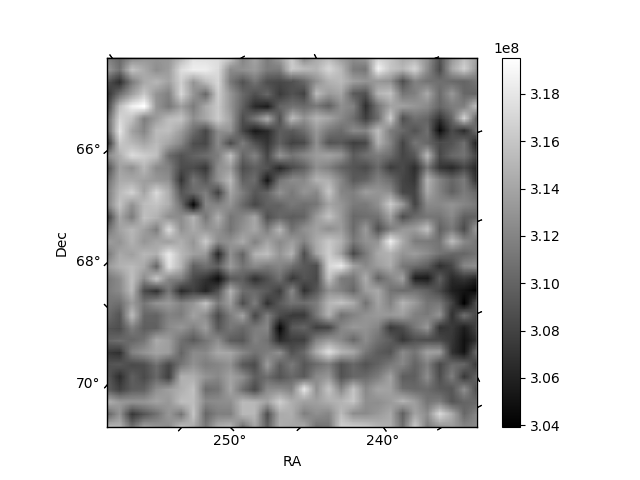
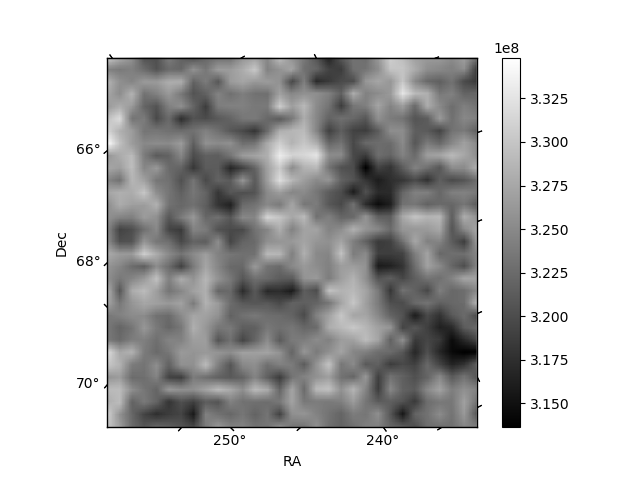
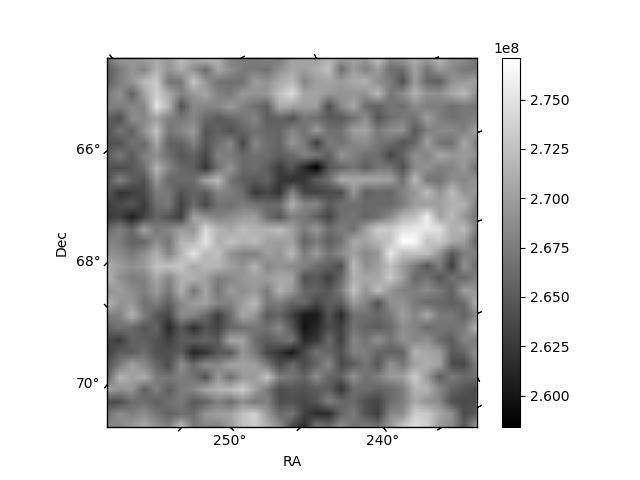
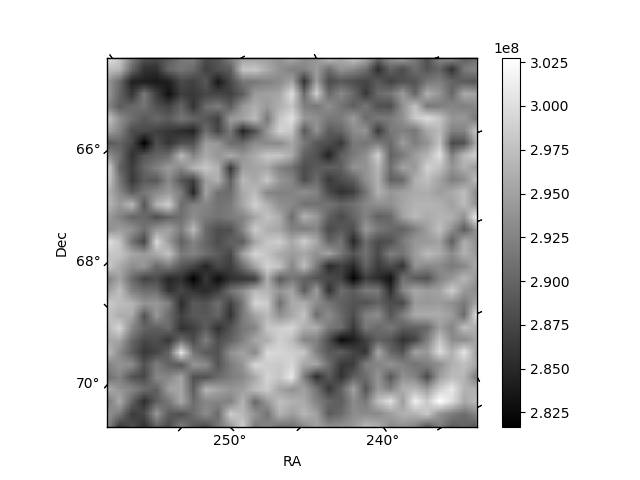
Histogram calculated using DETX and DETY for each event in the final _common_clean file
| Quadrant A | 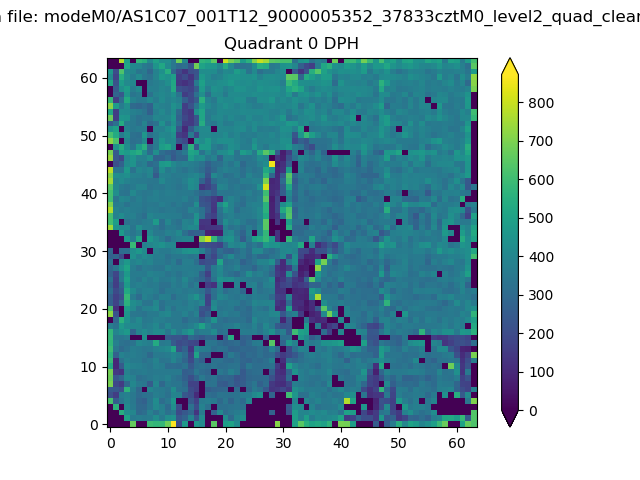 |
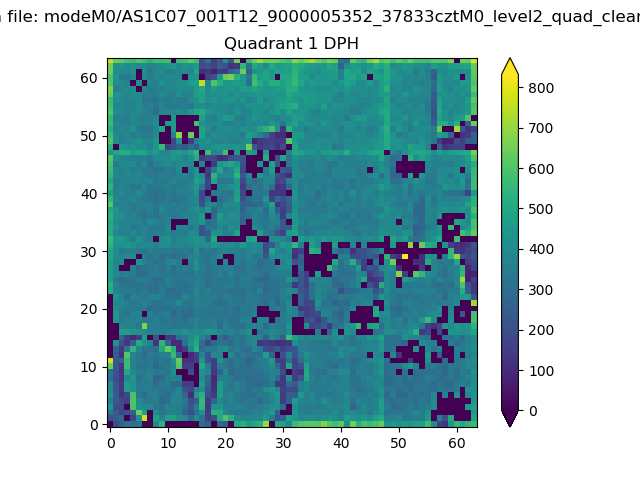 |
Quadrant B |
|---|---|---|---|
| Quadrant D | 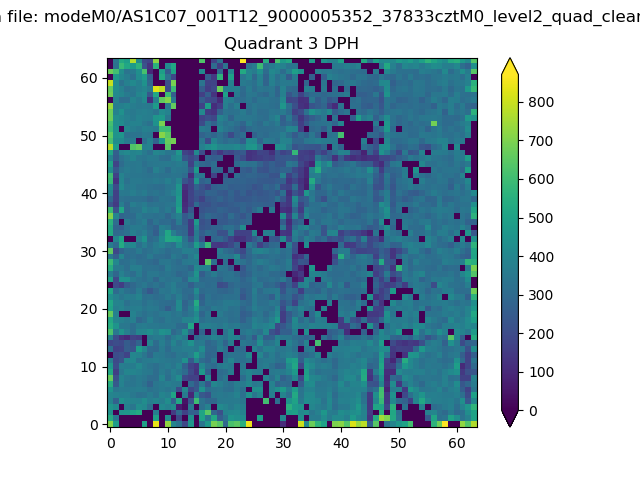 |
 |
Quadrant C |
| Plot type | Count rate plots | Images |
|---|---|---|
| Comparison with Poisson distribution Blue bars denote a histogram of data divided into 1 sec bins. Red curve is a Poisson curve with rate = median count rate of data. |
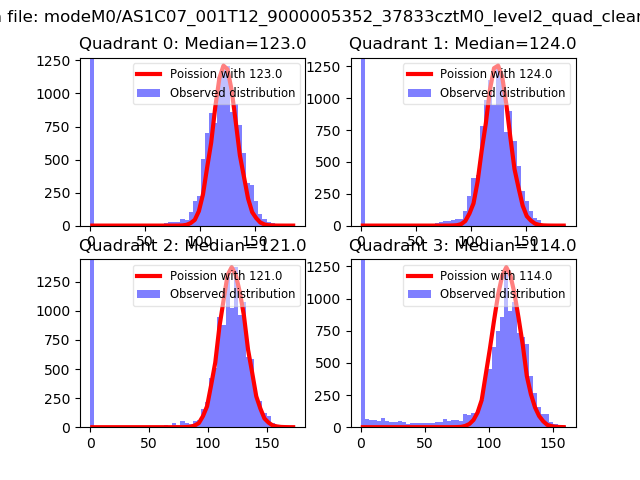 |
 |
| Quadrant-wise count rates Data is divided into 100 sec bins |
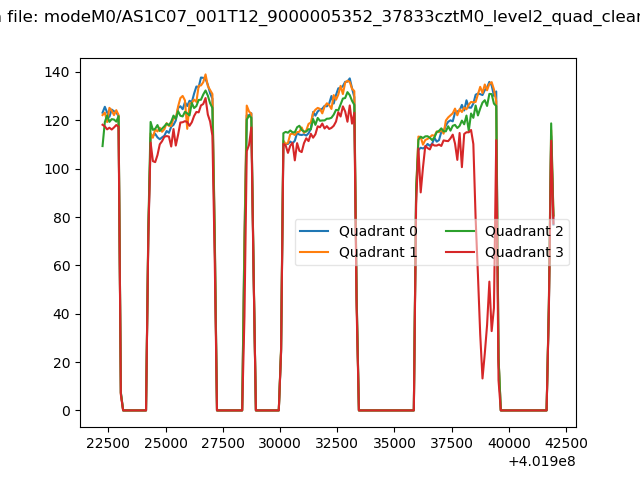 |
|
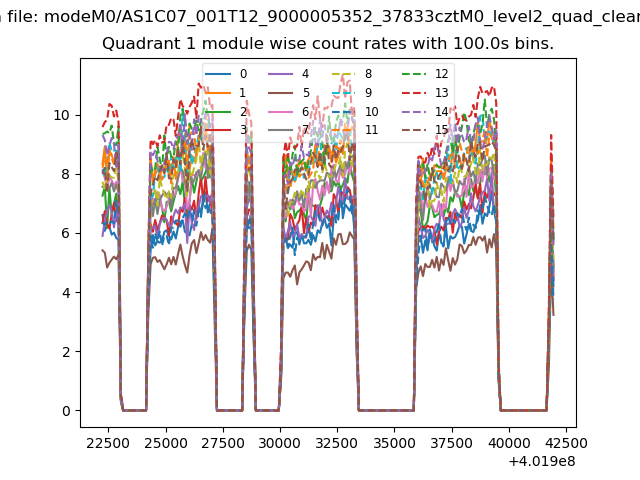
| Module-wise count rates for Quadrant A Data is divided into 100 sec bins |
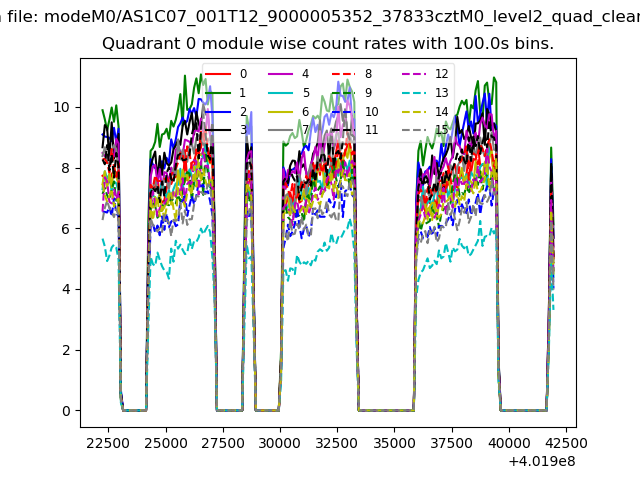 |
 |
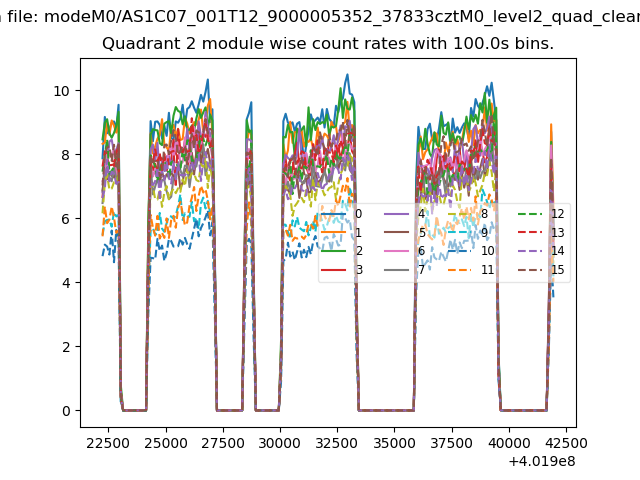
| Module-wise count rates for Quadrant B Data is divided into 100 sec bins |
 |
 |
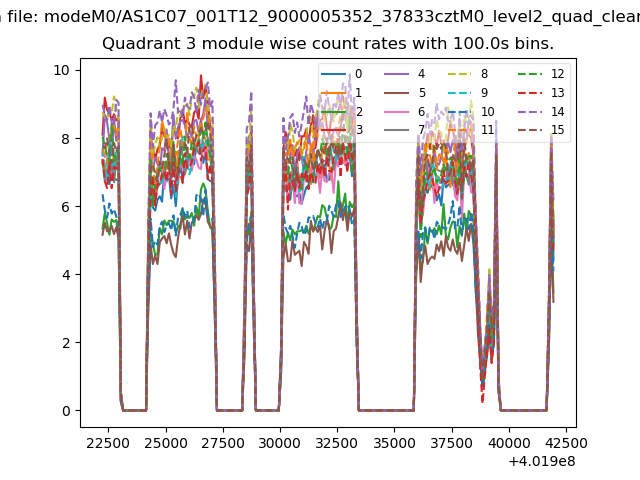
| Module-wise count rates for Quadrant C Data is divided into 100 sec bins |
 |
 |
| Module-wise count rates for Quadrant D Data is divided into 100 sec bins |
 |
 |
| Parameter | Plot |
|---|---|
| CZT HV Monitor | 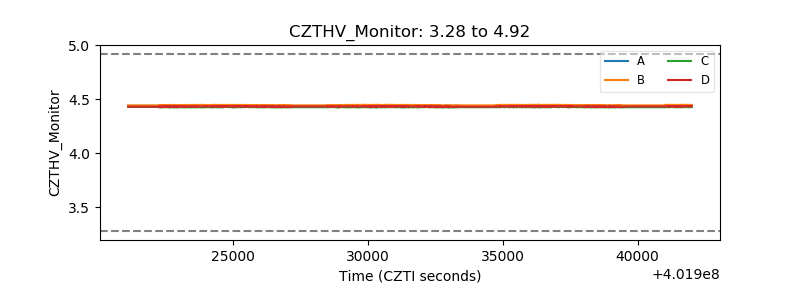 |
| D_VDD | 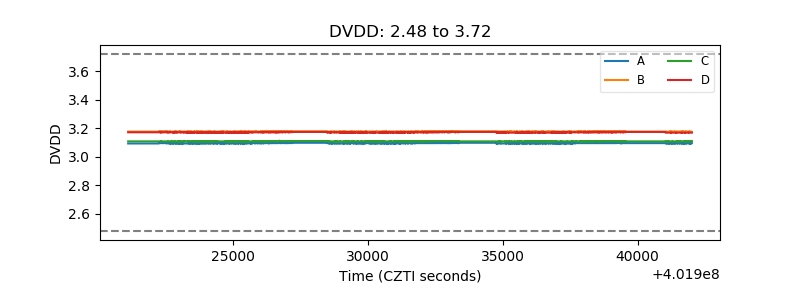 |
| Temperature 1 | 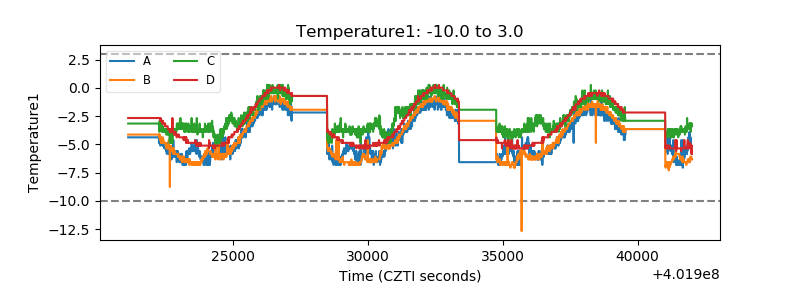 |
| Veto HV Monitor | 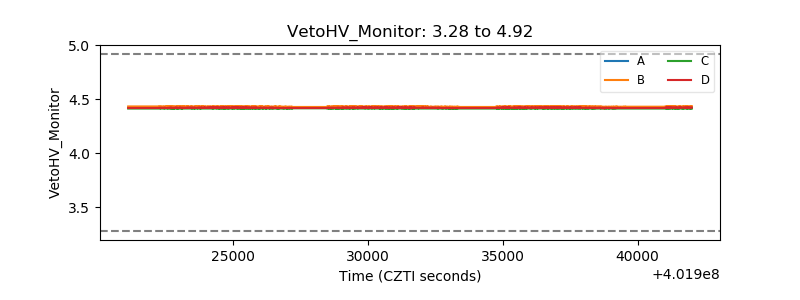 |
| Veto LLD | 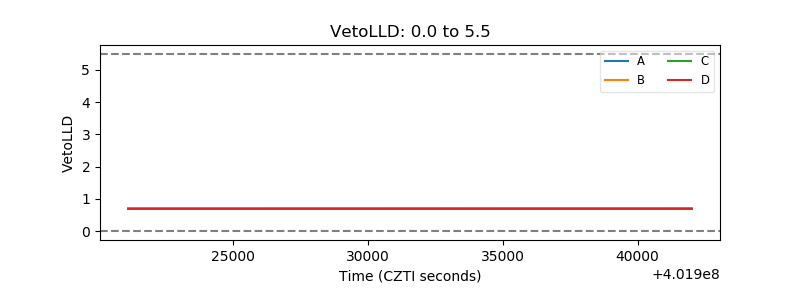 |
| Alpha Counter | 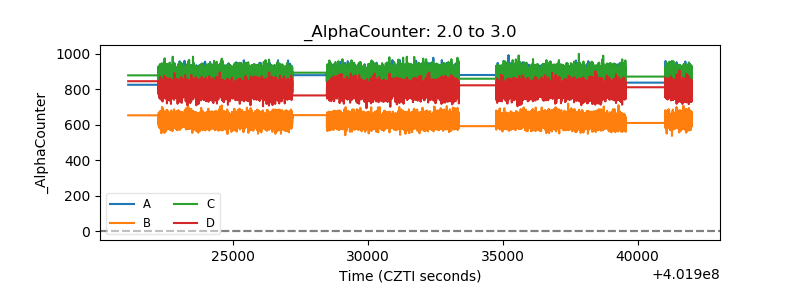 |
| _CPM_Rate |  |
| CZT Counter | 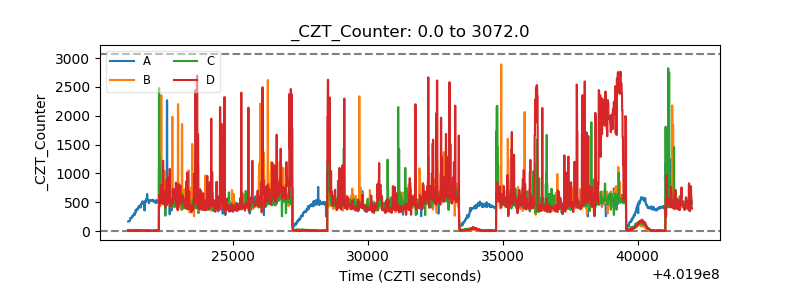 |
| +2.5 Volts monitor | 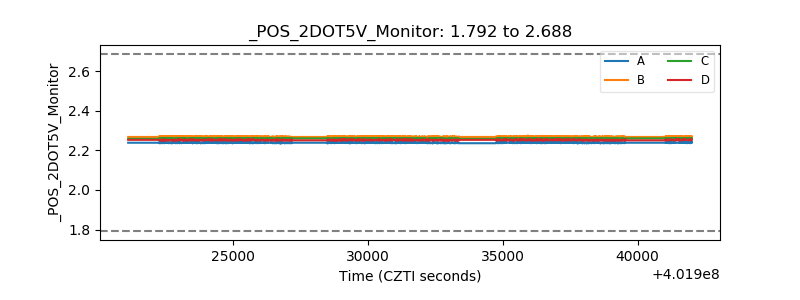 |
| +5 Volts monitor | 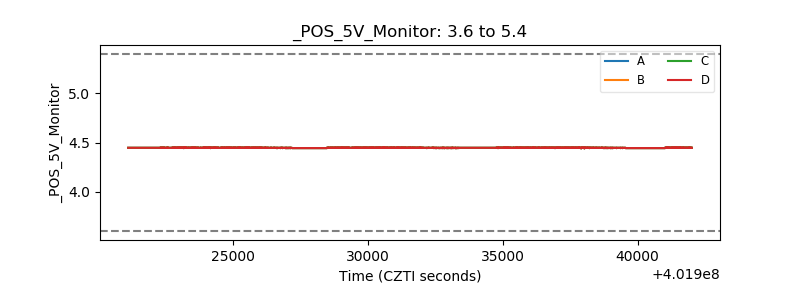 |
| _ROLL_ROT | 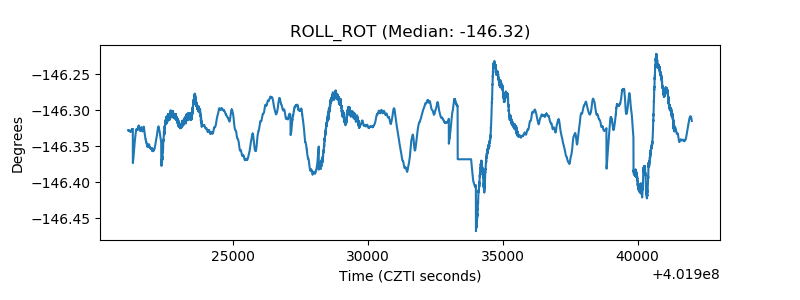 |
| _Roll_DEC | 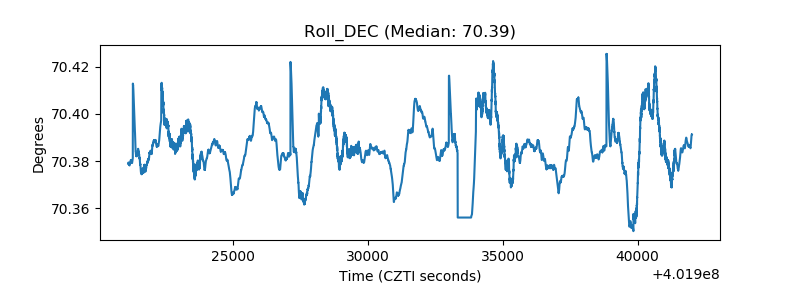 |
| _Roll_RA | 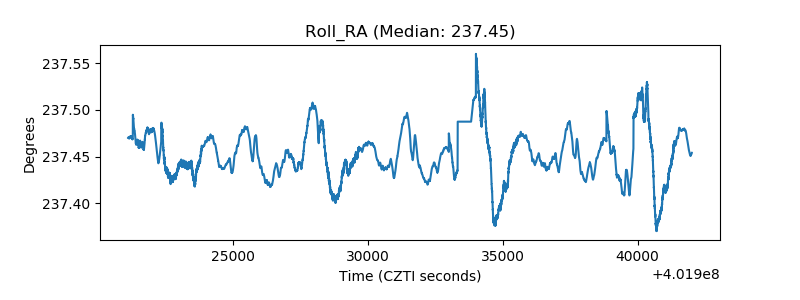 |
| Veto Counter | 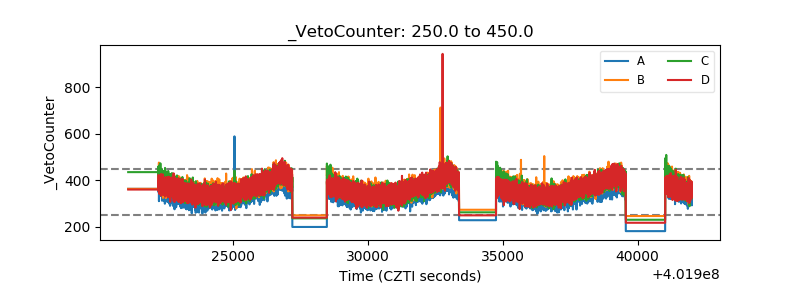 |