| Param | Original file | Final file |
|---|---|---|
| Filename | modeM0/AS1C07_001T12_9000005352_37834cztM0_level2.evt | modeM0/AS1C07_001T12_9000005352_37834cztM0_level2_quad_clean.evt |
| Size (bytes) | 444,965,760 | 81,901,440 |
| Size | 424.4 MB | 78.1 MB |
| Events in quadrant A | 2,889,757 | 544,598 |
| Events in quadrant B | 3,116,374 | 546,437 |
| Events in quadrant C | 3,018,843 | 536,842 |
| Events in quadrant D | 4,068,757 | 458,905 |
| Mode M9 | |||
|---|---|---|---|
| Quadrant | BADHDUFLAG | Total packets | Discarded packets |
| A | 0 | 20 | 0 |
| B | 0 | 20 | 0 |
| C | 0 | 20 | 0 |
| D | 0 | 21 | 0 |
| Mode M0 | |||
|---|---|---|---|
| Quadrant | BADHDUFLAG | Total packets | Discarded packets |
| A | 0 | 12094 | 3 |
| B | 0 | 12997 | 2 |
| C | 0 | 12467 | 2 |
| D | 0 | 16102 | 2 |
| Mode SS | |||
|---|---|---|---|
| Quadrant | BADHDUFLAG | Total packets | Discarded packets |
| A | 0 | 114 | 0 |
| B | 0 | 114 | 0 |
| C | 0 | 114 | 0 |
| D | 0 | 114 | 0 |
| Quadrant | Total seconds | Saturated seconds | Saturation percentage |
|---|---|---|---|
| A | 5620 | 17 | 0.302491% |
| B | 5620 | 126 | 2.241993% |
| C | 5620 | 73 | 1.298932% |
| D | 5620 | 673 | 11.975089% |
Noise dominated data is calculated using 1-second bins in cleaned event files. If a bin has >2000 counts, and if more than 50% of those come from <1% of pixels, then it is considered to be noise-dominated and hence unusable.
| Quadrant | # 1 sec bins | Bins with >0 counts | Bins with >2000 counts | High rate bins dominated by noise | Noise dominated (total time) | Noise dominated (detector-on time) | Marked lightcurve |
|---|---|---|---|---|---|---|---|
| A | 7234 | 5621 | 12 | 12 | 0.17% | 0.21% | 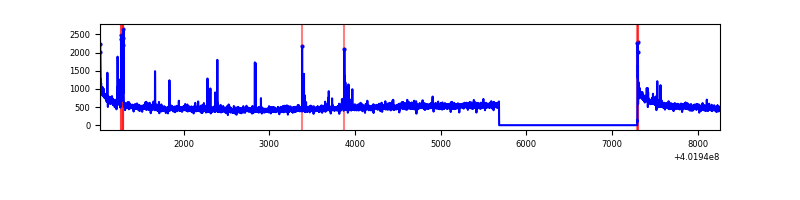 |
| B | 7234 | 5621 | 99 | 99 | 1.37% | 1.76% | 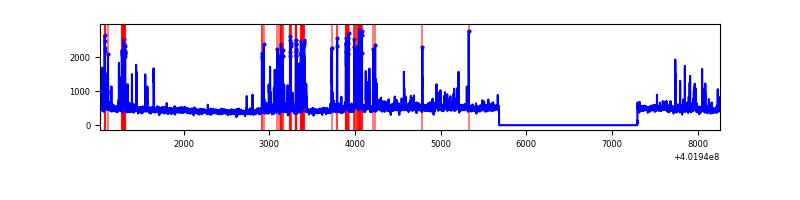 |
| C | 7234 | 5621 | 67 | 67 | 0.93% | 1.19% | 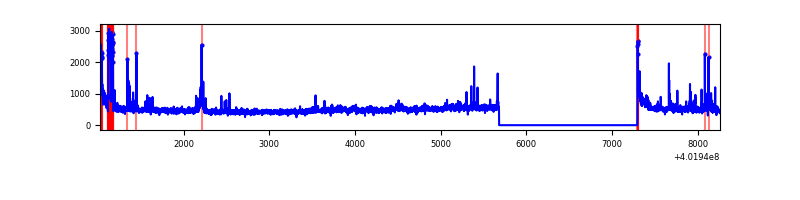 |
| D | 7234 | 5621 | 152 | 152 | 2.10% | 2.70% | 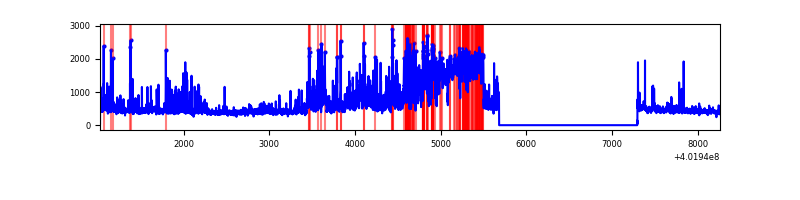 |
Top three noisy pixels from each quadrant. If the there are fewer than three noisy pixels in the level2.evt file, extra rows are filled as -1
| Pixel properties | Quadrant properties | ||||||
|---|---|---|---|---|---|---|---|
| Quadrant | DetID | PixID | Counts | Sigma | Mean | Median | Sigma |
| A | 10 | 83 | 350810 | 2766.69 | 627 | 614 | 126.6 |
| A | 9 | 143 | 86643 | 679.66 | 627 | 614 | 126.6 |
| A | 12 | 189 | 13505 | 101.84 | 627 | 614 | 126.6 |
| B | 5 | 172 | 504961 | 4287.51 | 620 | 604 | 117.6 |
| B | 0 | 213 | 96155 | 812.27 | 620 | 604 | 117.6 |
| B | 0 | 229 | 40489 | 339.06 | 620 | 604 | 117.6 |
| C | 15 | 214 | 249813 | 1756.15 | 604 | 607 | 141.9 |
| C | 1 | 23 | 126147 | 884.68 | 604 | 607 | 141.9 |
| C | 12 | 250 | 119464 | 837.58 | 604 | 607 | 141.9 |
| D | 13 | 249 | 1077841 | 7986.14 | 553 | 537 | 134.9 |
| D | 12 | 227 | 312797 | 2314.81 | 553 | 537 | 134.9 |
| D | 2 | 249 | 182799 | 1351.12 | 553 | 537 | 134.9 |
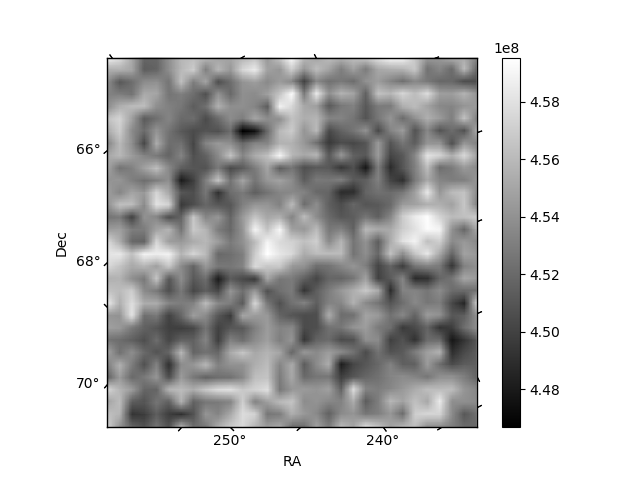
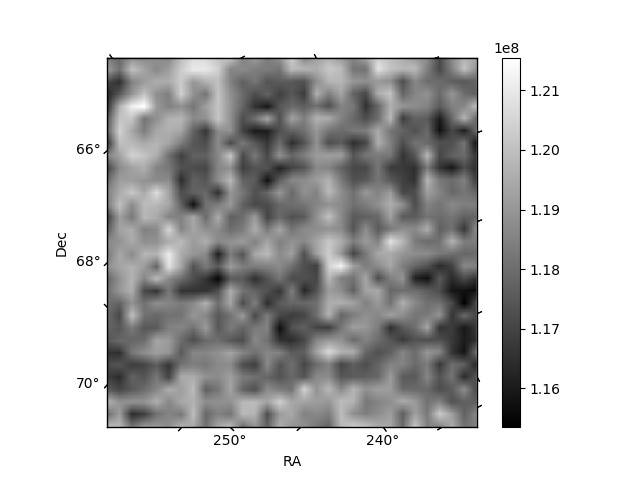
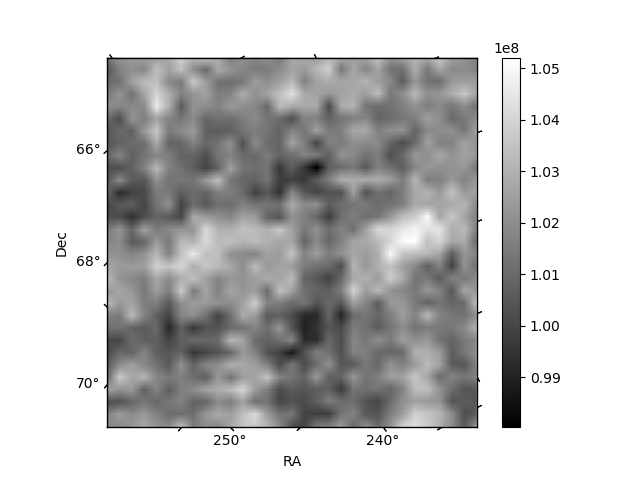
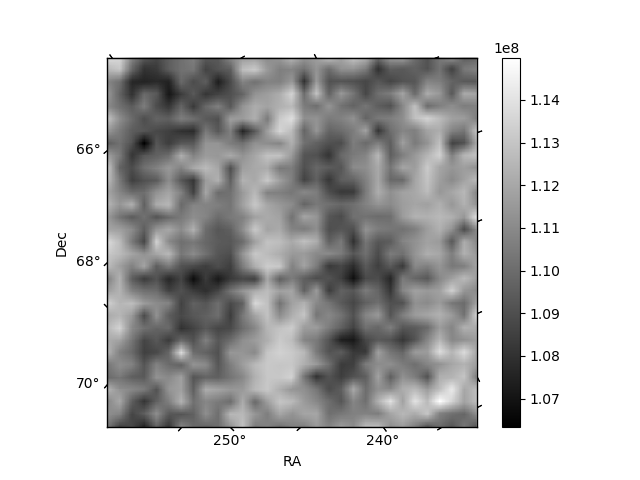
Histogram calculated using DETX and DETY for each event in the final _common_clean file
| Quadrant A | 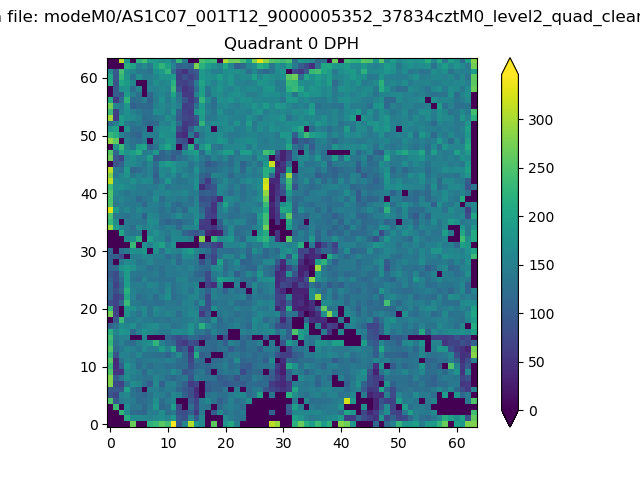 |
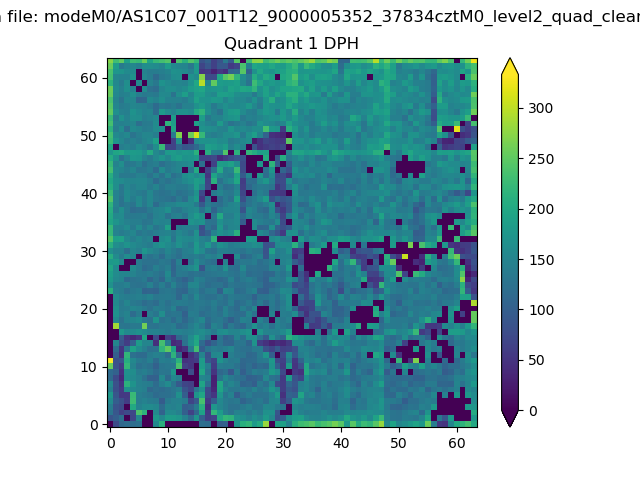 |
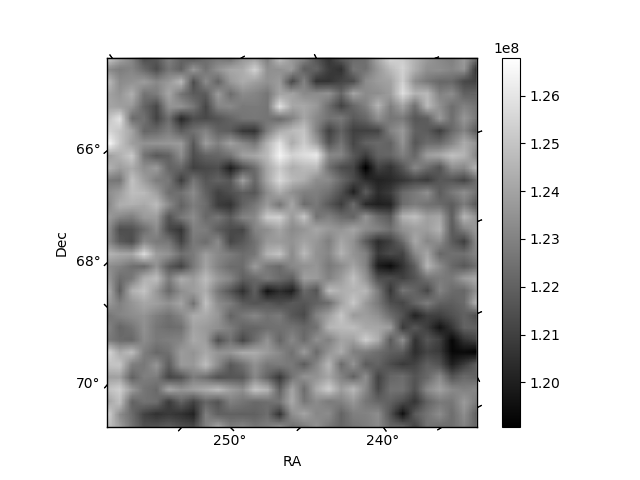
Quadrant B |
|---|---|---|---|
| Quadrant D | 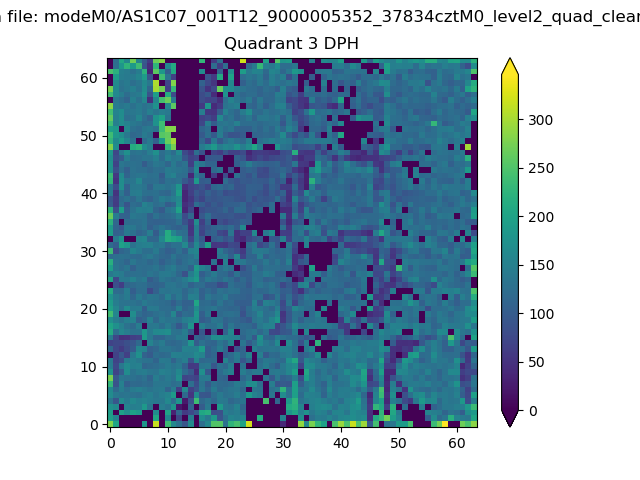 |
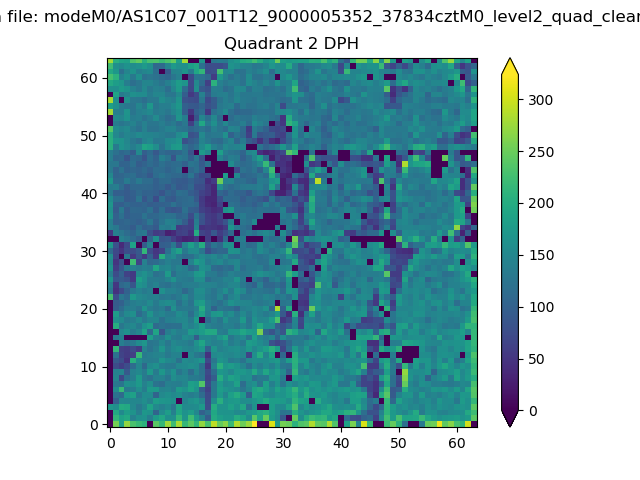 |
Quadrant C |
| Plot type | Count rate plots | Images |
|---|---|---|
| Comparison with Poisson distribution Blue bars denote a histogram of data divided into 1 sec bins. Red curve is a Poisson curve with rate = median count rate of data. |
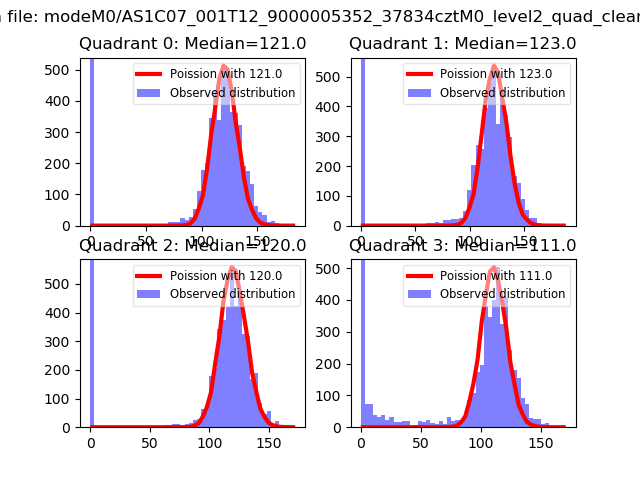 |
 |
| Quadrant-wise count rates Data is divided into 100 sec bins |
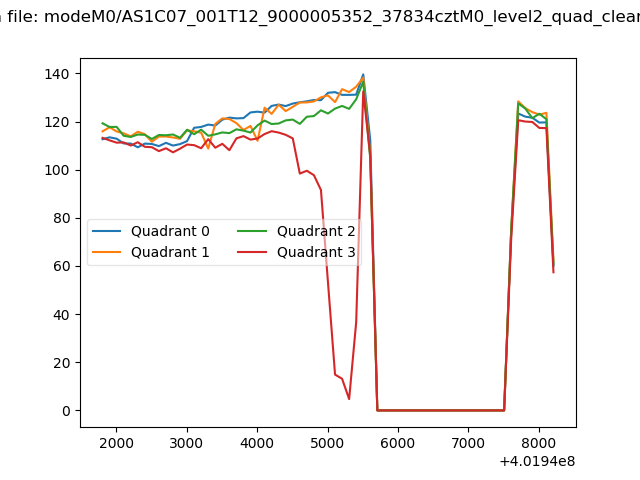 |
|
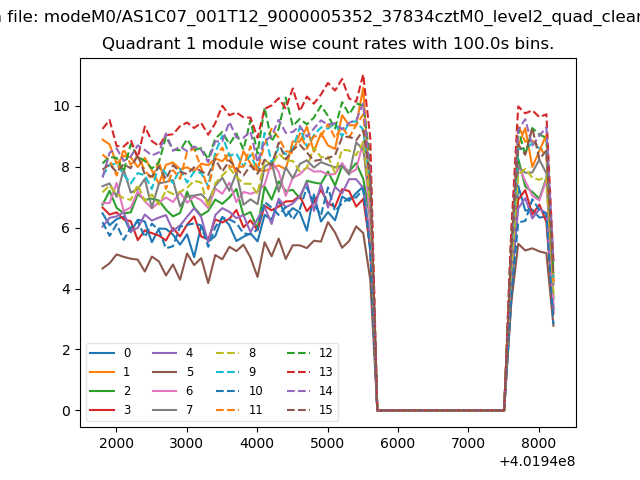
| Module-wise count rates for Quadrant A Data is divided into 100 sec bins |
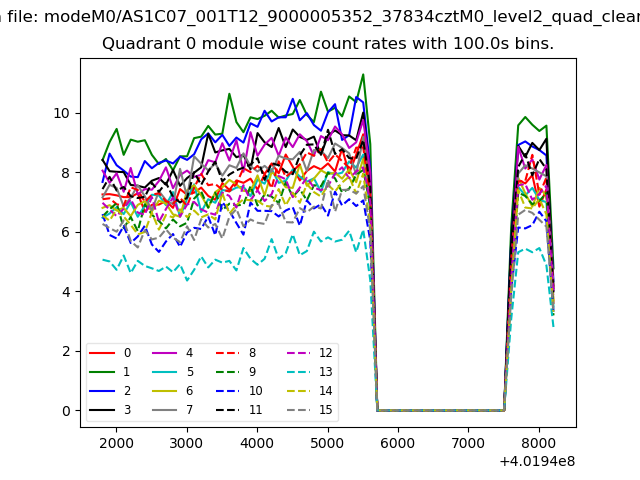 |
 |
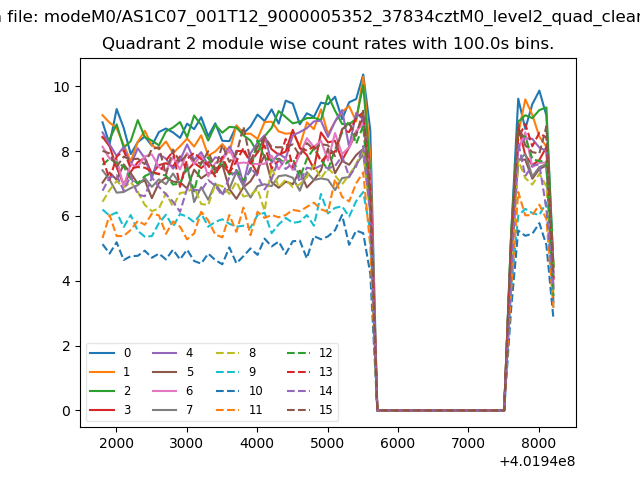
| Module-wise count rates for Quadrant B Data is divided into 100 sec bins |
 |
 |
| Module-wise count rates for Quadrant C Data is divided into 100 sec bins |
 |
 |
| Module-wise count rates for Quadrant D Data is divided into 100 sec bins |
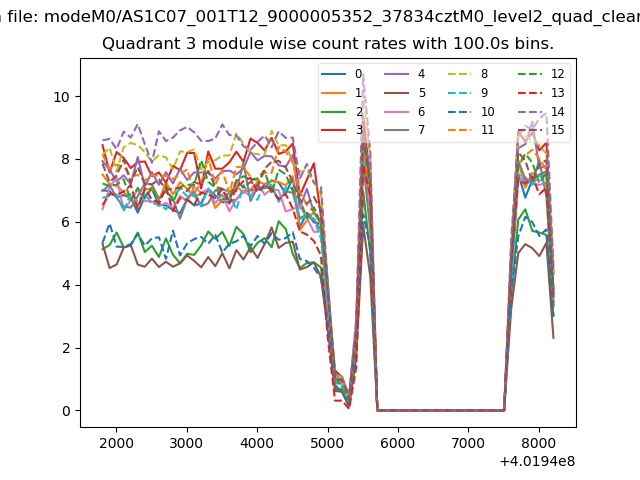 |
 |
| Parameter | Plot |
|---|---|
| CZT HV Monitor | 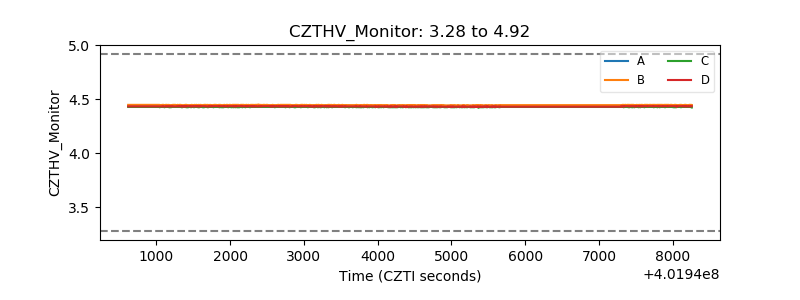 |
| D_VDD | 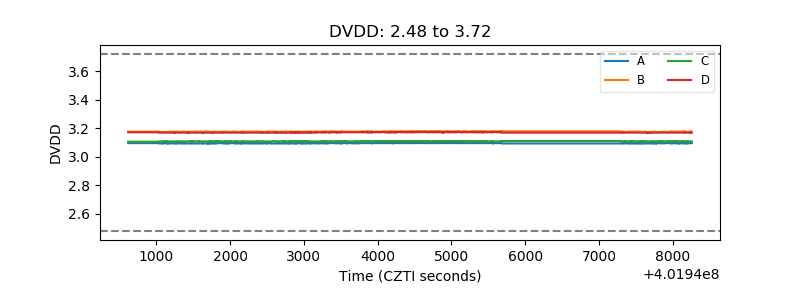 |
| Temperature 1 | 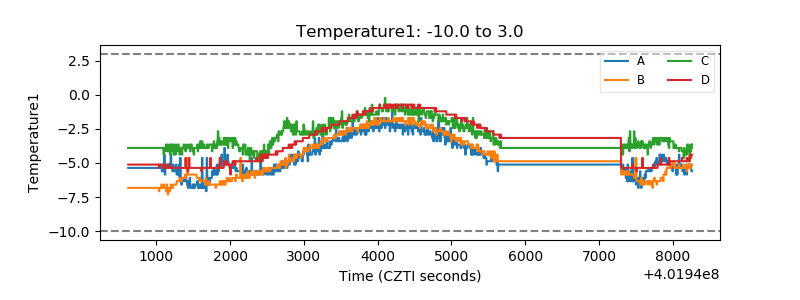 |
| Veto HV Monitor | 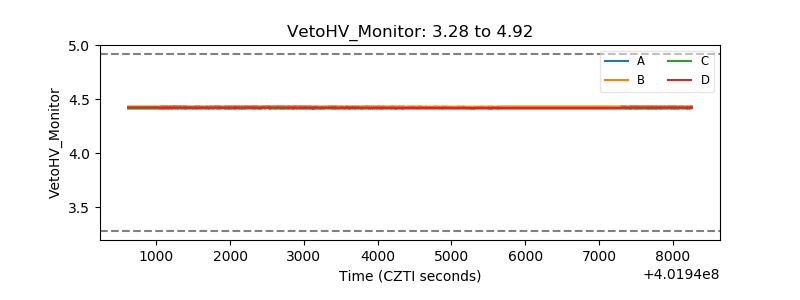 |
| Veto LLD | 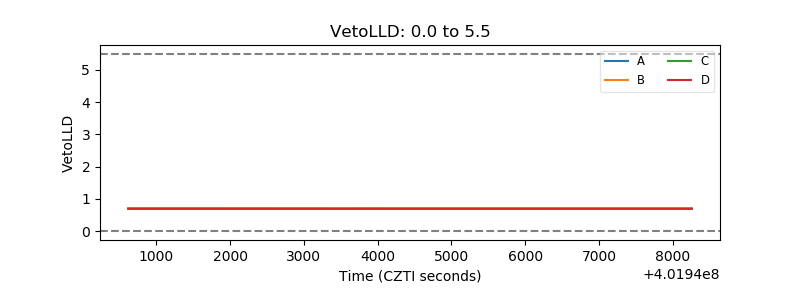 |
| Alpha Counter | 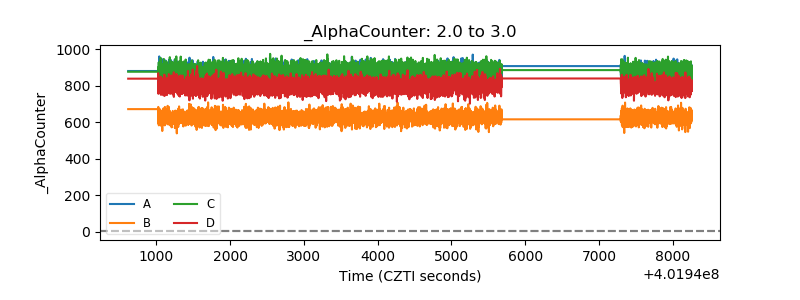 |
| _CPM_Rate | 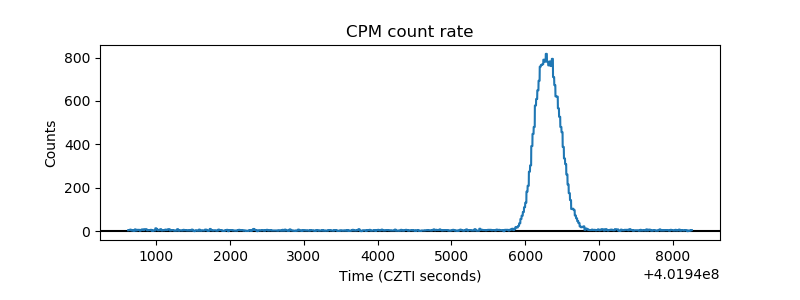 |
| CZT Counter | 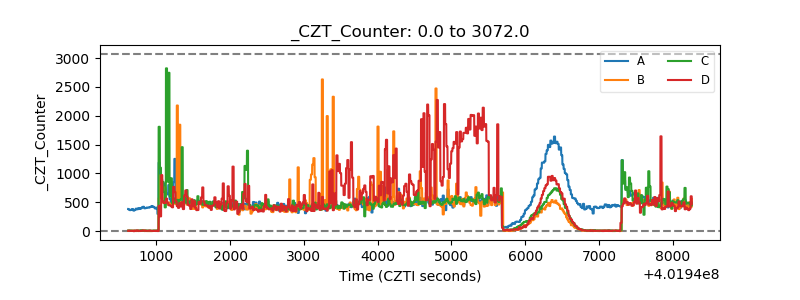 |
| +2.5 Volts monitor | 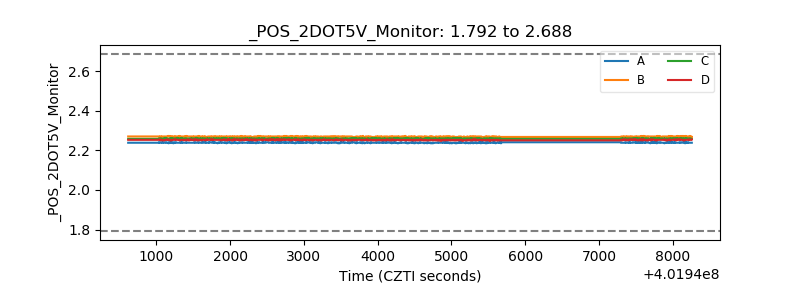 |
| +5 Volts monitor | 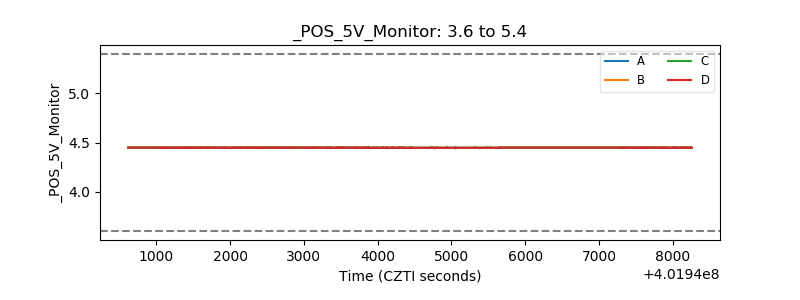 |
| _ROLL_ROT | 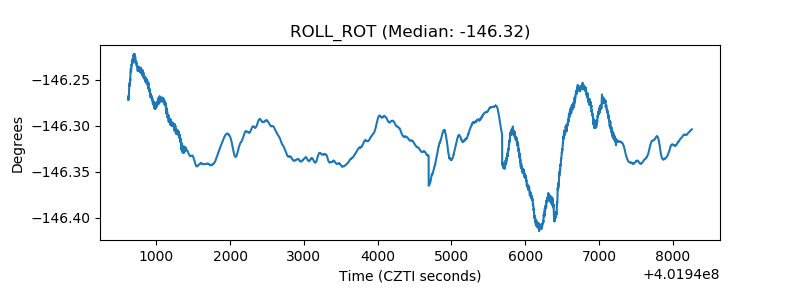 |
| _Roll_DEC | 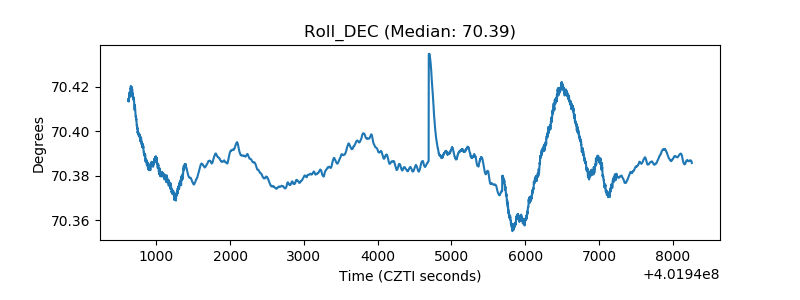 |
| _Roll_RA | 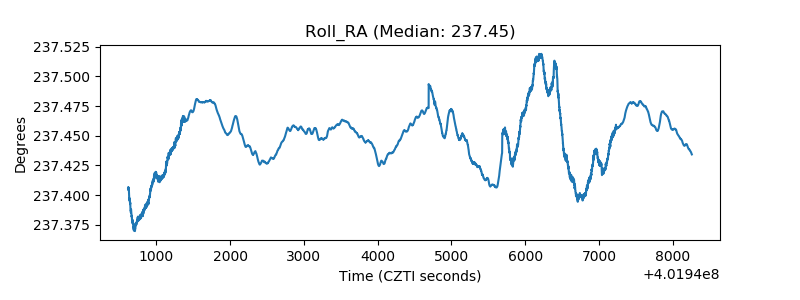 |
| Veto Counter | 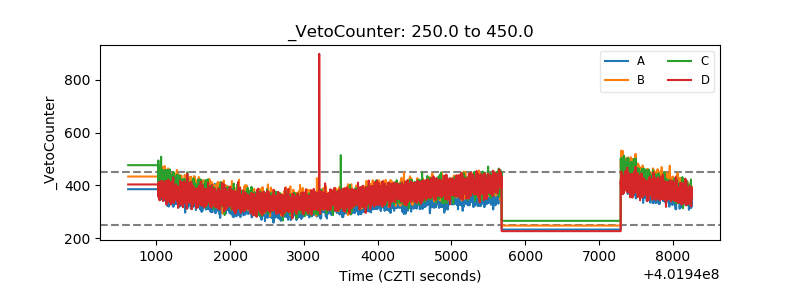 |