| Param | Original file | Final file |
|---|---|---|
| Filename | modeM0/AS1C07_001T12_9000005352_37836cztM0_level2.evt | modeM0/AS1C07_001T12_9000005352_37836cztM0_level2_quad_clean.evt |
| Size (bytes) | 485,553,600 | 90,855,360 |
| Size | 463.1 MB | 86.6 MB |
| Events in quadrant A | 2,800,741 | 634,775 |
| Events in quadrant B | 2,947,076 | 638,581 |
| Events in quadrant C | 2,822,346 | 622,663 |
| Events in quadrant D | 5,766,219 | 475,093 |
| Mode M9 | |||
|---|---|---|---|
| Quadrant | BADHDUFLAG | Total packets | Discarded packets |
| A | 0 | 26 | 0 |
| B | 0 | 26 | 0 |
| C | 0 | 26 | 0 |
| D | 0 | 27 | 0 |
| Mode M0 | |||
|---|---|---|---|
| Quadrant | BADHDUFLAG | Total packets | Discarded packets |
| A | 0 | 11633 | 3 |
| B | 0 | 12236 | 2 |
| C | 0 | 11736 | 2 |
| D | 0 | 20900 | 2 |
| Mode SS | |||
|---|---|---|---|
| Quadrant | BADHDUFLAG | Total packets | Discarded packets |
| A | 0 | 112 | 0 |
| B | 0 | 112 | 0 |
| C | 0 | 112 | 0 |
| D | 0 | 112 | 0 |
| Quadrant | Total seconds | Saturated seconds | Saturation percentage |
|---|---|---|---|
| A | 5421 | 14 | 0.258255% |
| B | 5421 | 104 | 1.918465% |
| C | 5421 | 40 | 0.737871% |
| D | 5421 | 1283 | 23.667220% |
Noise dominated data is calculated using 1-second bins in cleaned event files. If a bin has >2000 counts, and if more than 50% of those come from <1% of pixels, then it is considered to be noise-dominated and hence unusable.
| Quadrant | # 1 sec bins | Bins with >0 counts | Bins with >2000 counts | High rate bins dominated by noise | Noise dominated (total time) | Noise dominated (detector-on time) | Marked lightcurve |
|---|---|---|---|---|---|---|---|
| A | 7155 | 5422 | 7 | 7 | 0.10% | 0.13% | 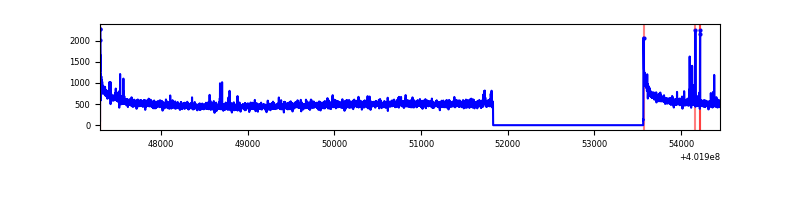 |
| B | 7155 | 5422 | 89 | 89 | 1.24% | 1.64% | 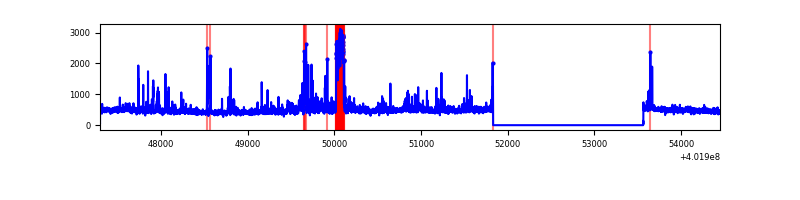 |
| C | 7155 | 5422 | 39 | 39 | 0.55% | 0.72% | 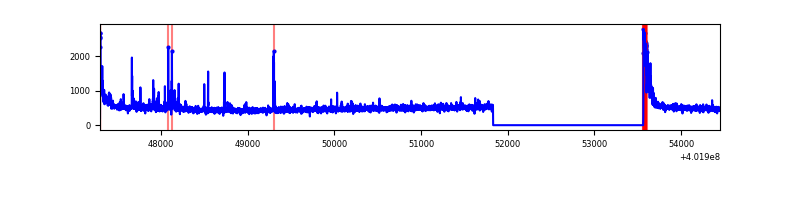 |
| D | 7155 | 5422 | 1052 | 1052 | 14.70% | 19.40% | 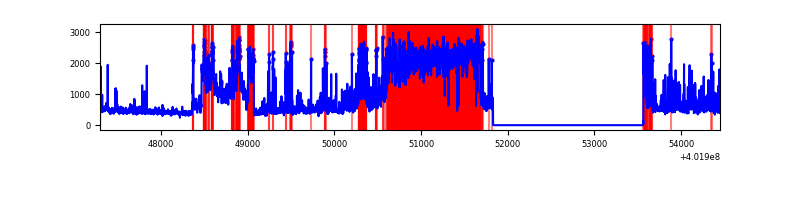 |
Top three noisy pixels from each quadrant. If the there are fewer than three noisy pixels in the level2.evt file, extra rows are filled as -1
| Pixel properties | Quadrant properties | ||||||
|---|---|---|---|---|---|---|---|
| Quadrant | DetID | PixID | Counts | Sigma | Mean | Median | Sigma |
| A | 10 | 83 | 348246 | 2832.18 | 615 | 603 | 122.7 |
| A | 9 | 143 | 34555 | 276.6 | 615 | 603 | 122.7 |
| A | 12 | 189 | 25418 | 202.16 | 615 | 603 | 122.7 |
| B | 5 | 172 | 338695 | 2938.25 | 604 | 589 | 115.1 |
| B | 0 | 229 | 96868 | 836.7 | 604 | 589 | 115.1 |
| B | 0 | 213 | 77347 | 667.05 | 604 | 589 | 115.1 |
| C | 15 | 214 | 246033 | 1796.74 | 588 | 591 | 136.6 |
| C | 0 | 10 | 184408 | 1345.62 | 588 | 591 | 136.6 |
| C | 1 | 23 | 82271 | 597.93 | 588 | 591 | 136.6 |
| D | 13 | 249 | 2103902 | 17749.16 | 485 | 471 | 118.5 |
| D | 12 | 227 | 645628 | 5443.96 | 485 | 471 | 118.5 |
| D | 1 | 52 | 326372 | 2750.02 | 485 | 471 | 118.5 |
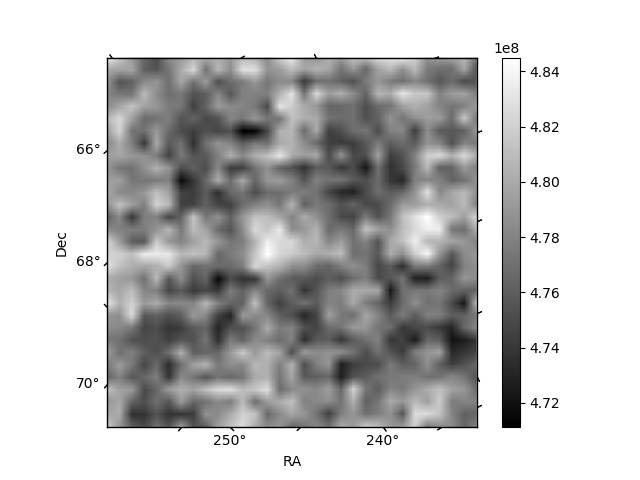
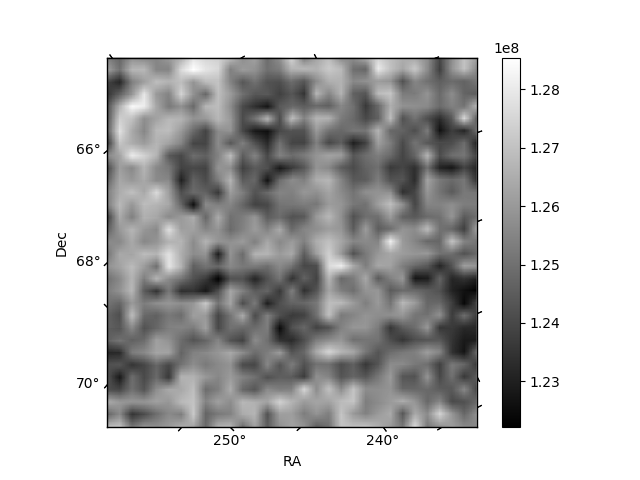
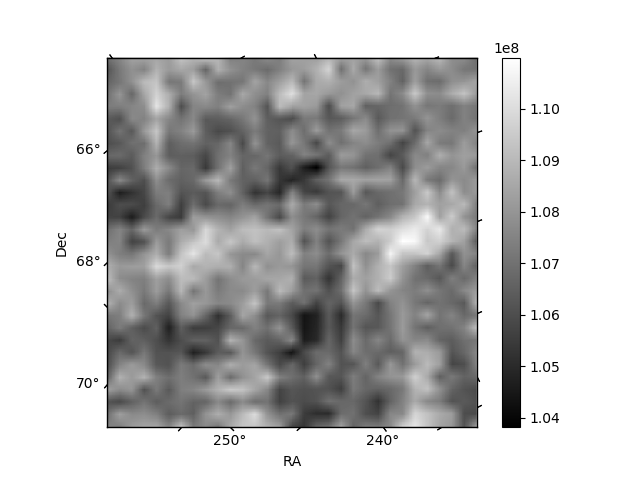
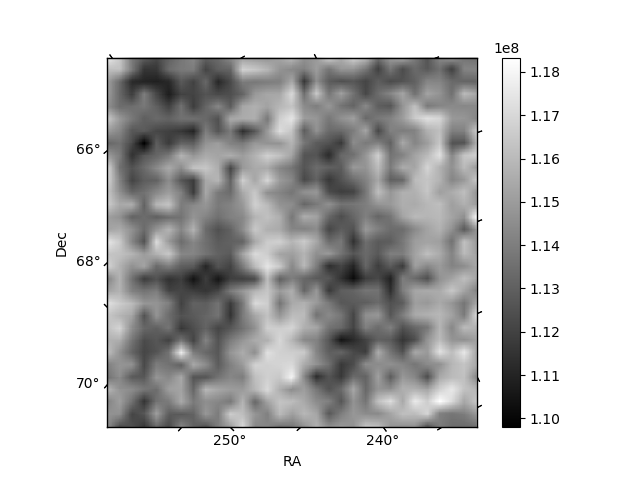
Histogram calculated using DETX and DETY for each event in the final _common_clean file
| Quadrant A | 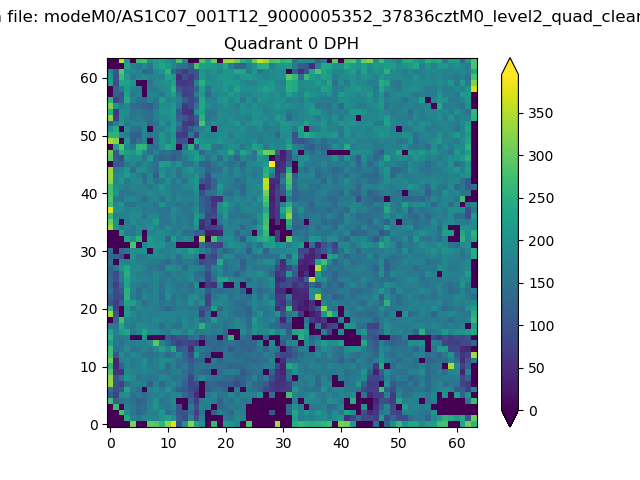 |
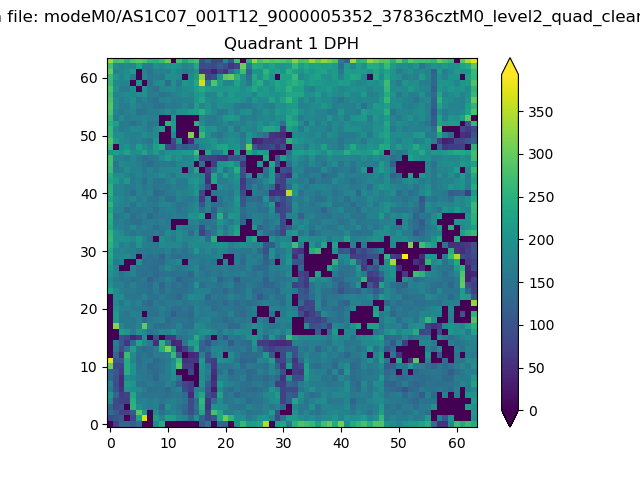 |
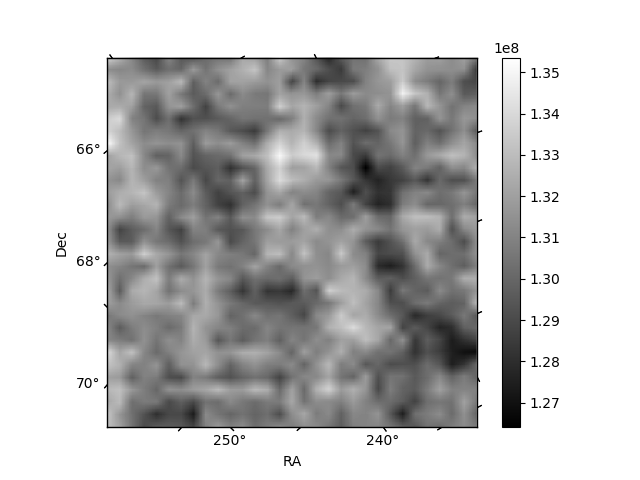
Quadrant B |
|---|---|---|---|
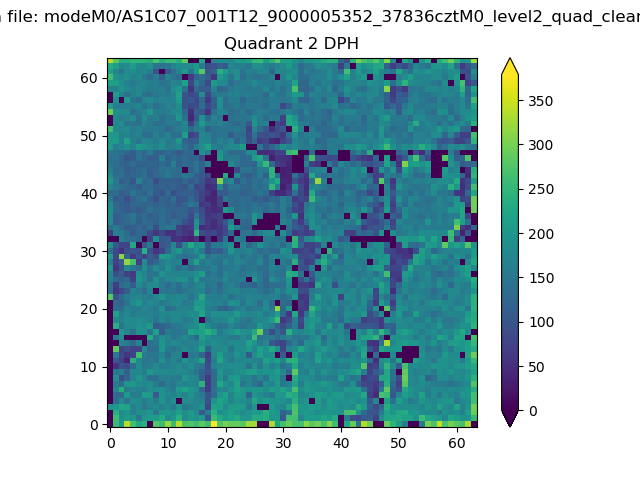
| Quadrant D | 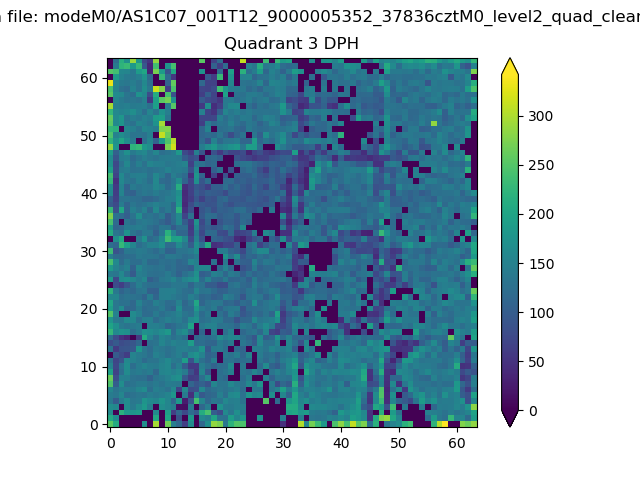 |
 |
Quadrant C |
| Plot type | Count rate plots | Images |
|---|---|---|
| Comparison with Poisson distribution Blue bars denote a histogram of data divided into 1 sec bins. Red curve is a Poisson curve with rate = median count rate of data. |
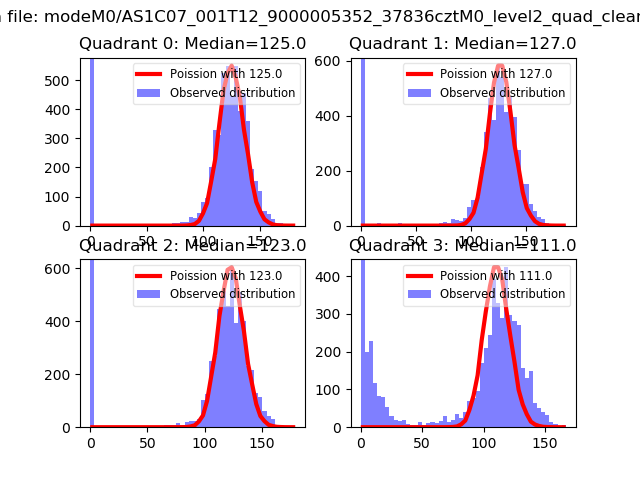 |
 |
| Quadrant-wise count rates Data is divided into 100 sec bins |
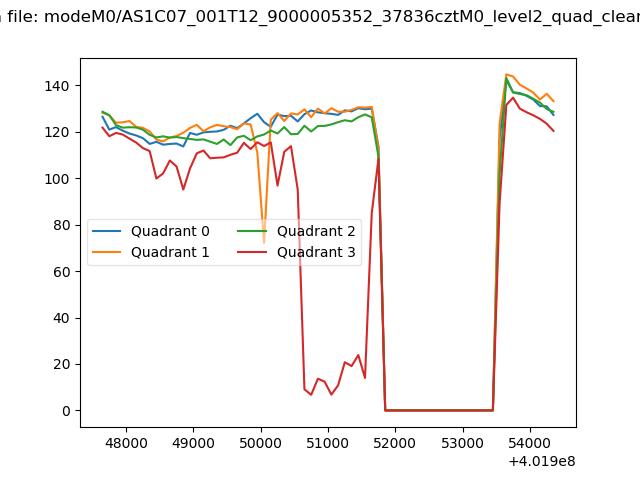 |
|
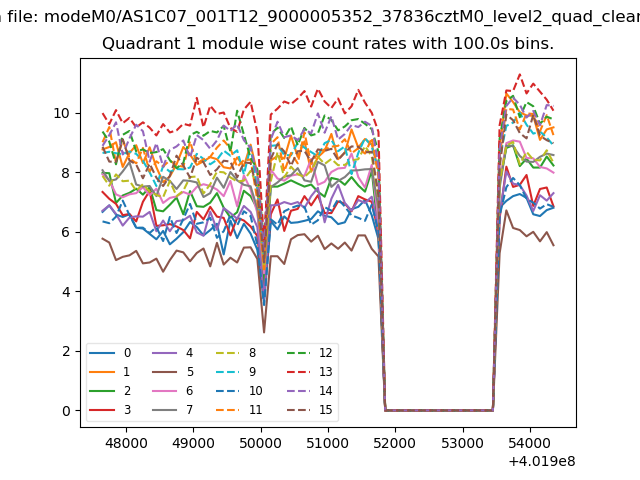
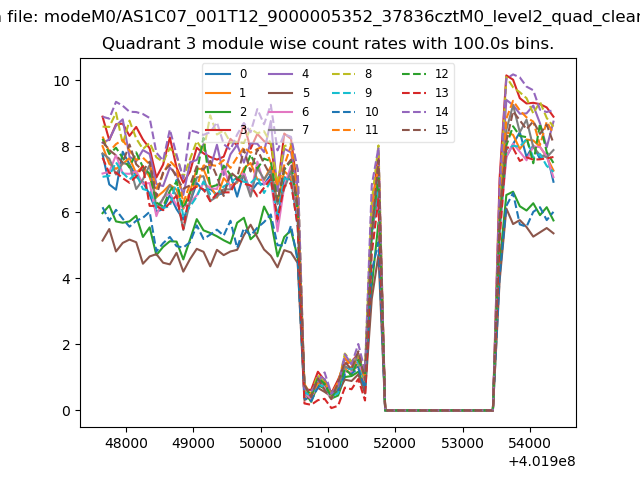
| Module-wise count rates for Quadrant A Data is divided into 100 sec bins |
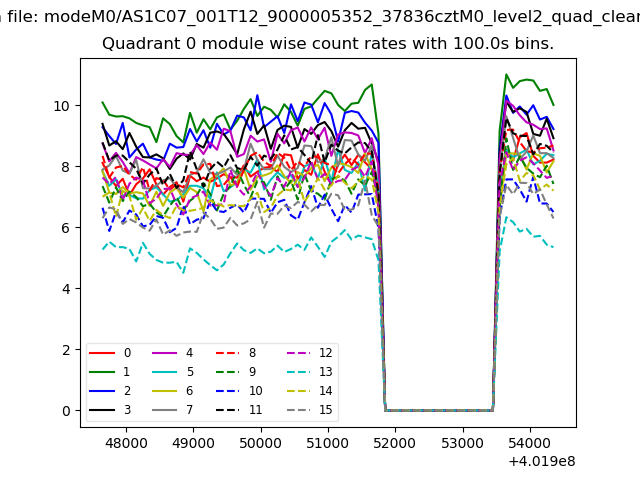 |
 |
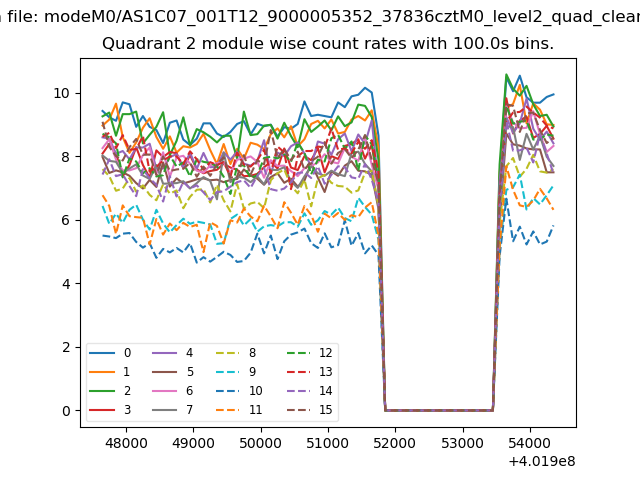
| Module-wise count rates for Quadrant B Data is divided into 100 sec bins |
 |
 |
| Module-wise count rates for Quadrant C Data is divided into 100 sec bins |
 |
 |
| Module-wise count rates for Quadrant D Data is divided into 100 sec bins |
 |
 |
| Parameter | Plot |
|---|---|
| CZT HV Monitor | 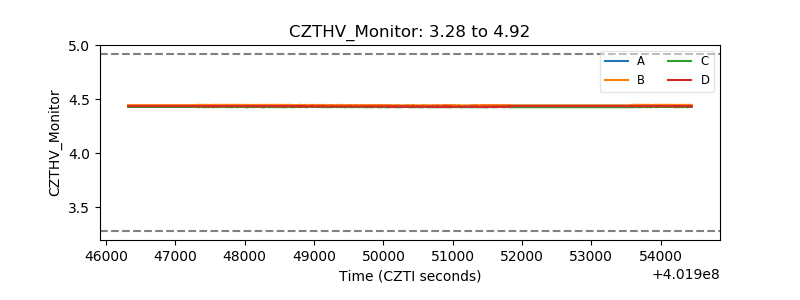 |
| D_VDD | 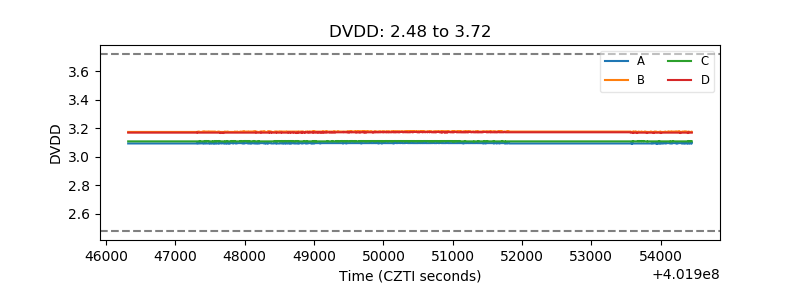 |
| Temperature 1 | 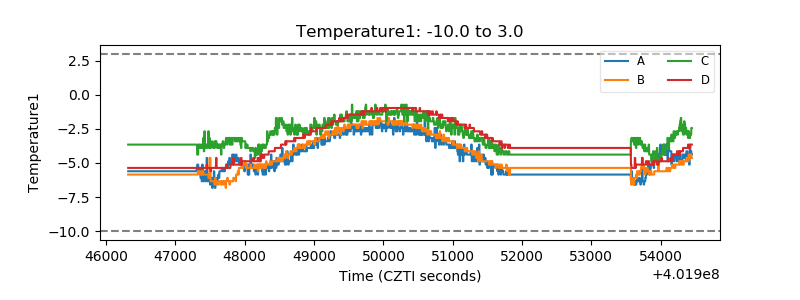 |
| Veto HV Monitor | 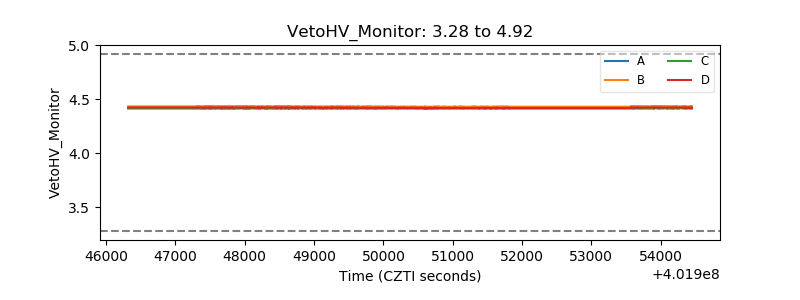 |
| Veto LLD | 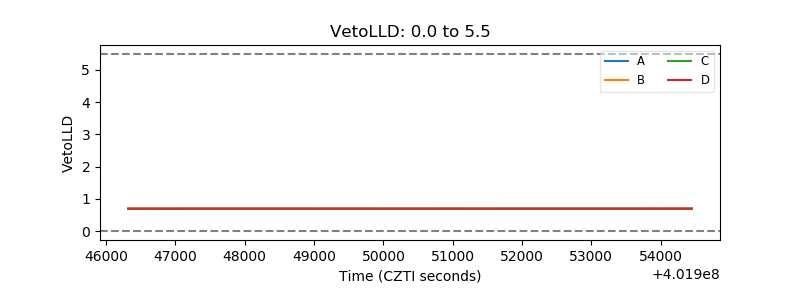 |
| Alpha Counter | 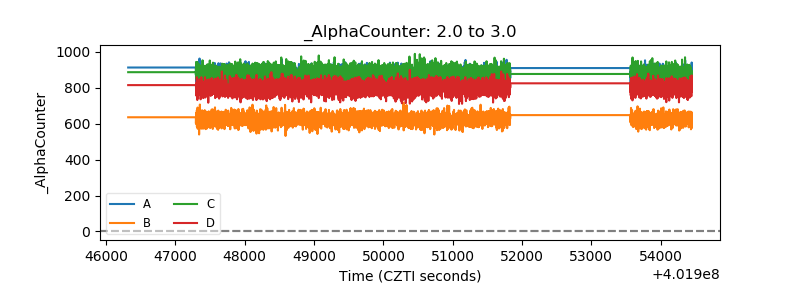 |
| _CPM_Rate | 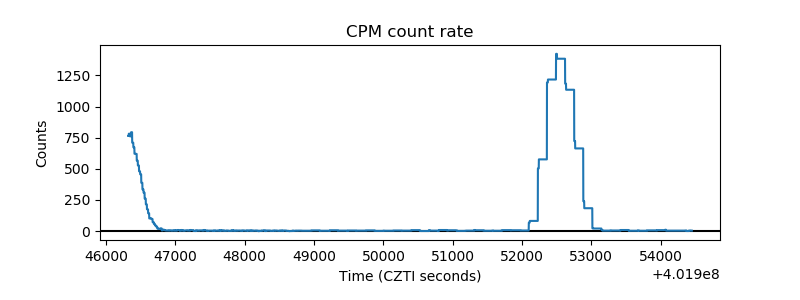 |
| CZT Counter | 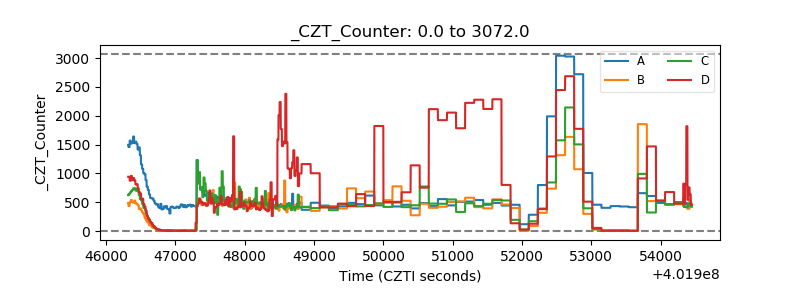 |
| +2.5 Volts monitor | 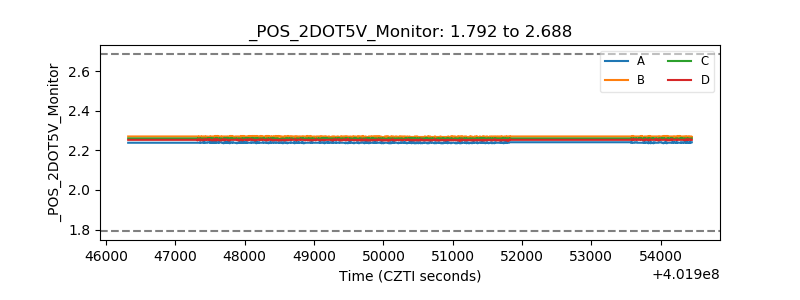 |
| +5 Volts monitor | 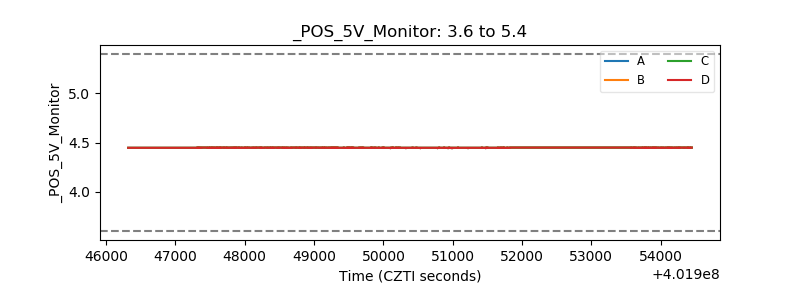 |
| _ROLL_ROT | 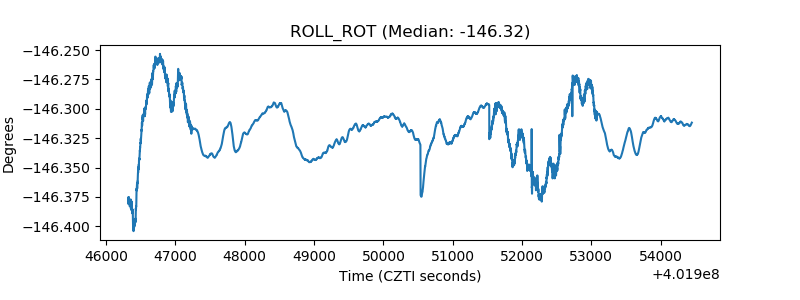 |
| _Roll_DEC | 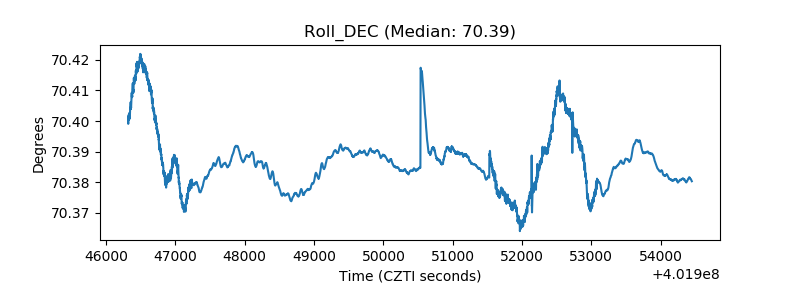 |
| _Roll_RA | 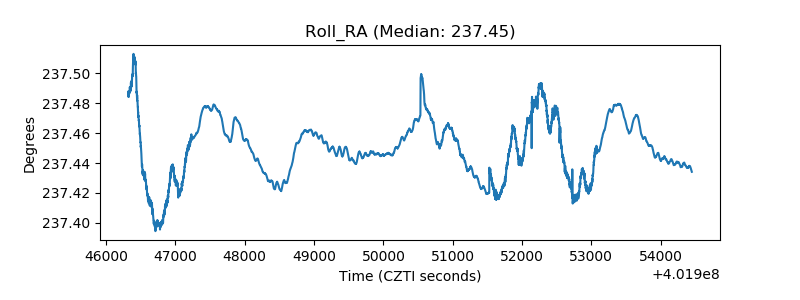 |
| Veto Counter | 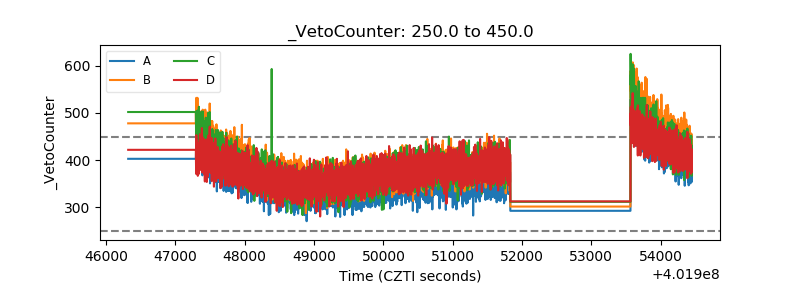 |