| Param | Original file | Final file |
|---|---|---|
| Filename | modeM0/AS1C07_001T12_9000005352_37837cztM0_level2.evt | modeM0/AS1C07_001T12_9000005352_37837cztM0_level2_quad_clean.evt |
| Size (bytes) | 460,704,960 | 73,218,240 |
| Size | 439.4 MB | 69.8 MB |
| Events in quadrant A | 2,812,753 | 486,953 |
| Events in quadrant B | 2,763,542 | 492,506 |
| Events in quadrant C | 2,853,126 | 454,040 |
| Events in quadrant D | 5,167,003 | 416,457 |
| Mode M9 | |||
|---|---|---|---|
| Quadrant | BADHDUFLAG | Total packets | Discarded packets |
| A | 0 | 22 | 0 |
| B | 0 | 22 | 0 |
| C | 0 | 22 | 0 |
| D | 0 | 23 | 0 |
| Mode M0 | |||
|---|---|---|---|
| Quadrant | BADHDUFLAG | Total packets | Discarded packets |
| A | 0 | 11478 | 3 |
| B | 0 | 11496 | 2 |
| C | 0 | 11623 | 2 |
| D | 0 | 18846 | 2 |
| Mode SS | |||
|---|---|---|---|
| Quadrant | BADHDUFLAG | Total packets | Discarded packets |
| A | 0 | 106 | 0 |
| B | 0 | 106 | 0 |
| C | 0 | 106 | 0 |
| D | 0 | 106 | 0 |
| Quadrant | Total seconds | Saturated seconds | Saturation percentage |
|---|---|---|---|
| A | 5245 | 18 | 0.343184% |
| B | 5245 | 24 | 0.457579% |
| C | 5245 | 64 | 1.220210% |
| D | 5245 | 942 | 17.959962% |
Noise dominated data is calculated using 1-second bins in cleaned event files. If a bin has >2000 counts, and if more than 50% of those come from <1% of pixels, then it is considered to be noise-dominated and hence unusable.
| Quadrant | # 1 sec bins | Bins with >0 counts | Bins with >2000 counts | High rate bins dominated by noise | Noise dominated (total time) | Noise dominated (detector-on time) | Marked lightcurve |
|---|---|---|---|---|---|---|---|
| A | 7128 | 5246 | 12 | 12 | 0.17% | 0.23% | 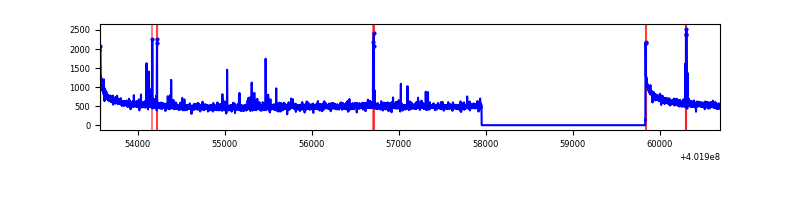 |
| B | 7128 | 5246 | 11 | 11 | 0.15% | 0.21% | 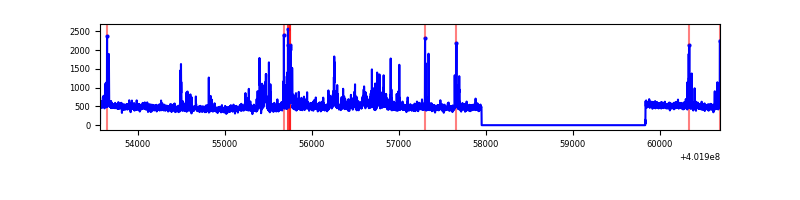 |
| C | 7128 | 5246 | 64 | 64 | 0.90% | 1.22% | 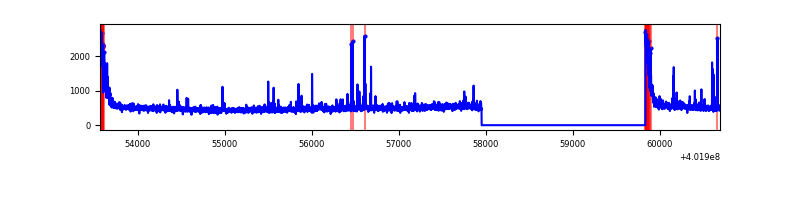 |
| D | 7128 | 5246 | 914 | 914 | 12.82% | 17.42% | 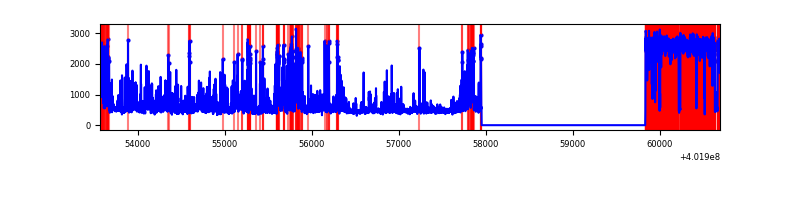 |
Top three noisy pixels from each quadrant. If the there are fewer than three noisy pixels in the level2.evt file, extra rows are filled as -1
| Pixel properties | Quadrant properties | ||||||
|---|---|---|---|---|---|---|---|
| Quadrant | DetID | PixID | Counts | Sigma | Mean | Median | Sigma |
| A | 10 | 83 | 343334 | 2784.9 | 612 | 600 | 123.1 |
| A | 9 | 143 | 65807 | 529.84 | 612 | 600 | 123.1 |
| A | 12 | 189 | 18755 | 147.52 | 612 | 600 | 123.1 |
| B | 5 | 172 | 138048 | 1202.0 | 604 | 587 | 114.4 |
| B | 0 | 229 | 66985 | 580.6 | 604 | 587 | 114.4 |
| B | 0 | 213 | 60289 | 522.05 | 604 | 587 | 114.4 |
| C | 15 | 214 | 237443 | 1776.42 | 578 | 582 | 133.3 |
| C | 0 | 10 | 224984 | 1682.98 | 578 | 582 | 133.3 |
| C | 1 | 23 | 90641 | 675.43 | 578 | 582 | 133.3 |
| D | 1 | 52 | 2389907 | 18732.91 | 529 | 515 | 127.6 |
| D | 2 | 249 | 283530 | 2218.85 | 529 | 515 | 127.6 |
| D | 13 | 249 | 154359 | 1206.14 | 529 | 515 | 127.6 |
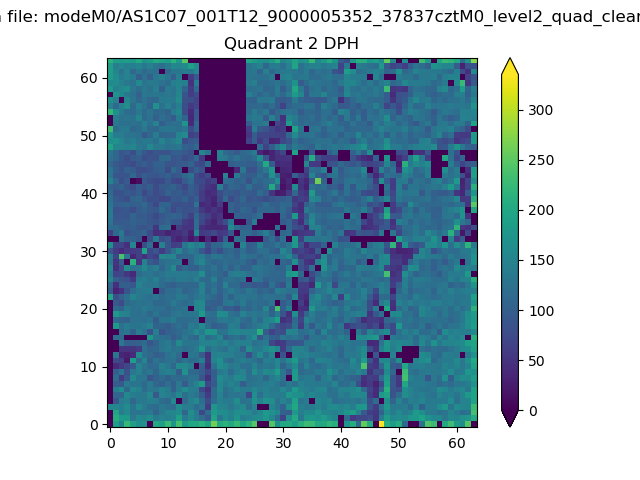
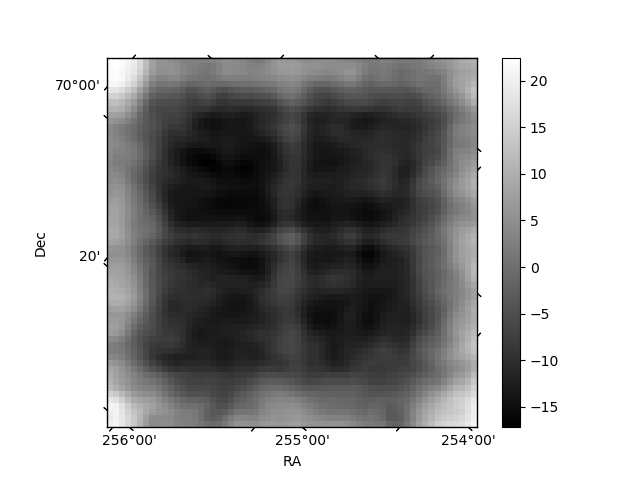
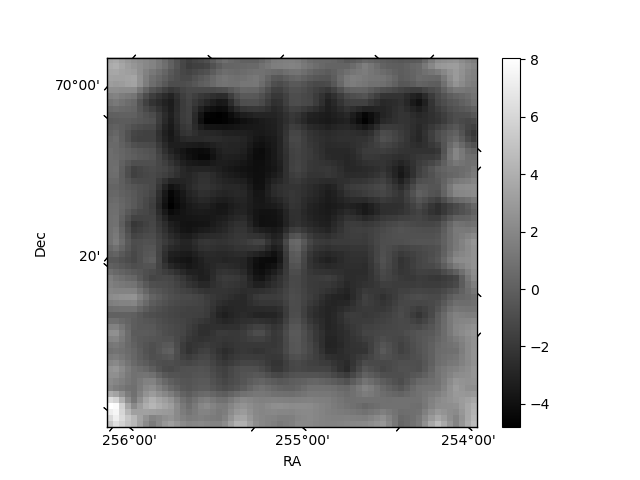
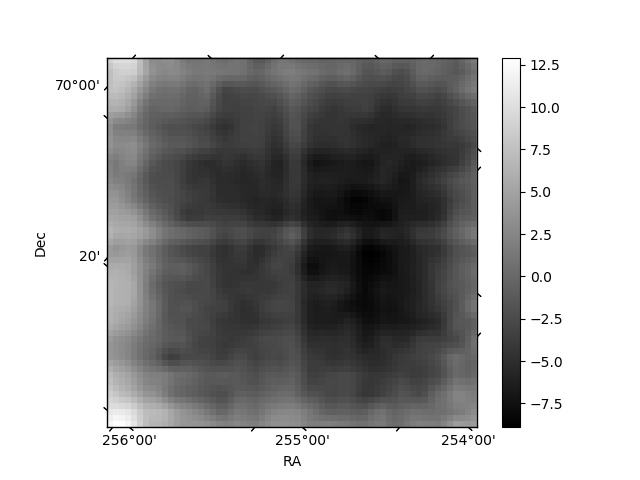
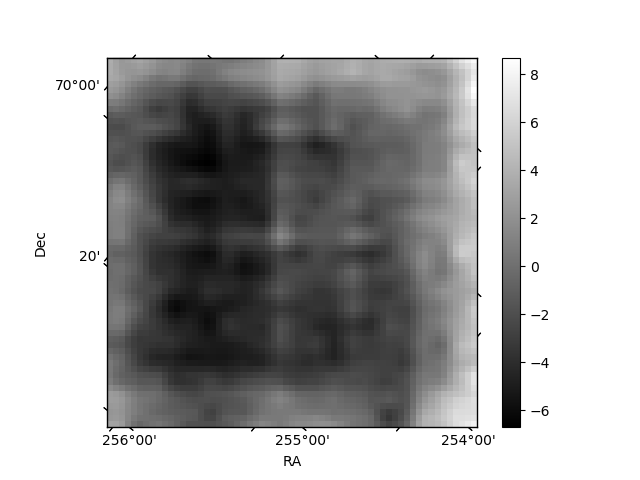
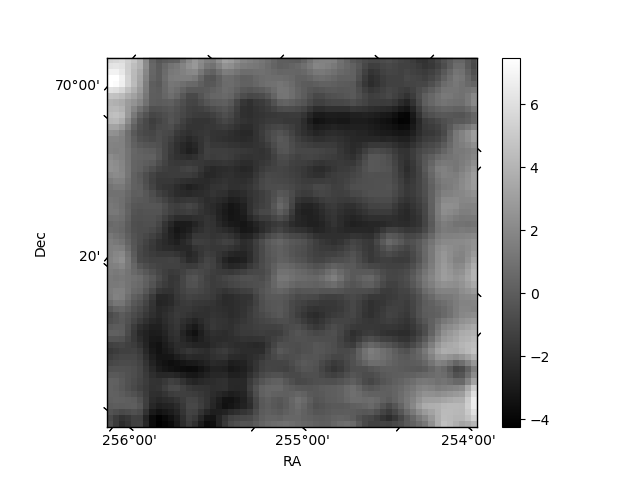
Histogram calculated using DETX and DETY for each event in the final _common_clean file
| Quadrant A | 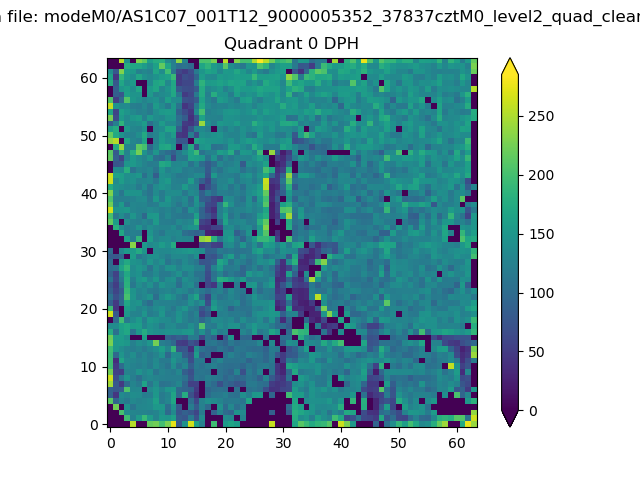 |
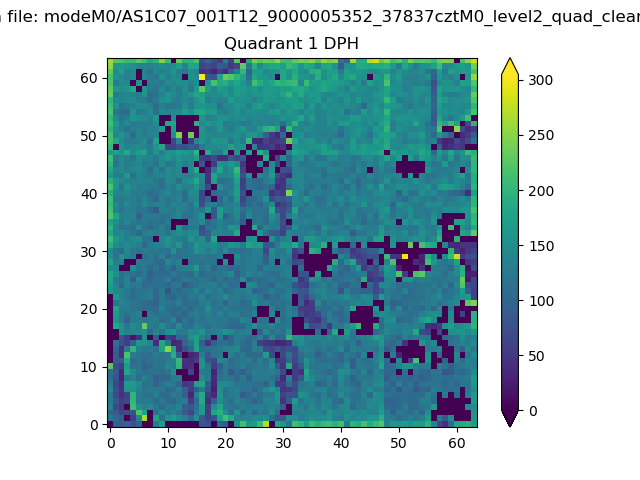 |
Quadrant B |
|---|---|---|---|
| Quadrant D | 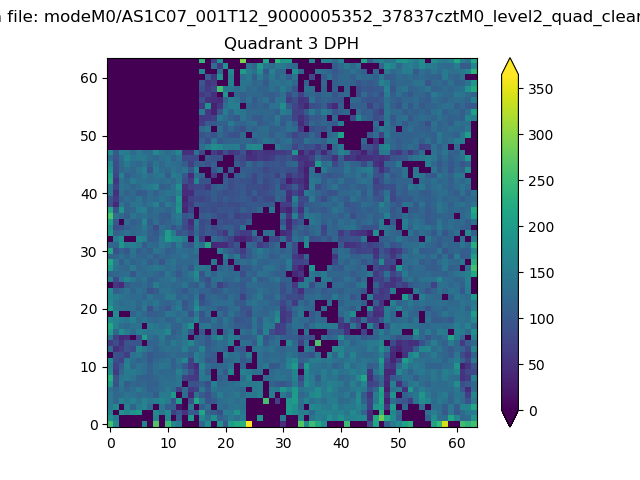 |
 |
Quadrant C |
| Plot type | Count rate plots | Images |
|---|---|---|
| Comparison with Poisson distribution Blue bars denote a histogram of data divided into 1 sec bins. Red curve is a Poisson curve with rate = median count rate of data. |
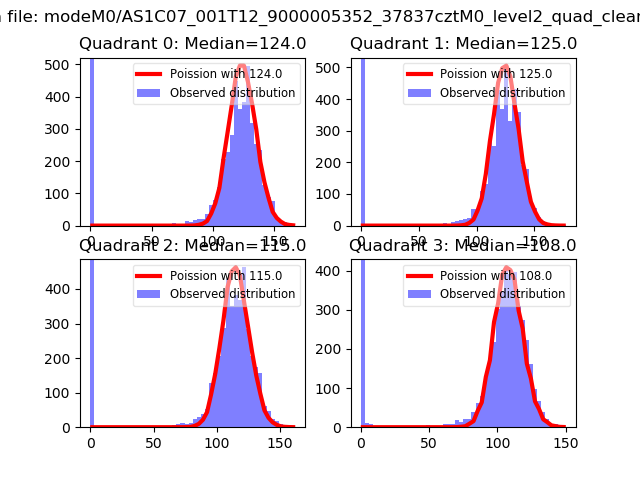 |
 |
| Quadrant-wise count rates Data is divided into 100 sec bins |
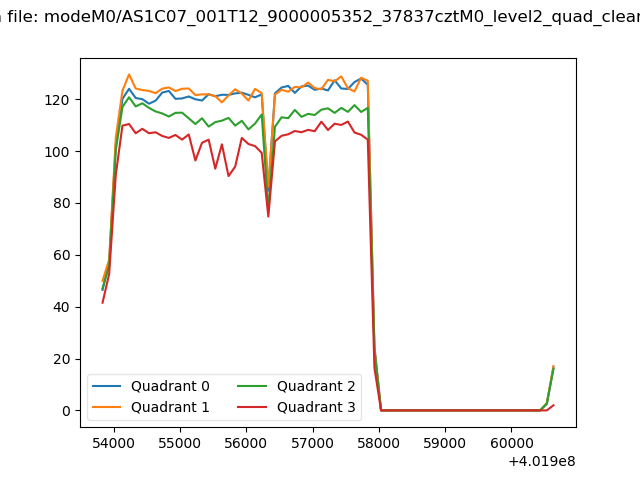 |
|
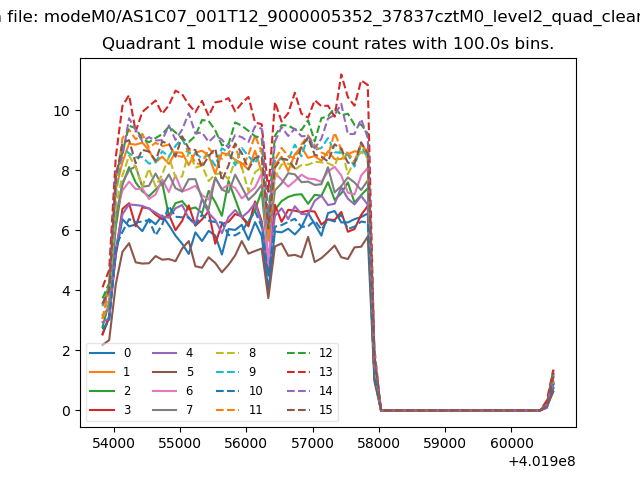
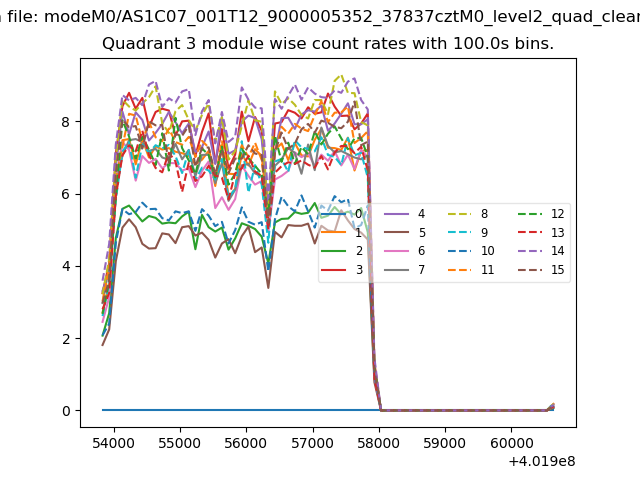
| Module-wise count rates for Quadrant A Data is divided into 100 sec bins |
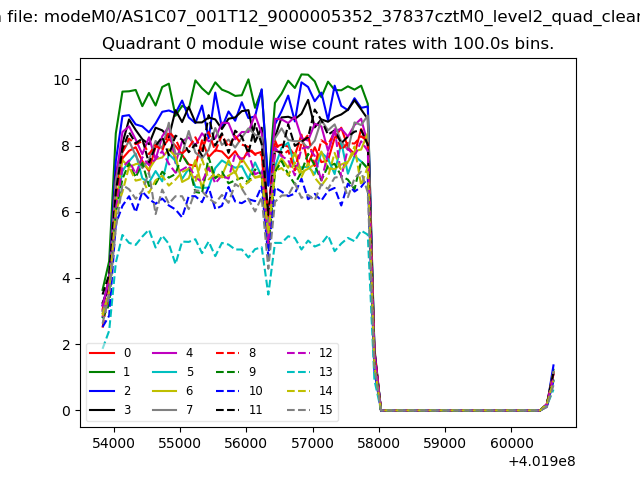 |
 |
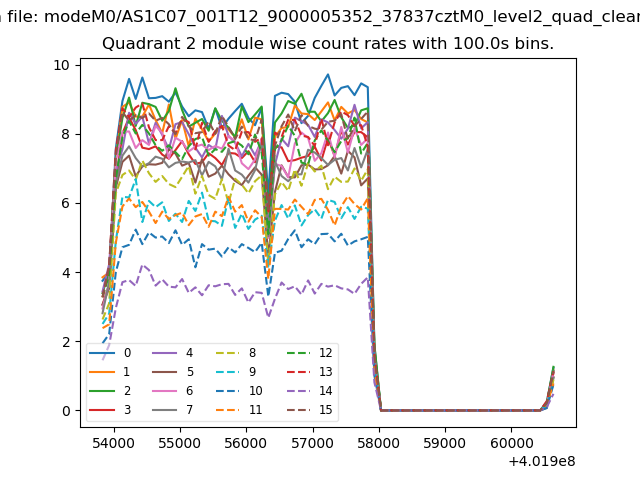
| Module-wise count rates for Quadrant B Data is divided into 100 sec bins |
 |
 |
| Module-wise count rates for Quadrant C Data is divided into 100 sec bins |
 |
 |
| Module-wise count rates for Quadrant D Data is divided into 100 sec bins |
 |
 |
| Parameter | Plot |
|---|---|
| CZT HV Monitor | 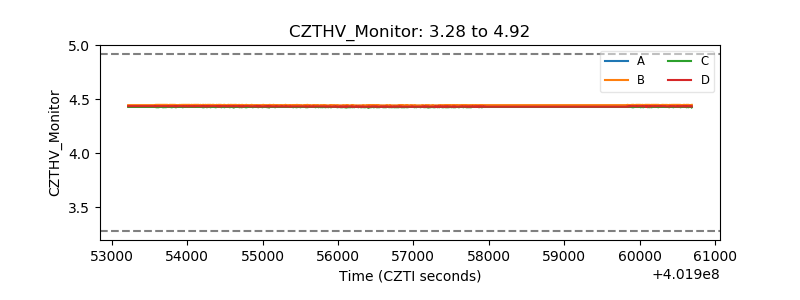 |
| D_VDD | 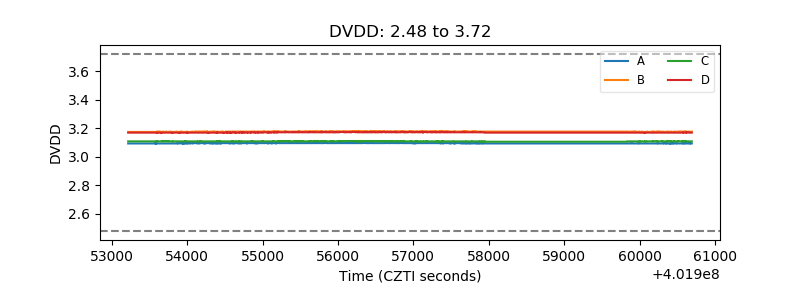 |
| Temperature 1 | 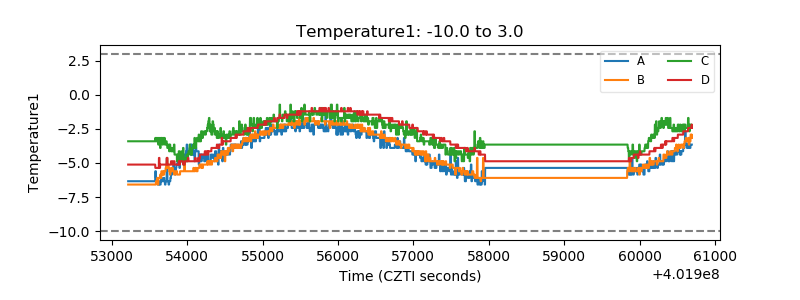 |
| Veto HV Monitor | 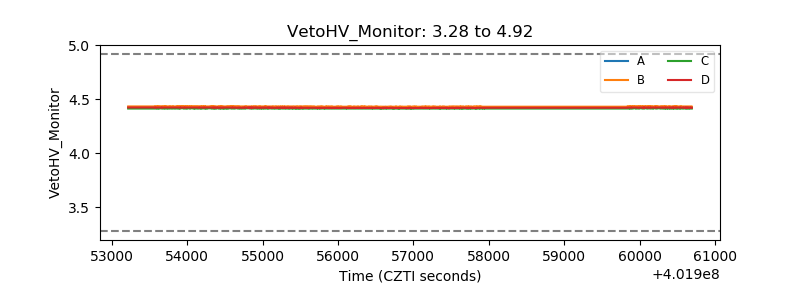 |
| Veto LLD | 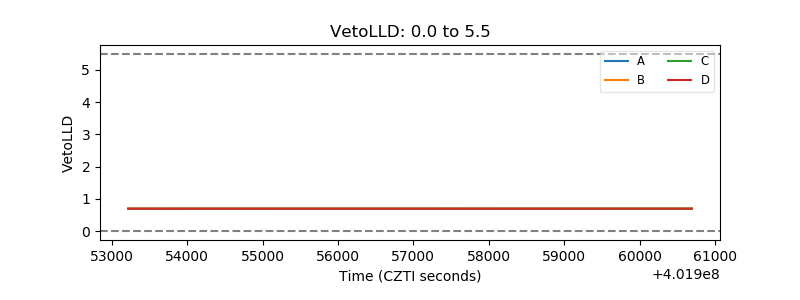 |
| Alpha Counter | 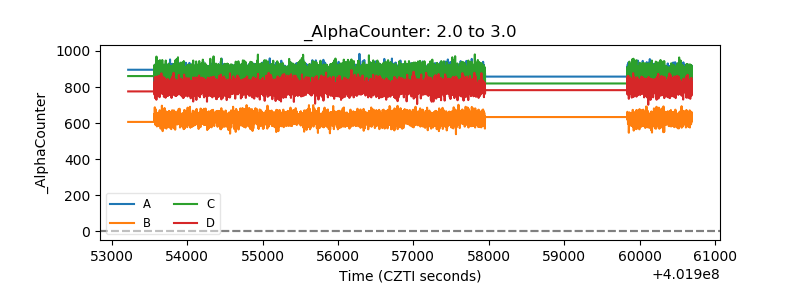 |
| _CPM_Rate |  |
| CZT Counter | 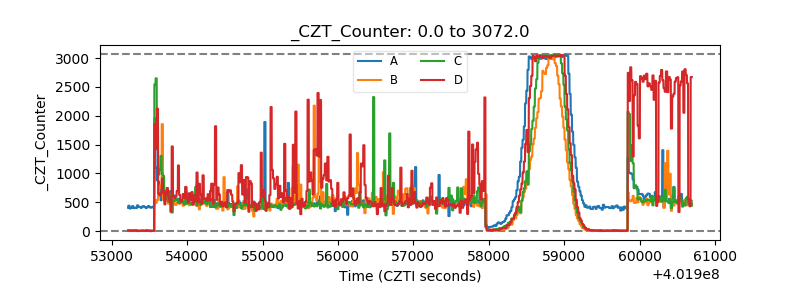 |
| +2.5 Volts monitor | 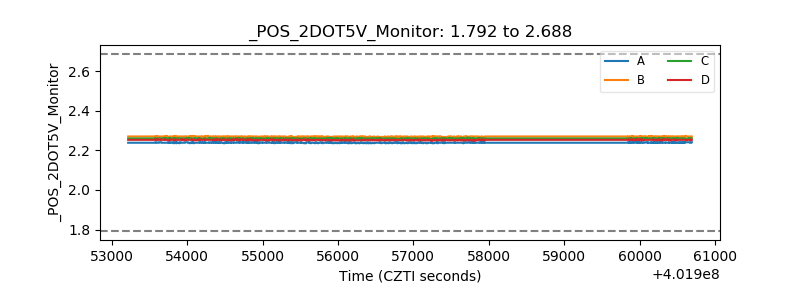 |
| +5 Volts monitor | 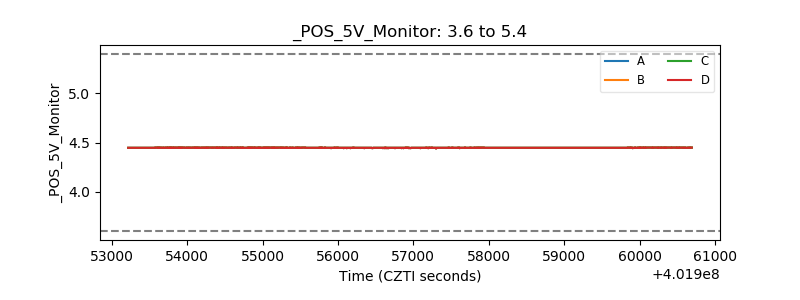 |
| _ROLL_ROT | 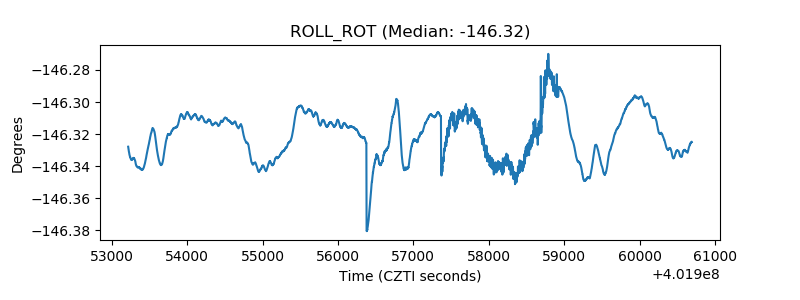 |
| _Roll_DEC | 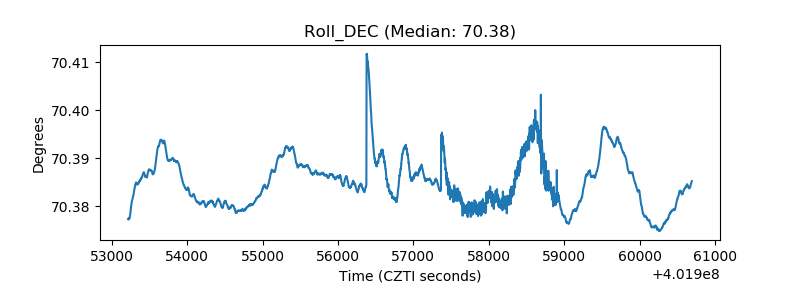 |
| _Roll_RA | 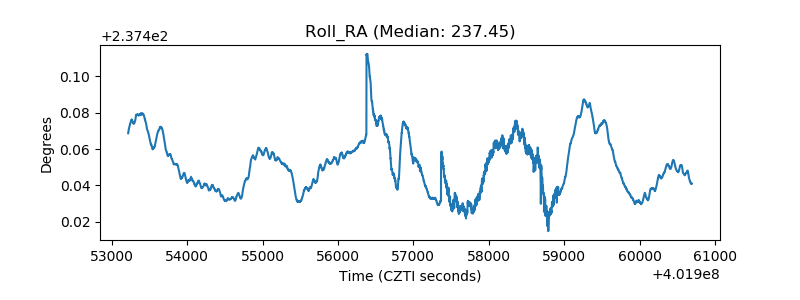 |
| Veto Counter | 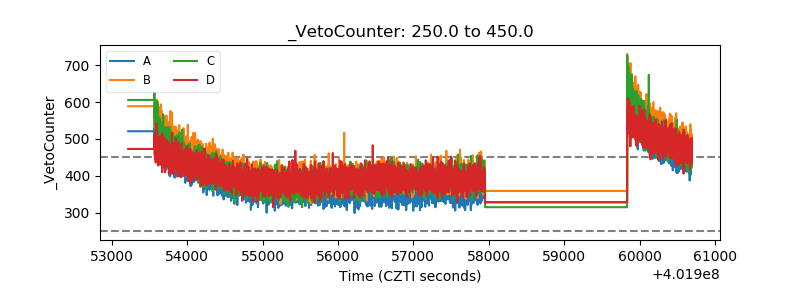 |