| Param | Original file | Final file |
|---|---|---|
| Filename | modeM0/AS1C07_001T12_9000005352_37838cztM0_level2.evt | modeM0/AS1C07_001T12_9000005352_37838cztM0_level2_quad_clean.evt |
| Size (bytes) | 620,951,040 | 90,843,840 |
| Size | 592.2 MB | 86.6 MB |
| Events in quadrant A | 2,776,161 | 697,832 |
| Events in quadrant B | 2,694,368 | 702,630 |
| Events in quadrant C | 2,855,581 | 657,895 |
| Events in quadrant D | 10,136,206 | 336,510 |
| Mode M9 | |||
|---|---|---|---|
| Quadrant | BADHDUFLAG | Total packets | Discarded packets |
| A | 0 | 20 | 0 |
| B | 0 | 20 | 0 |
| C | 0 | 20 | 0 |
| D | 0 | 20 | 0 |
| Mode M0 | |||
|---|---|---|---|
| Quadrant | BADHDUFLAG | Total packets | Discarded packets |
| A | 0 | 11196 | 3 |
| B | 0 | 11065 | 2 |
| C | 0 | 11398 | 2 |
| D | 0 | 33604 | 2 |
| Mode SS | |||
|---|---|---|---|
| Quadrant | BADHDUFLAG | Total packets | Discarded packets |
| A | 0 | 104 | 0 |
| B | 0 | 104 | 0 |
| C | 0 | 104 | 0 |
| D | 0 | 104 | 0 |
| Quadrant | Total seconds | Saturated seconds | Saturation percentage |
|---|---|---|---|
| A | 5059 | 14 | 0.276735% |
| B | 5059 | 24 | 0.474402% |
| C | 5059 | 42 | 0.830204% |
| D | 5059 | 3530 | 69.776636% |
Noise dominated data is calculated using 1-second bins in cleaned event files. If a bin has >2000 counts, and if more than 50% of those come from <1% of pixels, then it is considered to be noise-dominated and hence unusable.
| Quadrant | # 1 sec bins | Bins with >0 counts | Bins with >2000 counts | High rate bins dominated by noise | Noise dominated (total time) | Noise dominated (detector-on time) | Marked lightcurve |
|---|---|---|---|---|---|---|---|
| A | 7062 | 5060 | 7 | 7 | 0.10% | 0.14% | 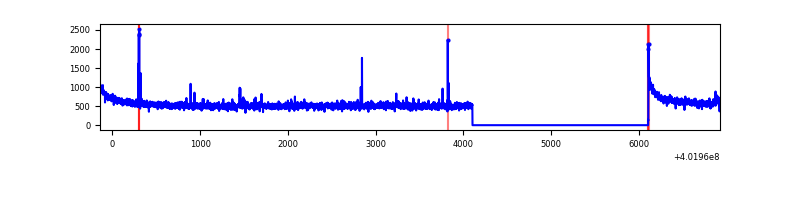 |
| B | 7062 | 5060 | 21 | 21 | 0.30% | 0.42% | 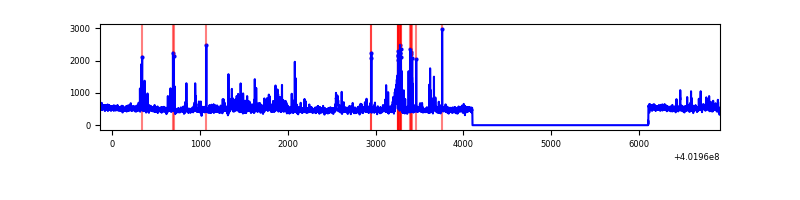 |
| C | 7062 | 5060 | 47 | 47 | 0.67% | 0.93% | 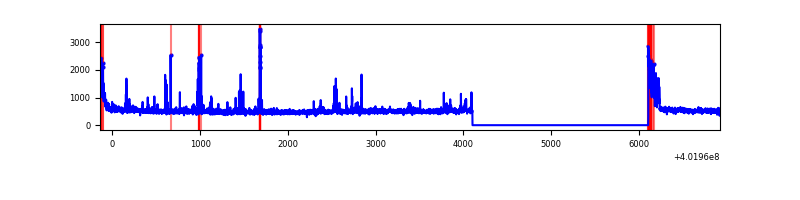 |
| D | 7062 | 5060 | 3395 | 3395 | 48.07% | 67.09% | 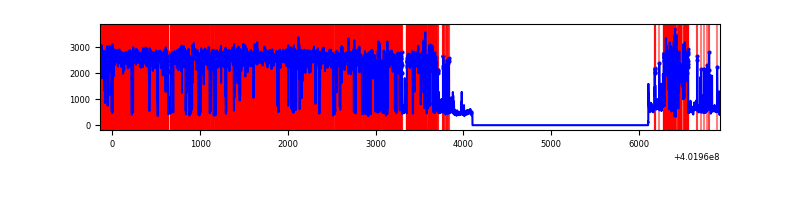 |
Top three noisy pixels from each quadrant. If the there are fewer than three noisy pixels in the level2.evt file, extra rows are filled as -1
| Pixel properties | Quadrant properties | ||||||
|---|---|---|---|---|---|---|---|
| Quadrant | DetID | PixID | Counts | Sigma | Mean | Median | Sigma |
| A | 10 | 83 | 321475 | 2613.97 | 612 | 602 | 122.8 |
| A | 9 | 143 | 27735 | 221.04 | 612 | 602 | 122.8 |
| A | 15 | 222 | 23234 | 184.37 | 612 | 602 | 122.8 |
| B | 5 | 172 | 162181 | 1438.72 | 599 | 586 | 112.3 |
| B | 0 | 229 | 61535 | 542.65 | 599 | 586 | 112.3 |
| B | 0 | 213 | 55488 | 488.81 | 599 | 586 | 112.3 |
| C | 15 | 214 | 230659 | 1750.73 | 573 | 576 | 131.4 |
| C | 0 | 10 | 187840 | 1424.91 | 573 | 576 | 131.4 |
| C | 1 | 23 | 181204 | 1374.42 | 573 | 576 | 131.4 |
| D | 1 | 52 | 7745333 | 90179.02 | 350 | 341 | 85.9 |
| D | 7 | 38 | 511886 | 5956.19 | 350 | 341 | 85.9 |
| D | 2 | 249 | 151947 | 1765.23 | 350 | 341 | 85.9 |
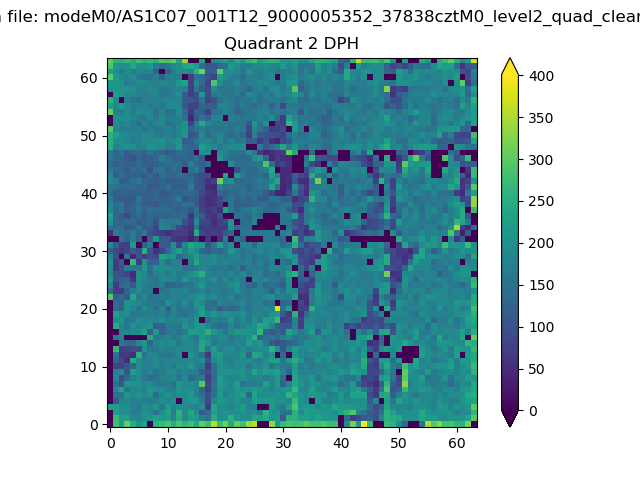
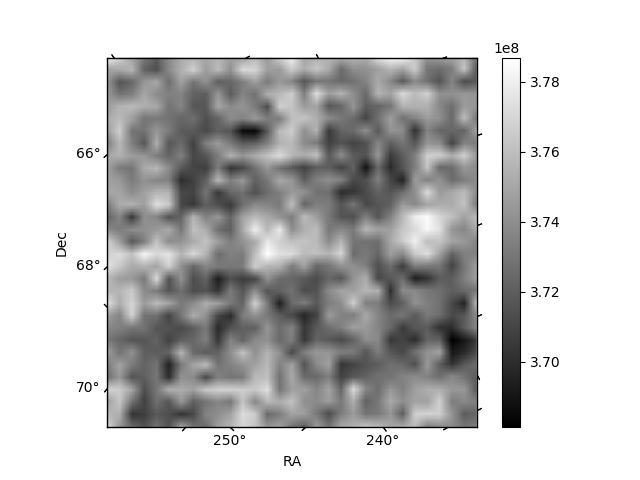
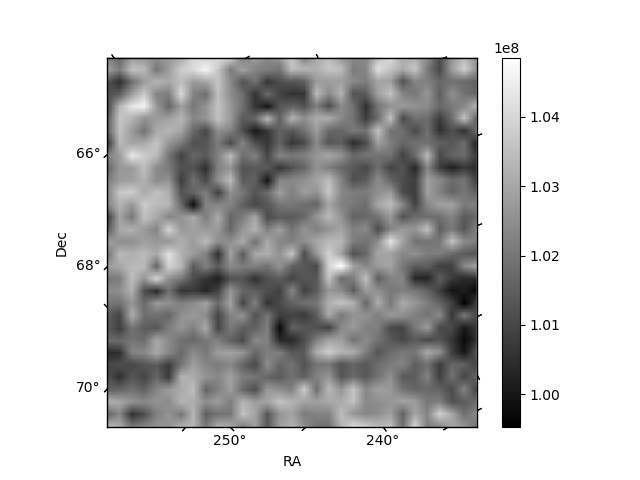
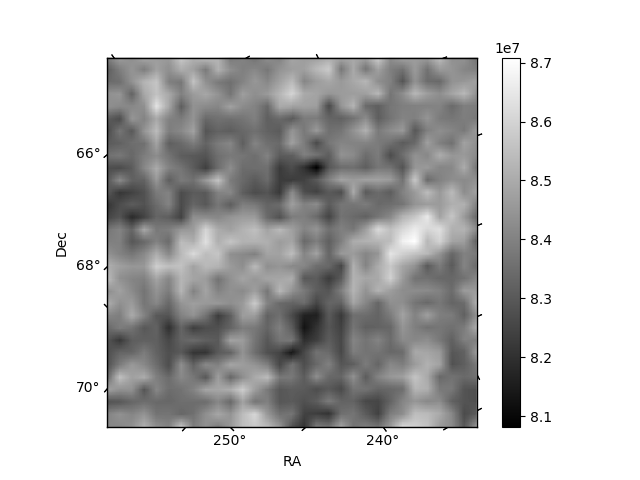
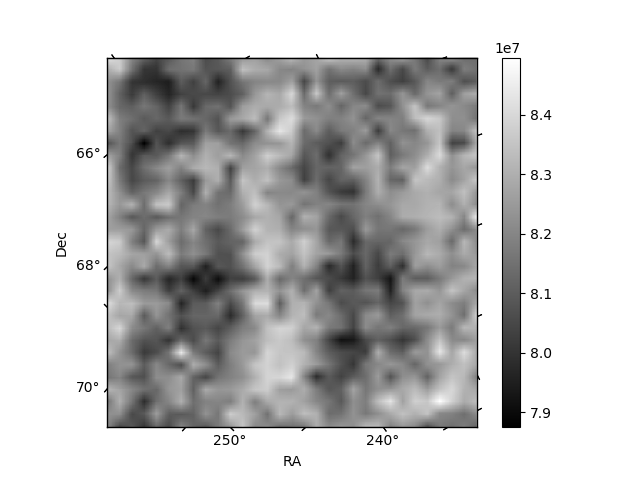
Histogram calculated using DETX and DETY for each event in the final _common_clean file
| Quadrant A | 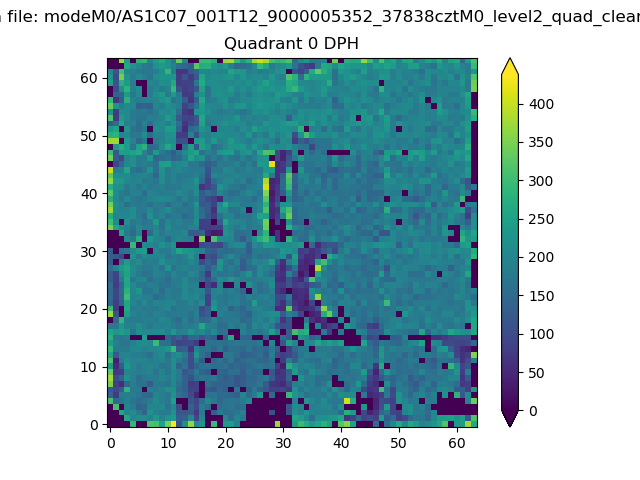 |
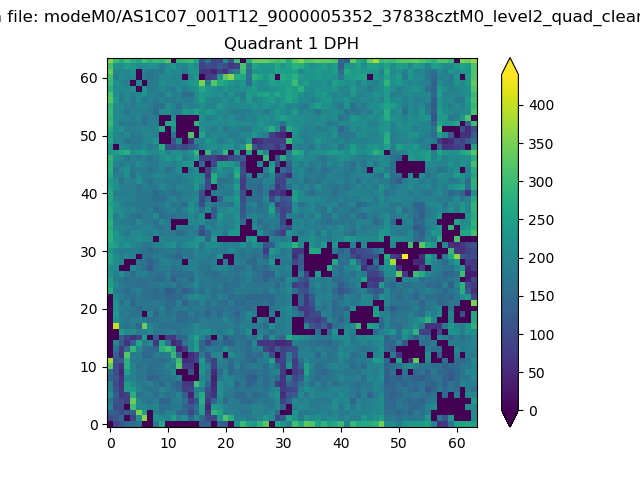 |
Quadrant B |
|---|---|---|---|
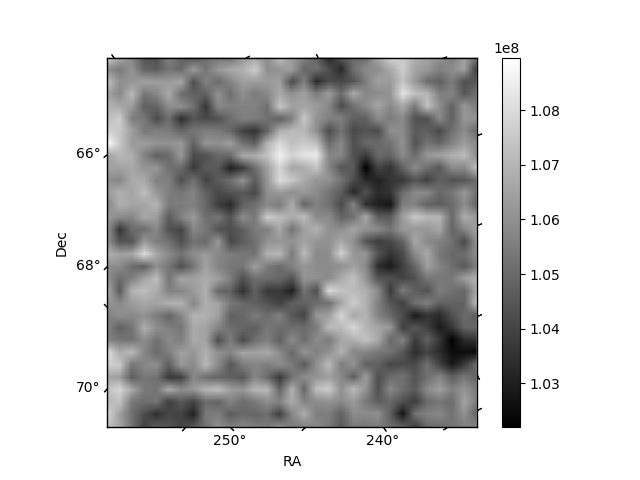
| Quadrant D | 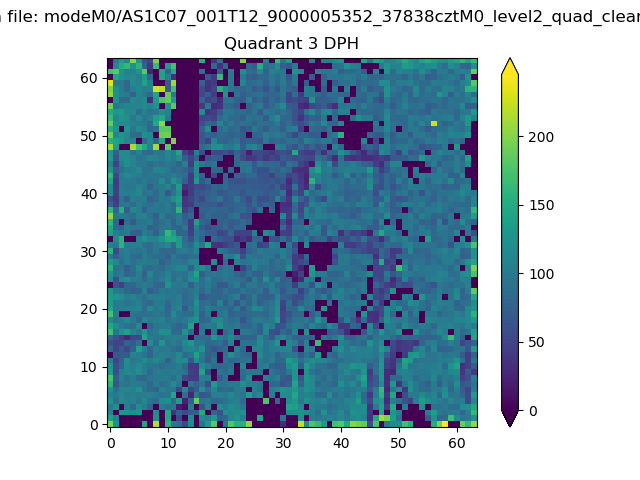 |
 |
Quadrant C |
| Plot type | Count rate plots | Images |
|---|---|---|
| Comparison with Poisson distribution Blue bars denote a histogram of data divided into 1 sec bins. Red curve is a Poisson curve with rate = median count rate of data. |
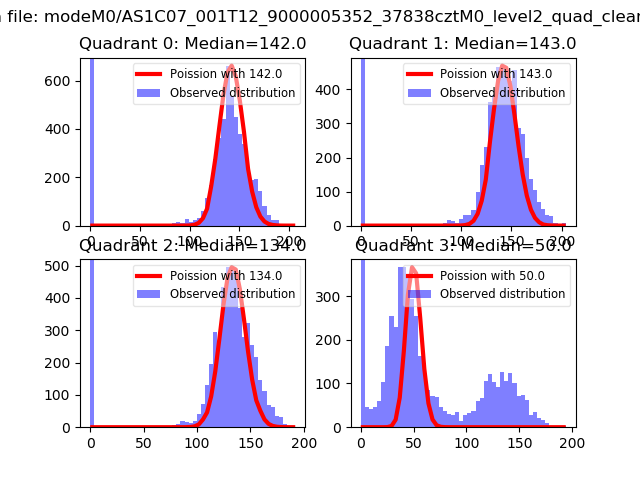 |
 |
| Quadrant-wise count rates Data is divided into 100 sec bins |
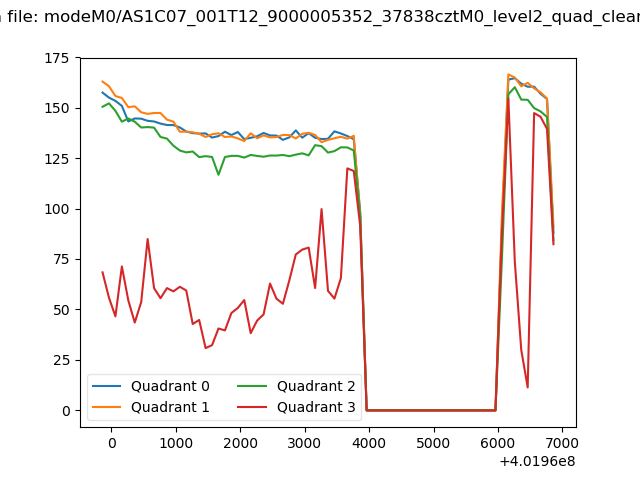 |
|
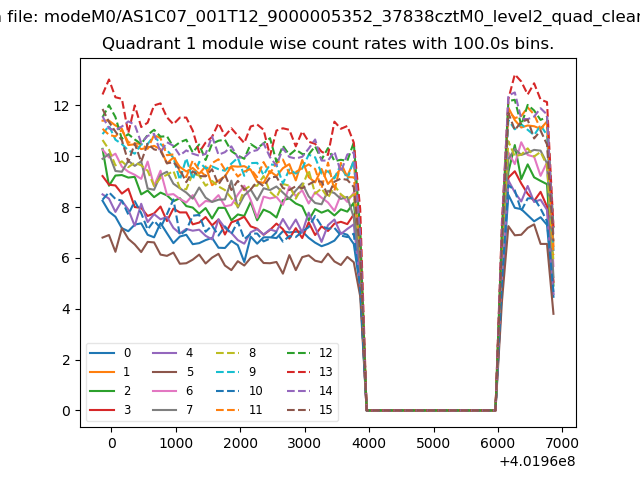
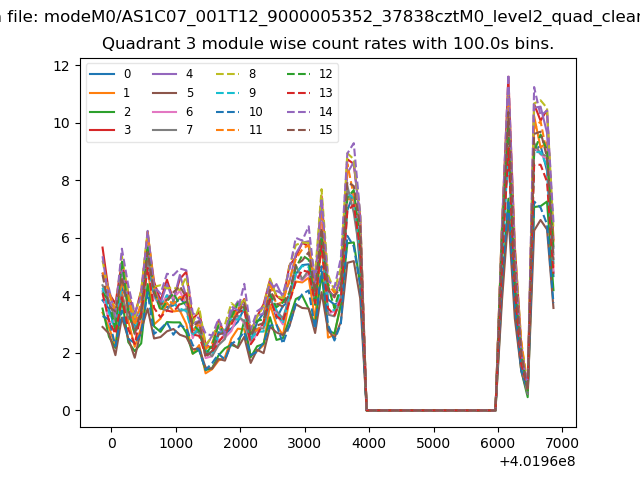
| Module-wise count rates for Quadrant A Data is divided into 100 sec bins |
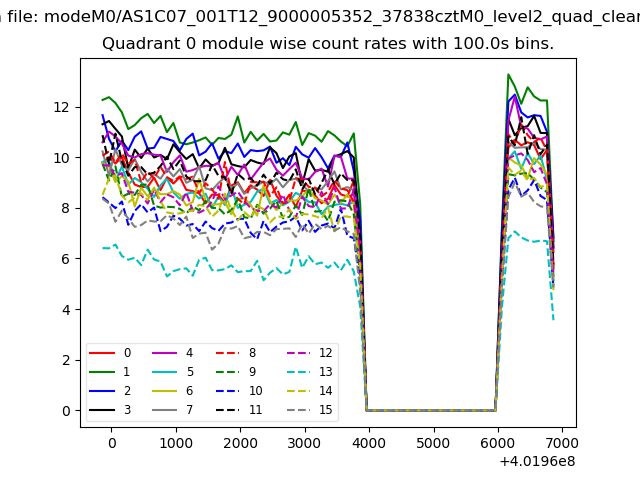 |
 |
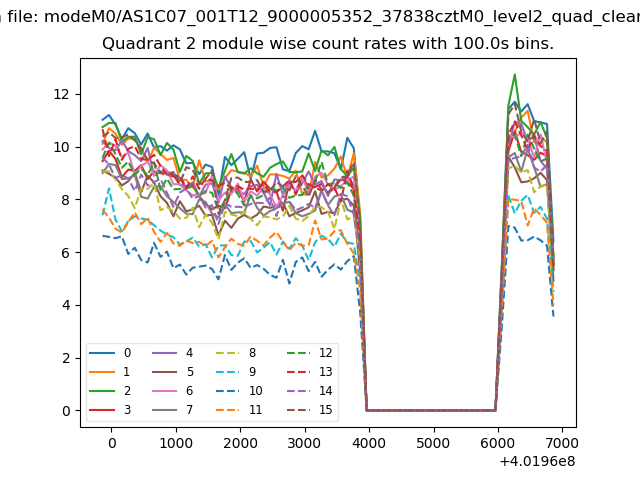
| Module-wise count rates for Quadrant B Data is divided into 100 sec bins |
 |
 |
| Module-wise count rates for Quadrant C Data is divided into 100 sec bins |
 |
 |
| Module-wise count rates for Quadrant D Data is divided into 100 sec bins |
 |
 |
| Parameter | Plot |
|---|---|
| CZT HV Monitor |  |
| D_VDD | 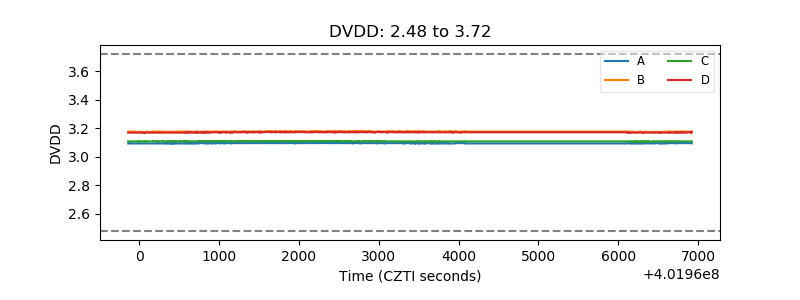 |
| Temperature 1 | 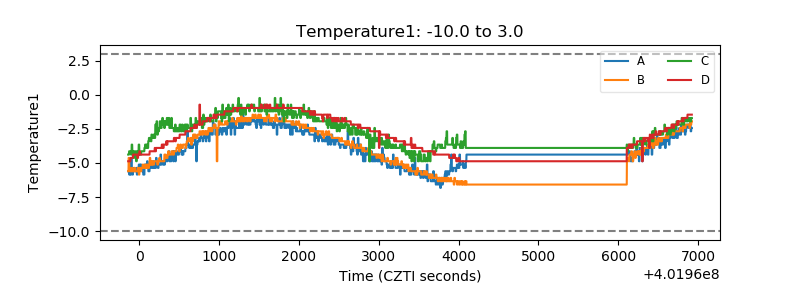 |
| Veto HV Monitor | 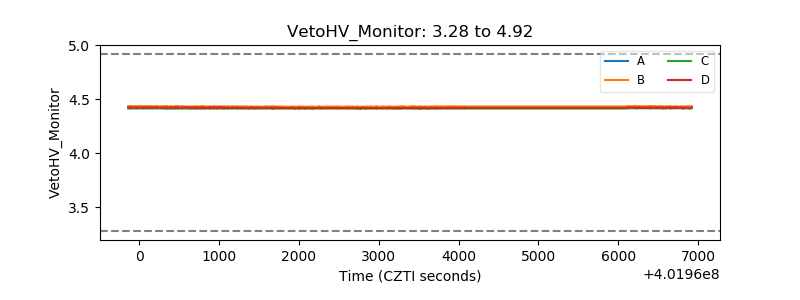 |
| Veto LLD | 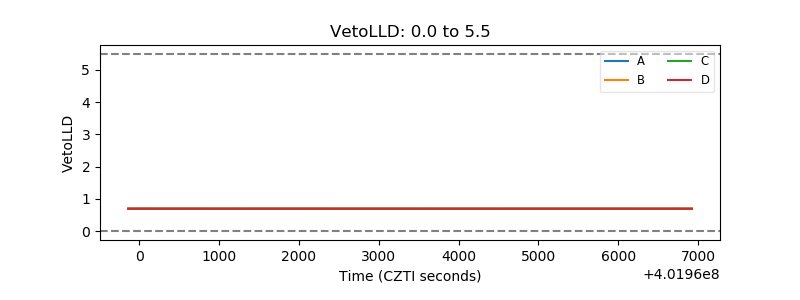 |
| Alpha Counter |  |
| _CPM_Rate | 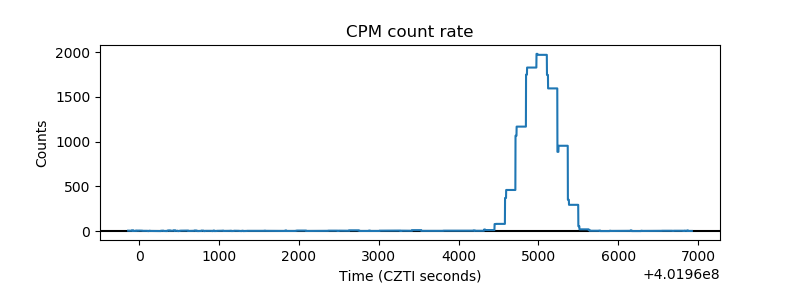 |
| CZT Counter | 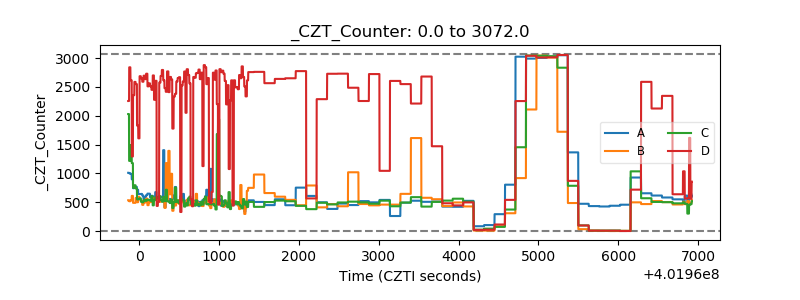 |
| +2.5 Volts monitor | 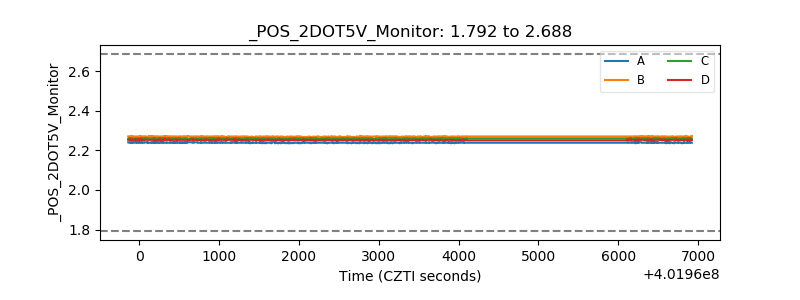 |
| +5 Volts monitor | 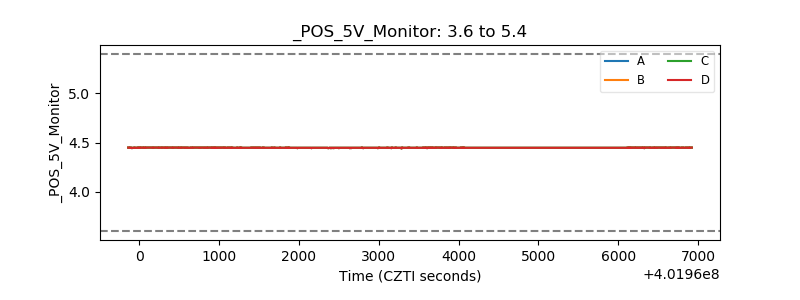 |
| _ROLL_ROT | 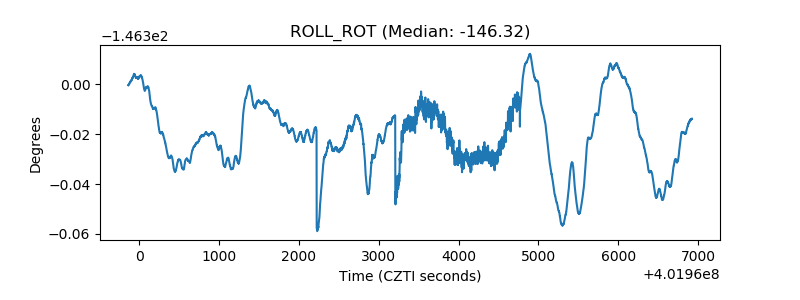 |
| _Roll_DEC | 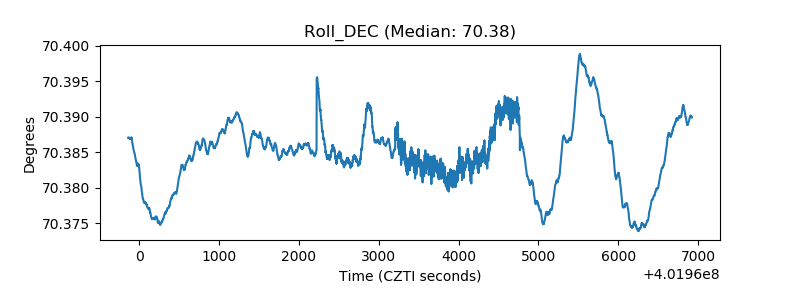 |
| _Roll_RA | 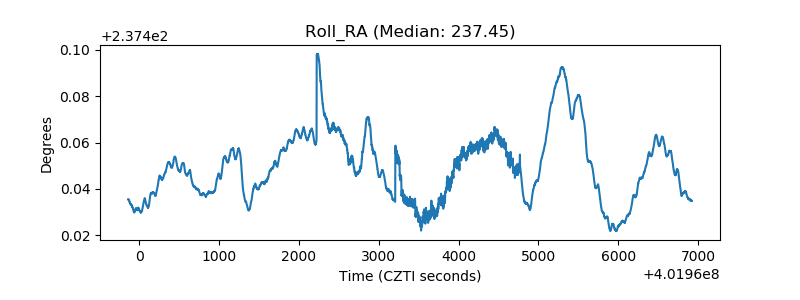 |
| Veto Counter | 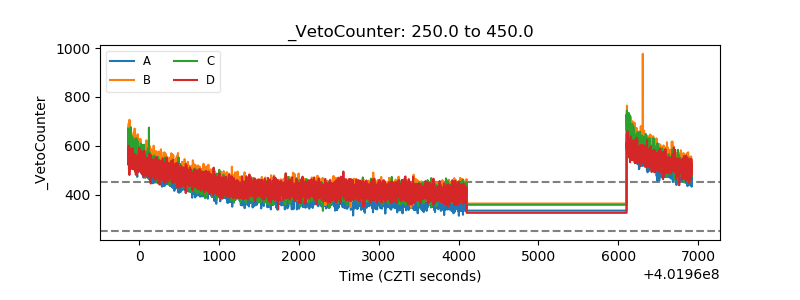 |