| Param | Original file | Final file |
|---|---|---|
| Filename | modeM0/AS1C07_001T12_9000005352_37839cztM0_level2.evt | modeM0/AS1C07_001T12_9000005352_37839cztM0_level2_quad_clean.evt |
| Size (bytes) | 488,246,400 | 89,366,400 |
| Size | 465.6 MB | 85.2 MB |
| Events in quadrant A | 2,747,621 | 644,023 |
| Events in quadrant B | 2,785,605 | 641,992 |
| Events in quadrant C | 2,605,873 | 604,792 |
| Events in quadrant D | 6,315,486 | 471,763 |
| Mode M9 | |||
|---|---|---|---|
| Quadrant | BADHDUFLAG | Total packets | Discarded packets |
| A | 0 | 21 | 0 |
| B | 0 | 21 | 0 |
| C | 0 | 21 | 0 |
| D | 0 | 21 | 0 |
| Mode M0 | |||
|---|---|---|---|
| Quadrant | BADHDUFLAG | Total packets | Discarded packets |
| A | 0 | 11057 | 2 |
| B | 0 | 11200 | 1 |
| C | 0 | 10448 | 1 |
| D | 0 | 22202 | 1 |
| Mode SS | |||
|---|---|---|---|
| Quadrant | BADHDUFLAG | Total packets | Discarded packets |
| A | 0 | 100 | 0 |
| B | 0 | 100 | 0 |
| C | 0 | 100 | 0 |
| D | 0 | 100 | 0 |
| Quadrant | Total seconds | Saturated seconds | Saturation percentage |
|---|---|---|---|
| A | 4894 | 24 | 0.490396% |
| B | 4894 | 43 | 0.878627% |
| C | 4894 | 27 | 0.551696% |
| D | 4894 | 1244 | 25.418880% |
Noise dominated data is calculated using 1-second bins in cleaned event files. If a bin has >2000 counts, and if more than 50% of those come from <1% of pixels, then it is considered to be noise-dominated and hence unusable.
| Quadrant | # 1 sec bins | Bins with >0 counts | Bins with >2000 counts | High rate bins dominated by noise | Noise dominated (total time) | Noise dominated (detector-on time) | Marked lightcurve |
|---|---|---|---|---|---|---|---|
| A | 6987 | 4895 | 11 | 11 | 0.16% | 0.22% | 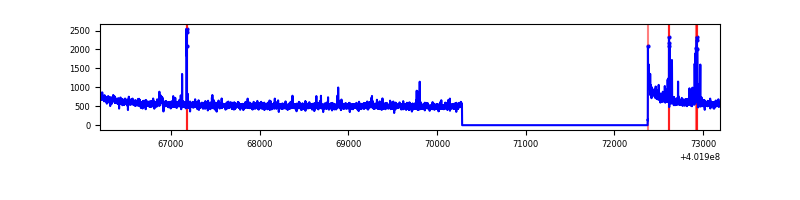 |
| B | 6987 | 4895 | 32 | 32 | 0.46% | 0.65% | 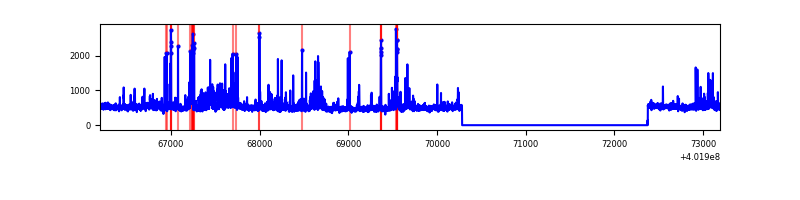 |
| C | 6987 | 4895 | 29 | 29 | 0.42% | 0.59% | 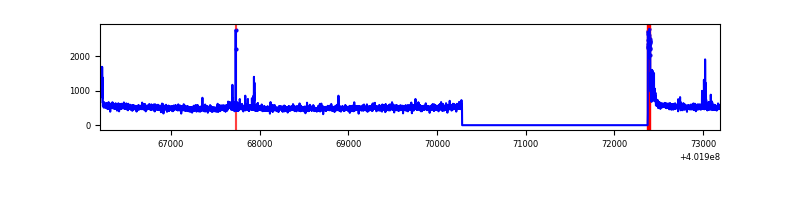 |
| D | 6987 | 4895 | 1100 | 1100 | 15.74% | 22.47% | 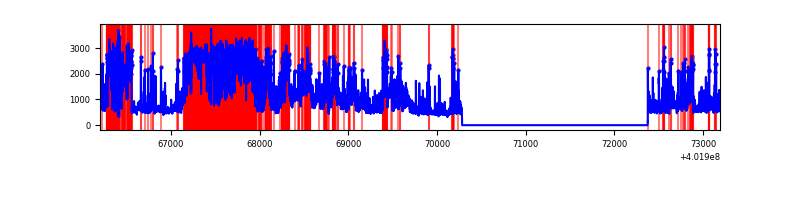 |
Top three noisy pixels from each quadrant. If the there are fewer than three noisy pixels in the level2.evt file, extra rows are filled as -1
| Pixel properties | Quadrant properties | ||||||
|---|---|---|---|---|---|---|---|
| Quadrant | DetID | PixID | Counts | Sigma | Mean | Median | Sigma |
| A | 10 | 83 | 300438 | 2510.47 | 598 | 589 | 119.4 |
| A | 9 | 143 | 70193 | 582.76 | 598 | 589 | 119.4 |
| A | 15 | 222 | 21064 | 171.43 | 598 | 589 | 119.4 |
| B | 0 | 229 | 182615 | 1687.69 | 582 | 569 | 107.9 |
| B | 5 | 172 | 115195 | 1062.66 | 582 | 569 | 107.9 |
| B | 0 | 213 | 89317 | 822.75 | 582 | 569 | 107.9 |
| C | 15 | 214 | 221721 | 1722.96 | 562 | 568 | 128.4 |
| C | 0 | 10 | 112728 | 873.81 | 562 | 568 | 128.4 |
| C | 1 | 23 | 39639 | 304.39 | 562 | 568 | 128.4 |
| D | 1 | 52 | 1902855 | 16246.08 | 486 | 473 | 117.1 |
| D | 12 | 227 | 749449 | 6396.15 | 486 | 473 | 117.1 |
| D | 12 | 233 | 680472 | 5807.1 | 486 | 473 | 117.1 |
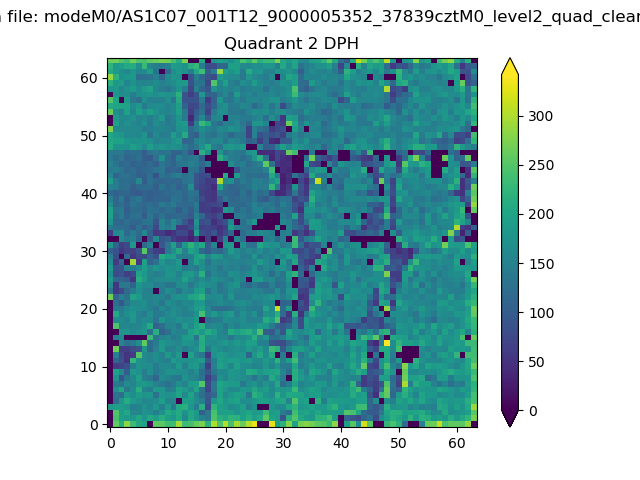
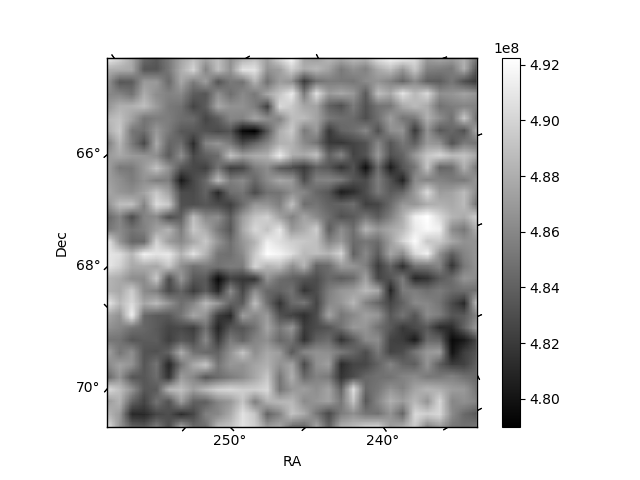
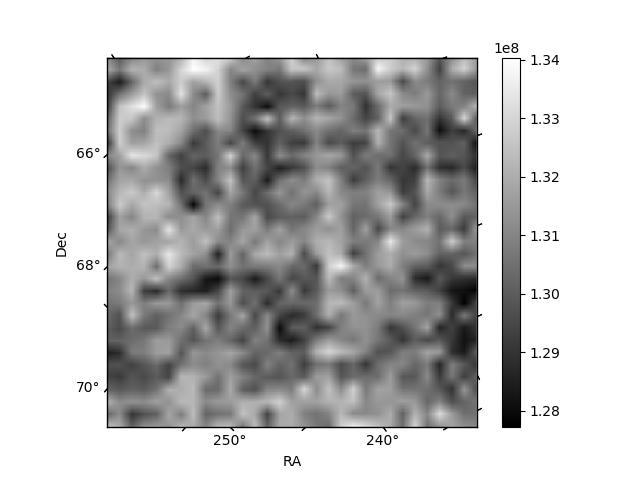
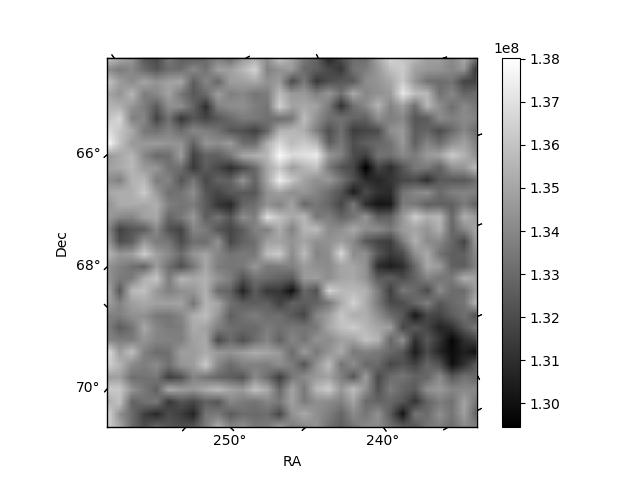
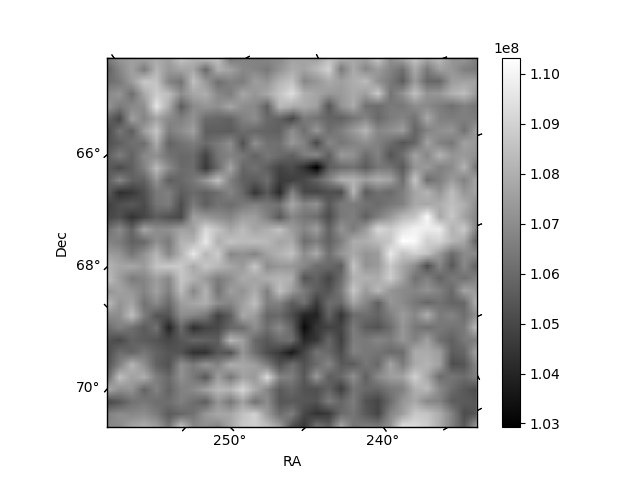
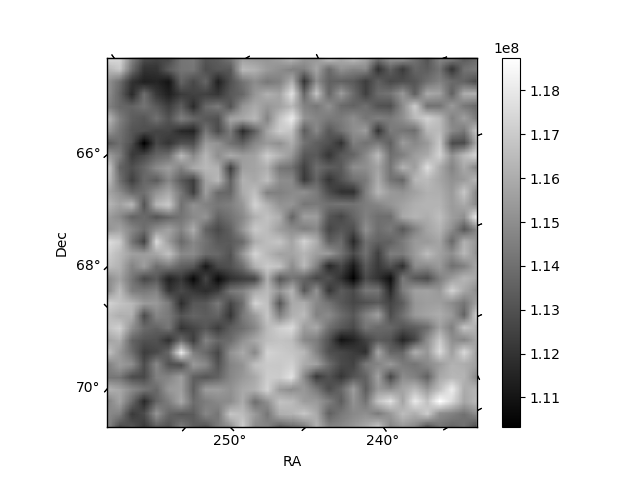
Histogram calculated using DETX and DETY for each event in the final _common_clean file
| Quadrant A | 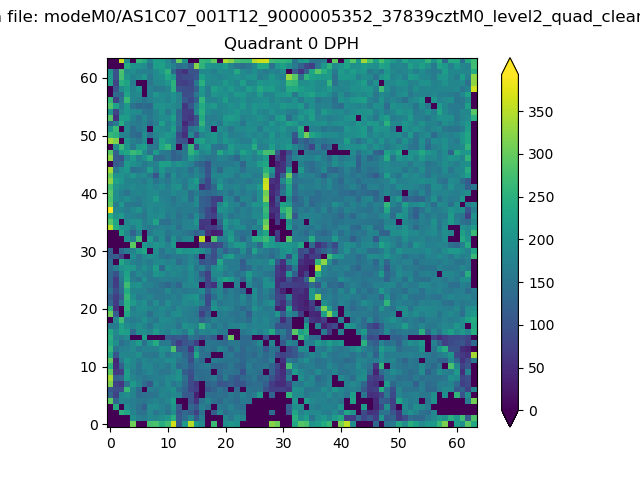 |
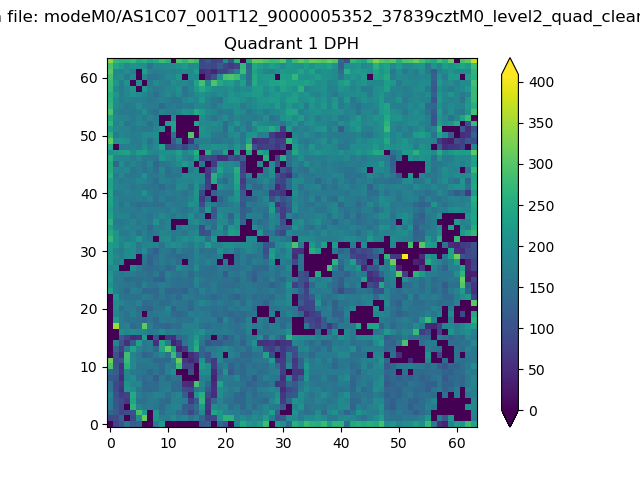 |
Quadrant B |
|---|---|---|---|
| Quadrant D | 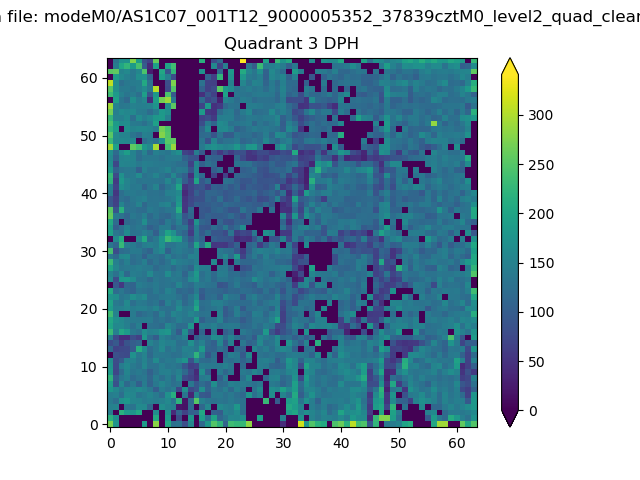 |
 |
Quadrant C |
| Plot type | Count rate plots | Images |
|---|---|---|
| Comparison with Poisson distribution Blue bars denote a histogram of data divided into 1 sec bins. Red curve is a Poisson curve with rate = median count rate of data. |
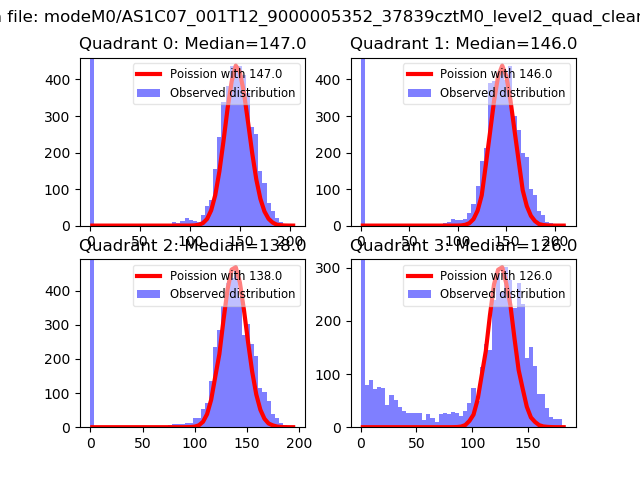 |
 |
| Quadrant-wise count rates Data is divided into 100 sec bins |
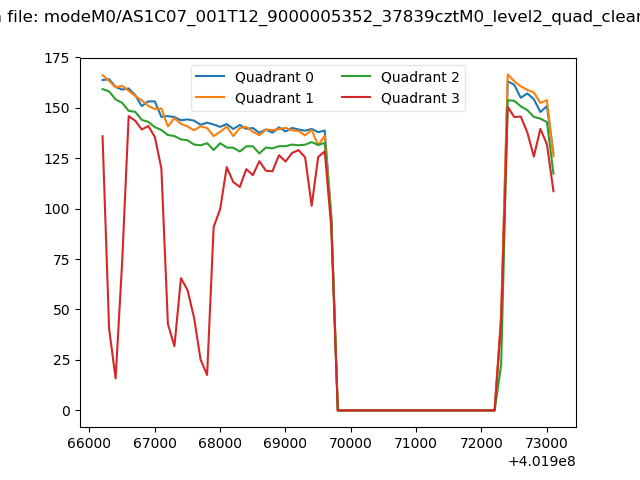 |
|
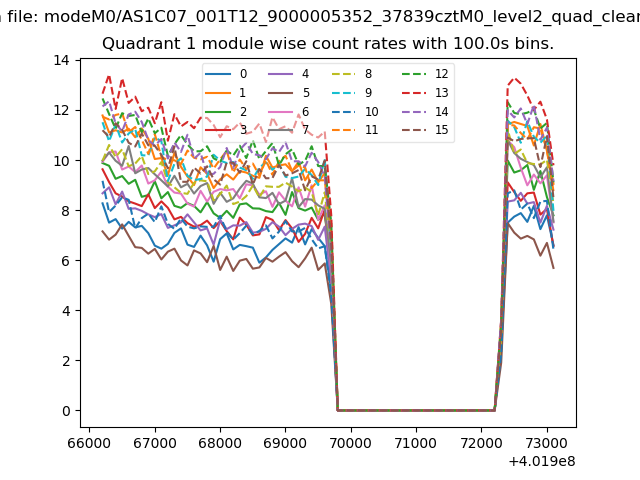
| Module-wise count rates for Quadrant A Data is divided into 100 sec bins |
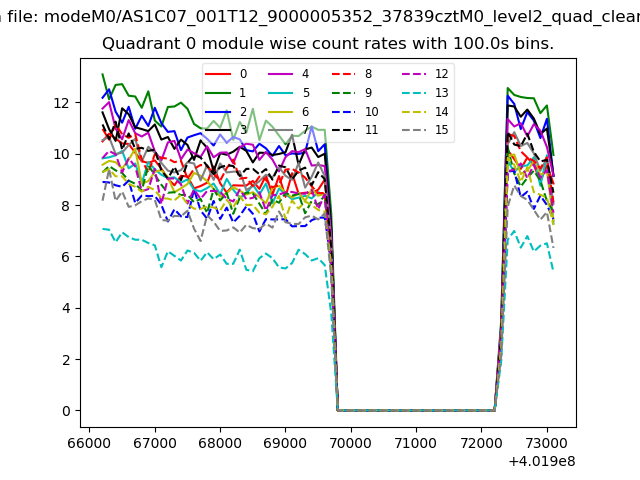 |
 |
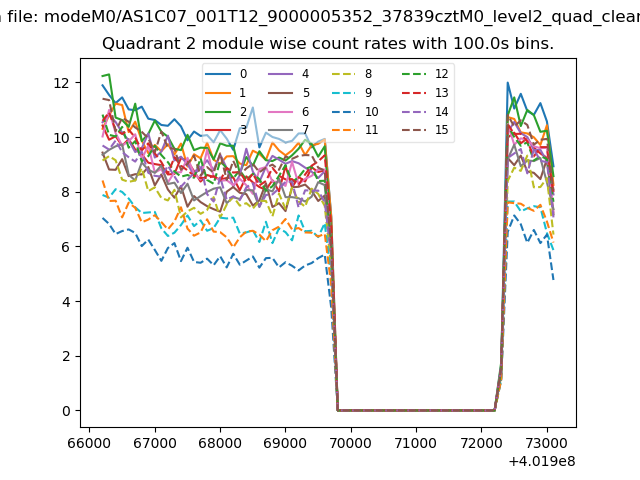
| Module-wise count rates for Quadrant B Data is divided into 100 sec bins |
 |
 |
| Module-wise count rates for Quadrant C Data is divided into 100 sec bins |
 |
 |
| Module-wise count rates for Quadrant D Data is divided into 100 sec bins |
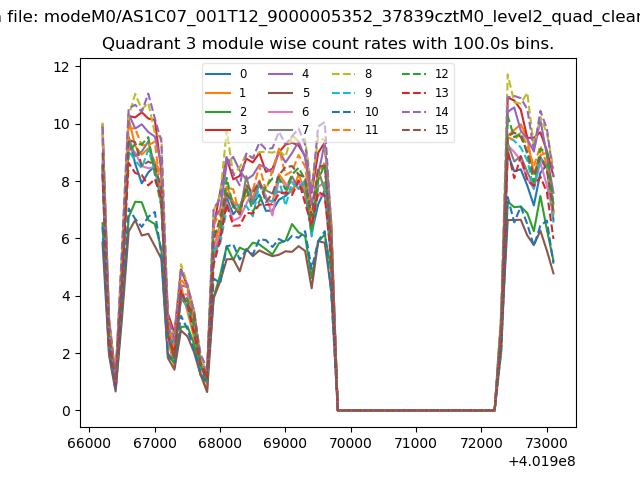 |
 |
| Parameter | Plot |
|---|---|
| CZT HV Monitor | 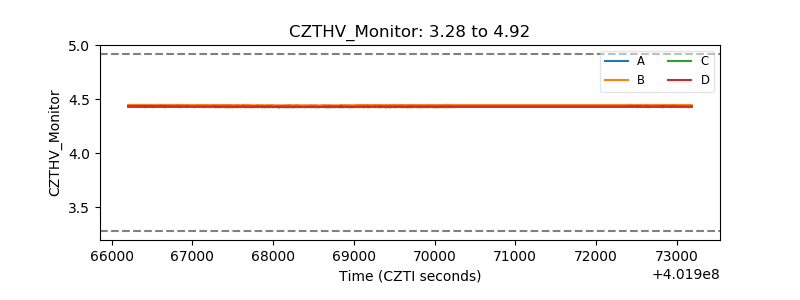 |
| D_VDD | 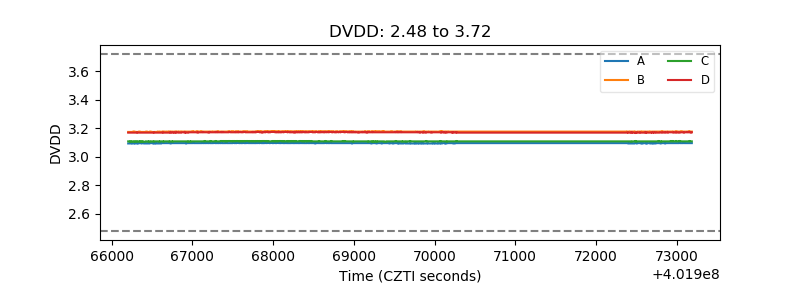 |
| Temperature 1 | 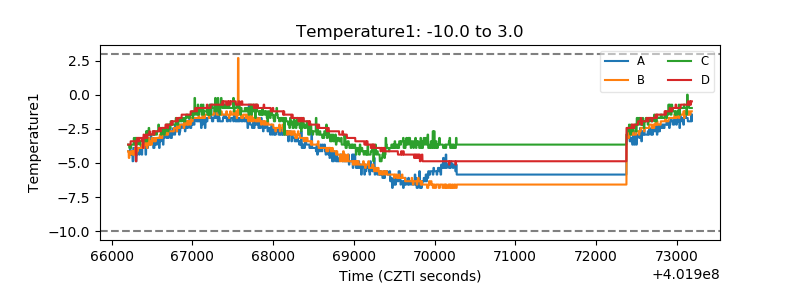 |
| Veto HV Monitor | 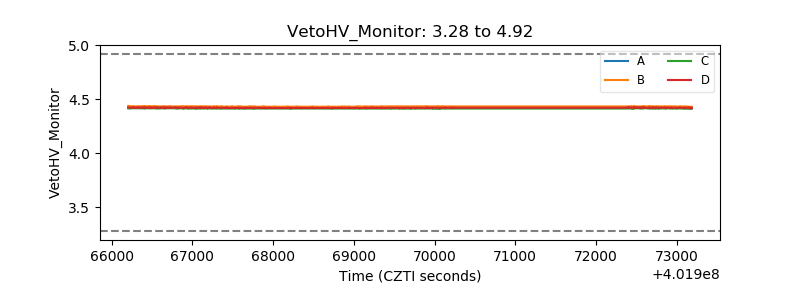 |
| Veto LLD | 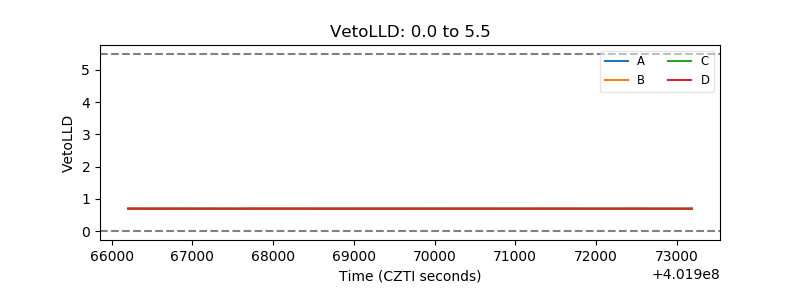 |
| Alpha Counter | 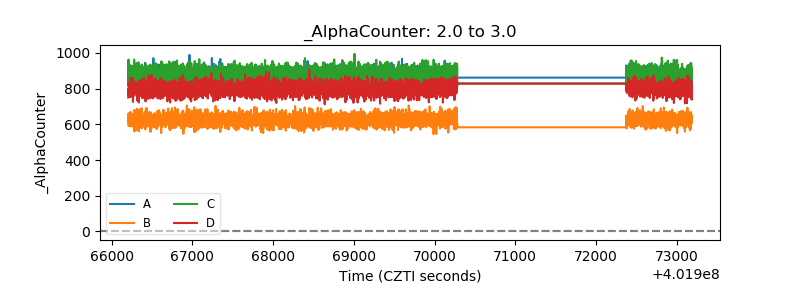 |
| _CPM_Rate | 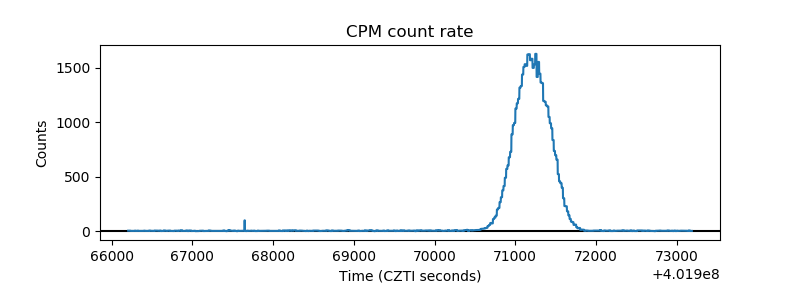 |
| CZT Counter | 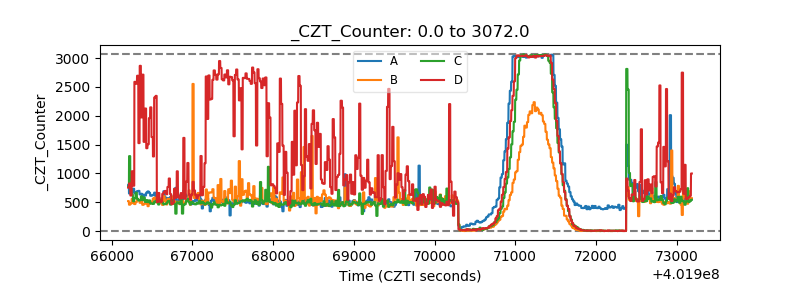 |
| +2.5 Volts monitor | 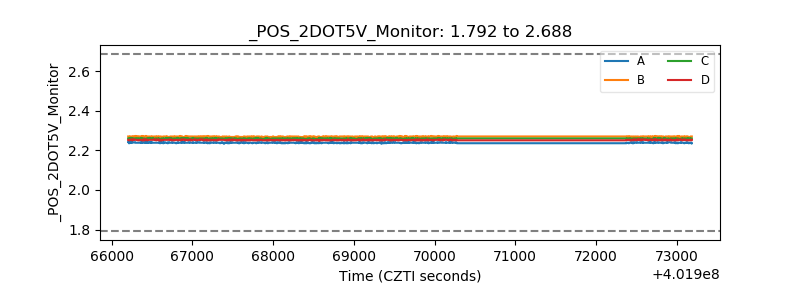 |
| +5 Volts monitor | 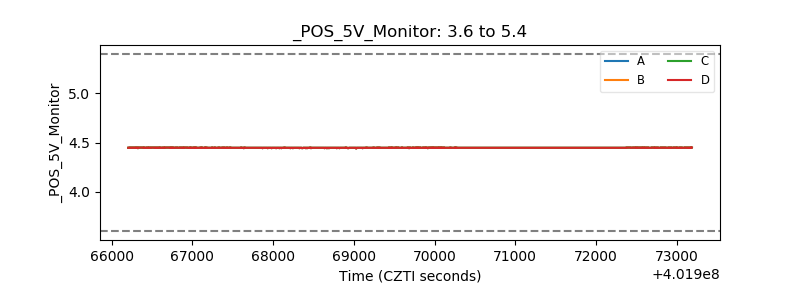 |
| _ROLL_ROT | 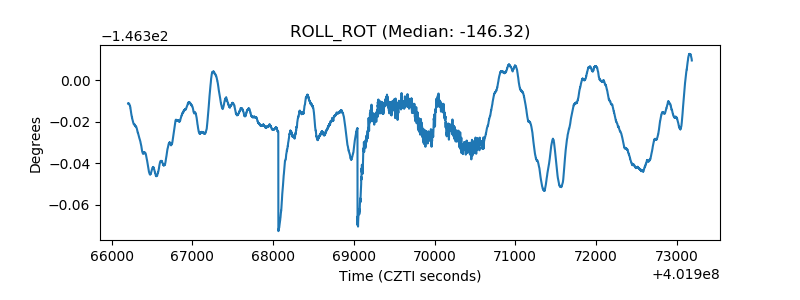 |
| _Roll_DEC | 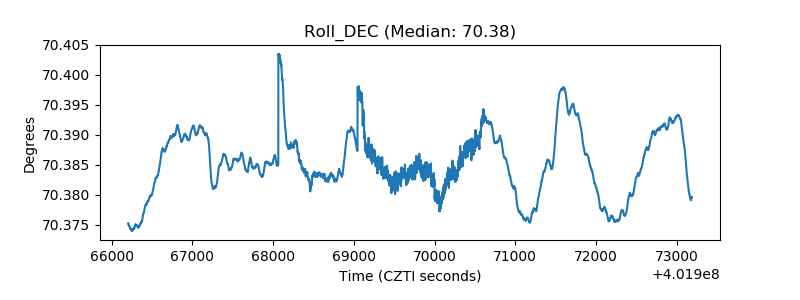 |
| _Roll_RA | 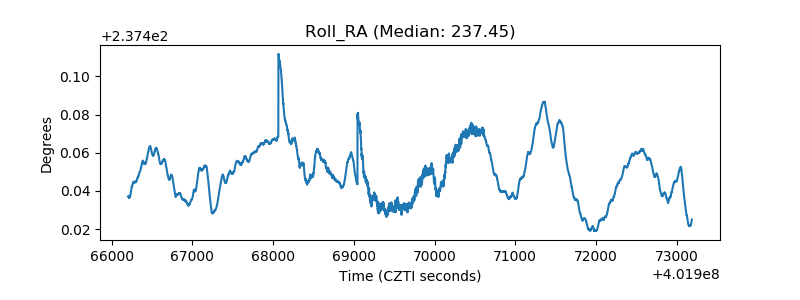 |
| Veto Counter | 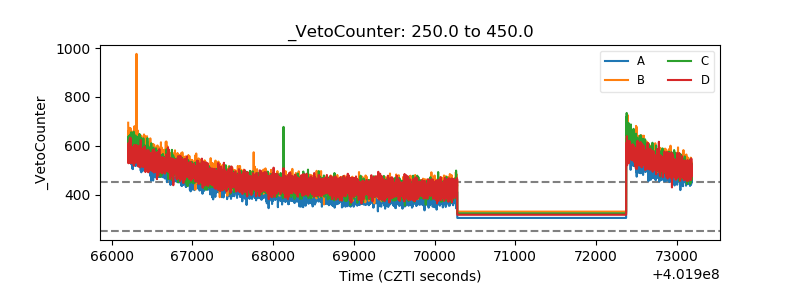 |