| Param | Original file | Final file |
|---|---|---|
| Filename | modeM0/AS1C07_001T12_9000005352_37840cztM0_level2.evt | modeM0/AS1C07_001T12_9000005352_37840cztM0_level2_quad_clean.evt |
| Size (bytes) | 424,123,200 | 85,242,240 |
| Size | 404.5 MB | 81.3 MB |
| Events in quadrant A | 2,764,554 | 583,946 |
| Events in quadrant B | 3,117,383 | 575,811 |
| Events in quadrant C | 2,670,384 | 548,473 |
| Events in quadrant D | 3,958,452 | 528,322 |
| Mode M9 | |||
|---|---|---|---|
| Quadrant | BADHDUFLAG | Total packets | Discarded packets |
| A | 0 | 23 | 0 |
| B | 0 | 23 | 0 |
| C | 0 | 23 | 0 |
| D | 0 | 24 | 0 |
| Mode M0 | |||
|---|---|---|---|
| Quadrant | BADHDUFLAG | Total packets | Discarded packets |
| A | 0 | 11099 | 3 |
| B | 0 | 12355 | 2 |
| C | 0 | 10714 | 2 |
| D | 0 | 15114 | 2 |
| Mode SS | |||
|---|---|---|---|
| Quadrant | BADHDUFLAG | Total packets | Discarded packets |
| A | 0 | 100 | 0 |
| B | 0 | 100 | 0 |
| C | 0 | 100 | 0 |
| D | 0 | 100 | 0 |
| Quadrant | Total seconds | Saturated seconds | Saturation percentage |
|---|---|---|---|
| A | 4917 | 25 | 0.508440% |
| B | 4917 | 97 | 1.972748% |
| C | 4917 | 48 | 0.976205% |
| D | 4917 | 210 | 4.270897% |
Noise dominated data is calculated using 1-second bins in cleaned event files. If a bin has >2000 counts, and if more than 50% of those come from <1% of pixels, then it is considered to be noise-dominated and hence unusable.
| Quadrant | # 1 sec bins | Bins with >0 counts | Bins with >2000 counts | High rate bins dominated by noise | Noise dominated (total time) | Noise dominated (detector-on time) | Marked lightcurve |
|---|---|---|---|---|---|---|---|
| A | 7070 | 4918 | 11 | 11 | 0.16% | 0.22% | 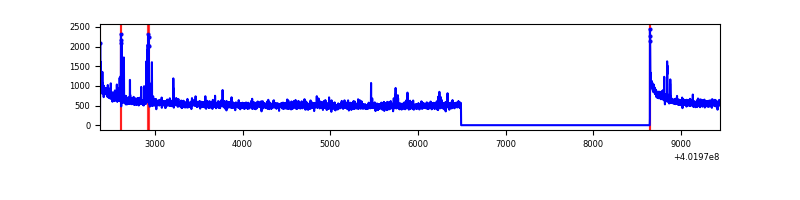 |
| B | 7070 | 4918 | 76 | 76 | 1.07% | 1.55% | 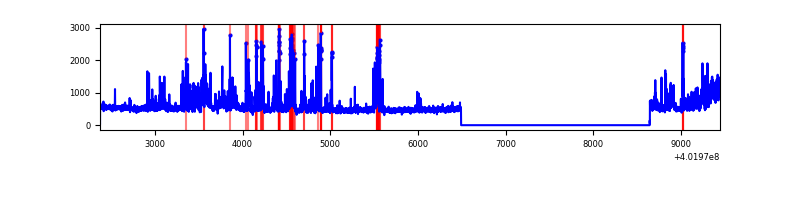 |
| C | 7070 | 4918 | 47 | 47 | 0.66% | 0.96% | 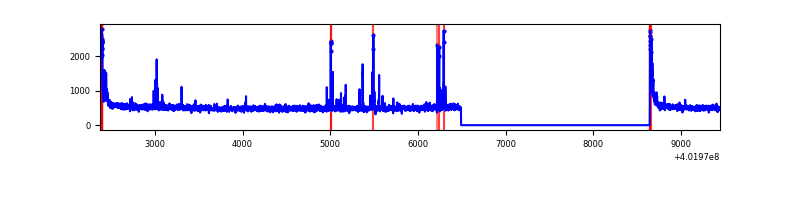 |
| D | 7070 | 4918 | 184 | 184 | 2.60% | 3.74% | 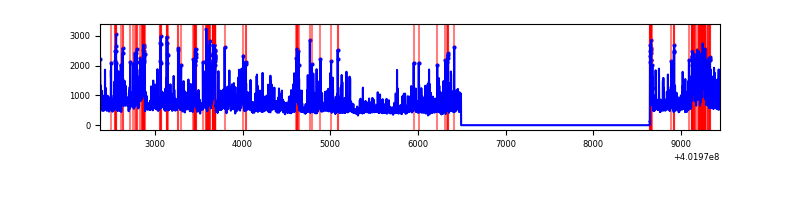 |
Top three noisy pixels from each quadrant. If the there are fewer than three noisy pixels in the level2.evt file, extra rows are filled as -1
| Pixel properties | Quadrant properties | ||||||
|---|---|---|---|---|---|---|---|
| Quadrant | DetID | PixID | Counts | Sigma | Mean | Median | Sigma |
| A | 10 | 83 | 345859 | 2940.27 | 590 | 580 | 117.4 |
| A | 9 | 143 | 59777 | 504.1 | 590 | 580 | 117.4 |
| A | 15 | 222 | 20918 | 173.19 | 590 | 580 | 117.4 |
| B | 5 | 172 | 375655 | 3531.8 | 574 | 562 | 106.2 |
| B | 0 | 229 | 196420 | 1844.16 | 574 | 562 | 106.2 |
| B | 10 | 246 | 119447 | 1119.39 | 574 | 562 | 106.2 |
| C | 15 | 214 | 220777 | 1725.59 | 560 | 564 | 127.6 |
| C | 0 | 10 | 153346 | 1197.2 | 560 | 564 | 127.6 |
| C | 1 | 23 | 40229 | 310.82 | 560 | 564 | 127.6 |
| D | 1 | 52 | 879994 | 6476.28 | 566 | 552 | 135.8 |
| D | 12 | 233 | 433093 | 3185.27 | 566 | 552 | 135.8 |
| D | 2 | 249 | 141876 | 1040.72 | 566 | 552 | 135.8 |
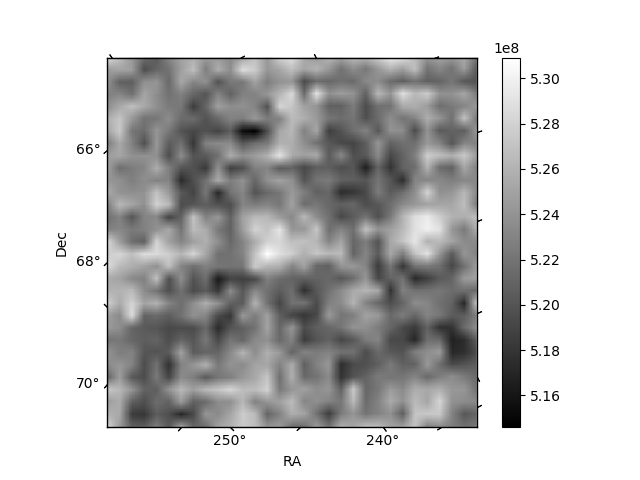
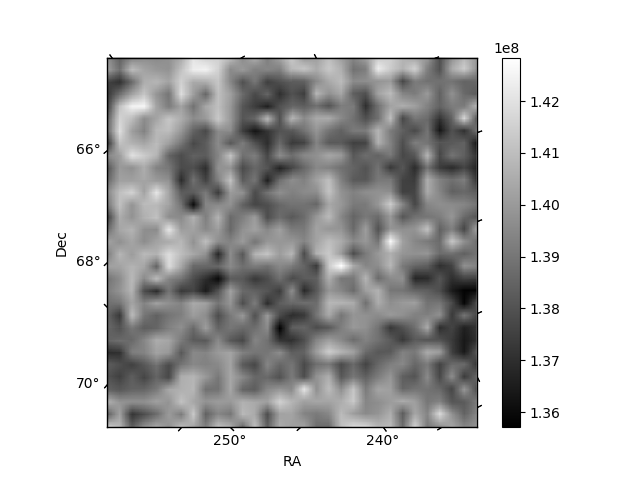
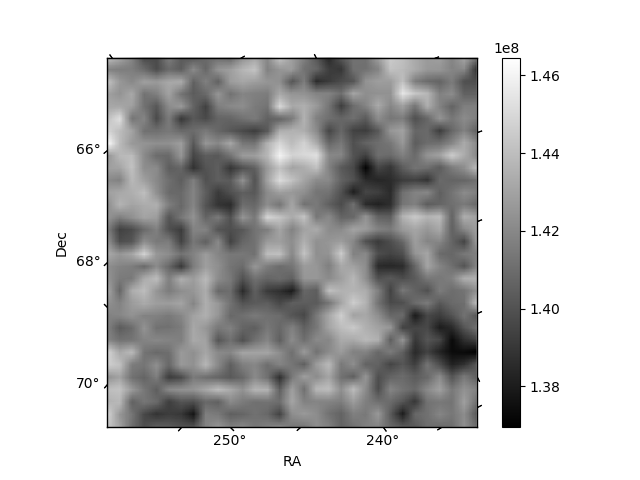
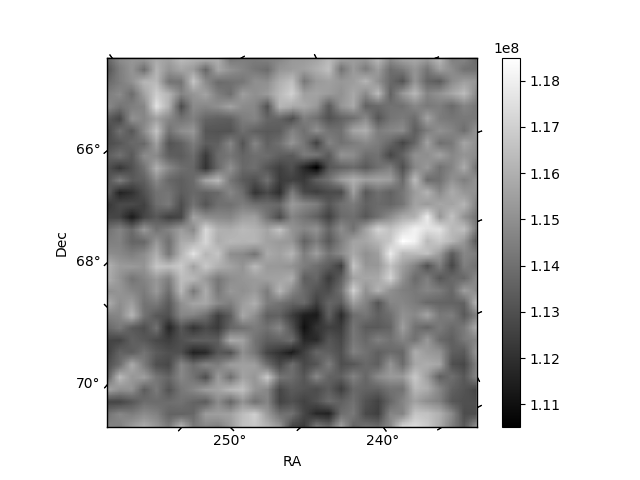
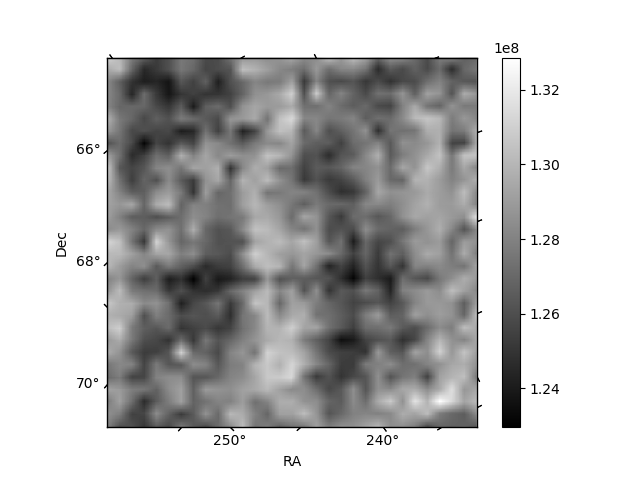
Histogram calculated using DETX and DETY for each event in the final _common_clean file
| Quadrant A | 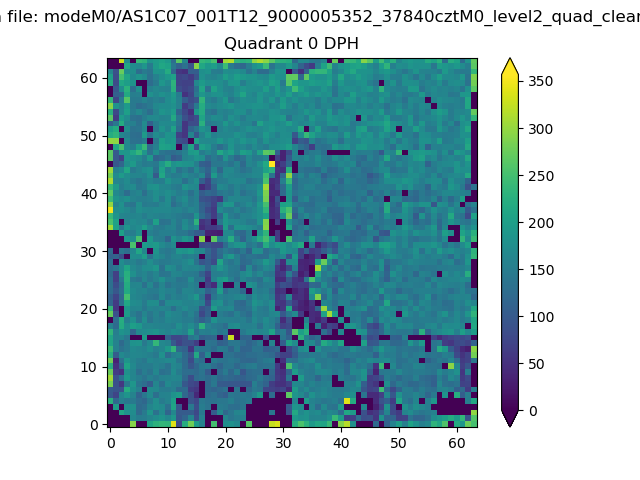 |
 |
Quadrant B |
|---|---|---|---|
| Quadrant D | 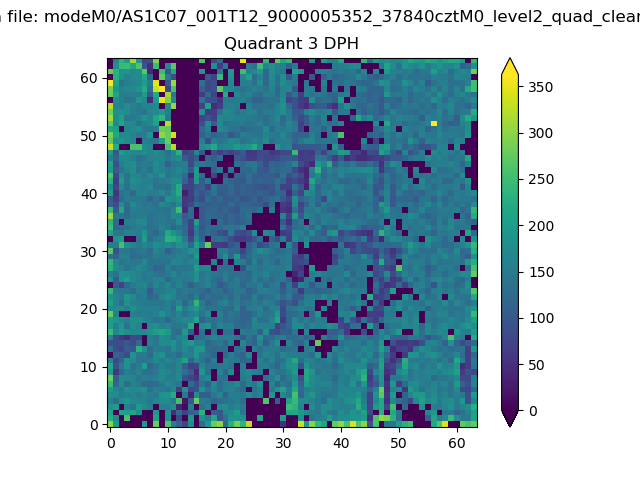 |
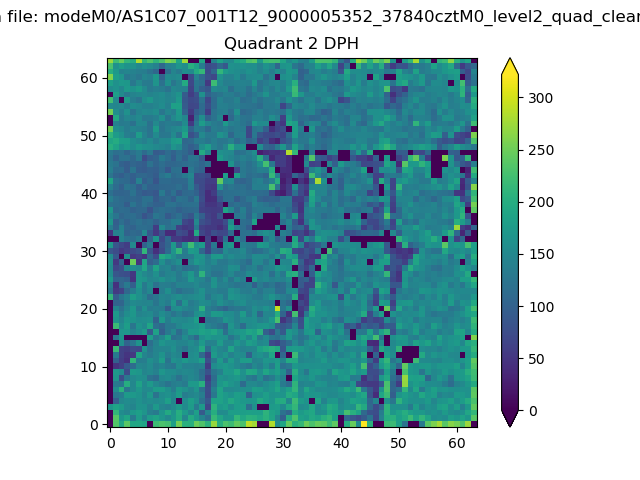 |
Quadrant C |
| Plot type | Count rate plots | Images |
|---|---|---|
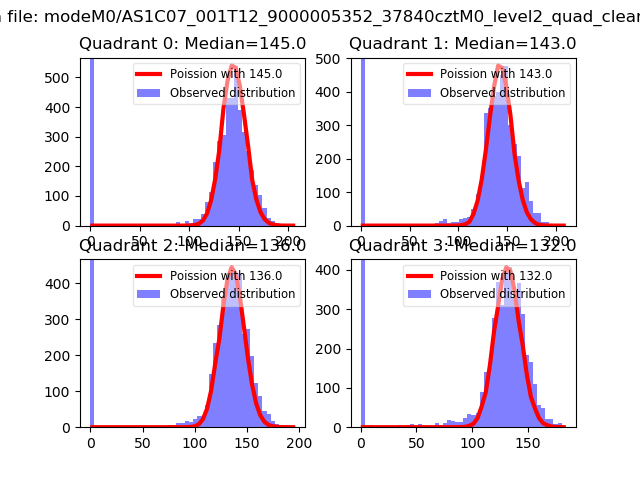
| Comparison with Poisson distribution Blue bars denote a histogram of data divided into 1 sec bins. Red curve is a Poisson curve with rate = median count rate of data. |
 |
 |
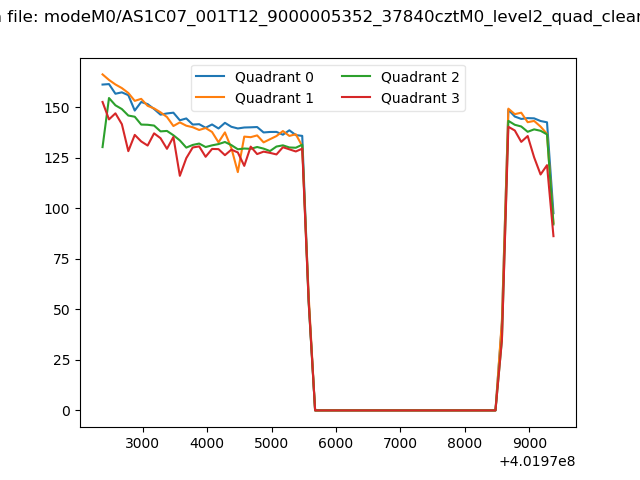
| Quadrant-wise count rates Data is divided into 100 sec bins |
 |
|
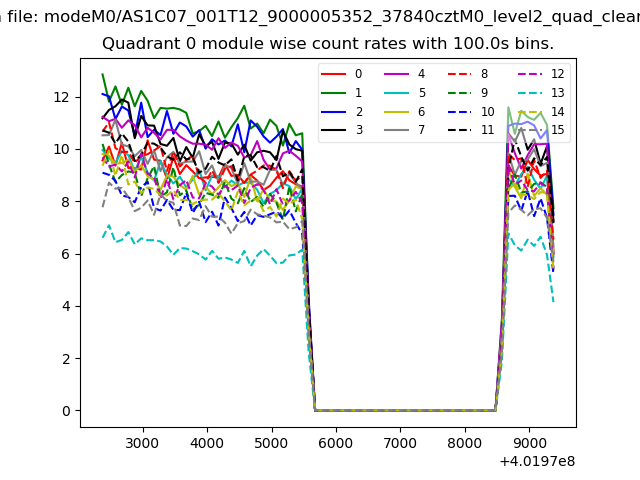
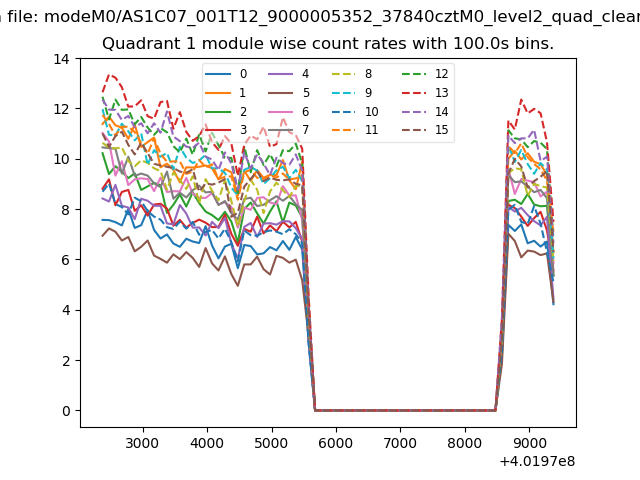
| Module-wise count rates for Quadrant A Data is divided into 100 sec bins |
 |
 |
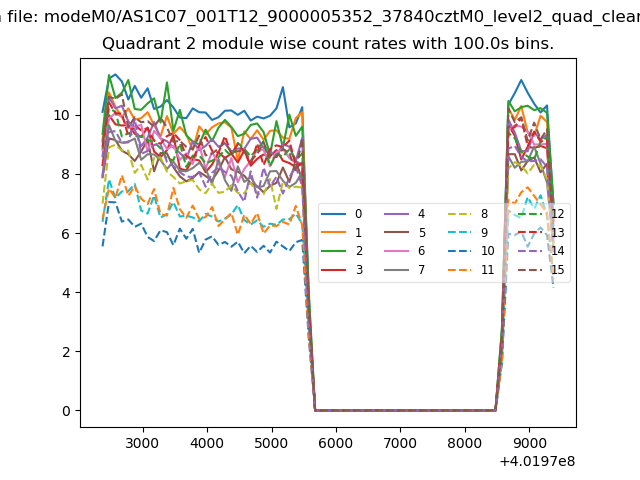
| Module-wise count rates for Quadrant B Data is divided into 100 sec bins |
 |
 |
| Module-wise count rates for Quadrant C Data is divided into 100 sec bins |
 |
 |
| Module-wise count rates for Quadrant D Data is divided into 100 sec bins |
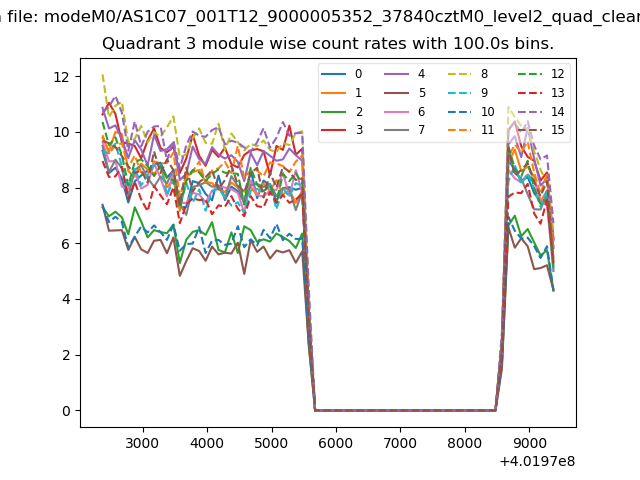 |
 |
| Parameter | Plot |
|---|---|
| CZT HV Monitor | 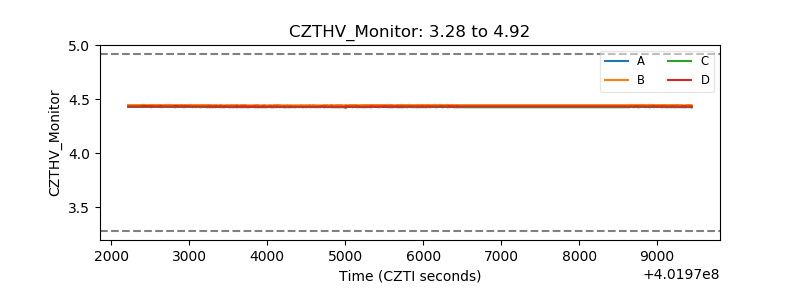 |
| D_VDD | 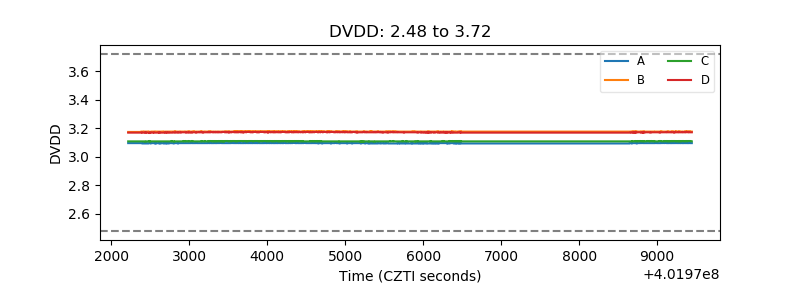 |
| Temperature 1 | 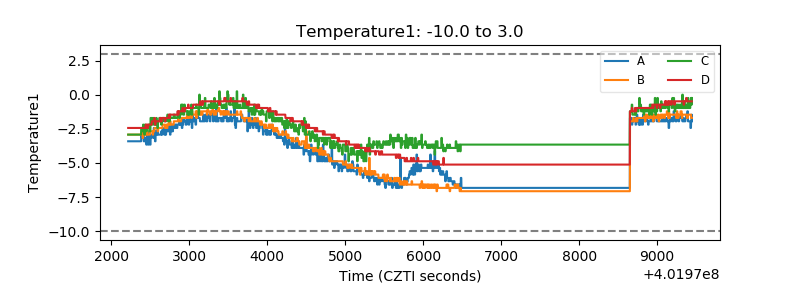 |
| Veto HV Monitor | 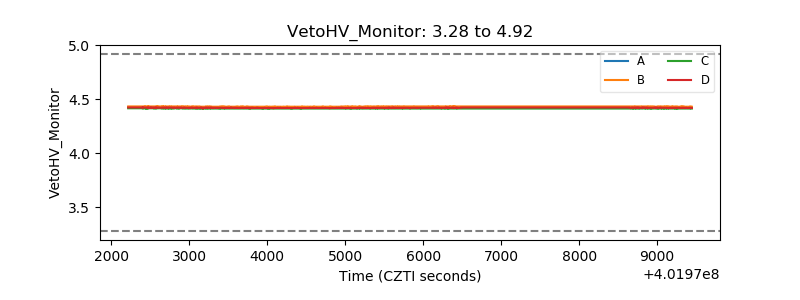 |
| Veto LLD | 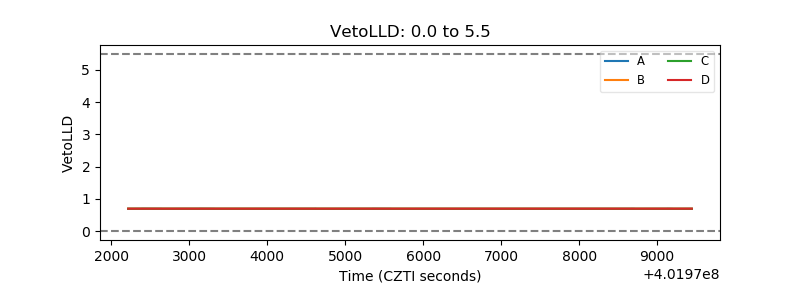 |
| Alpha Counter | 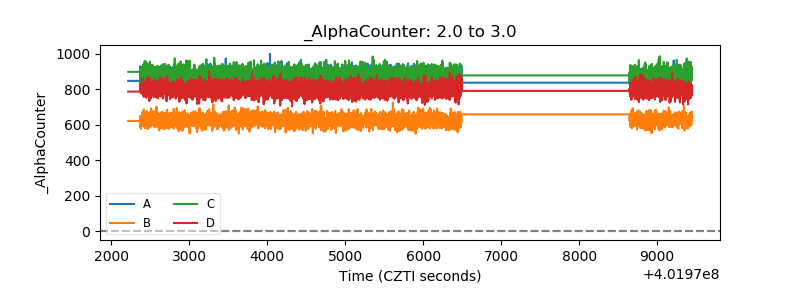 |
| _CPM_Rate | 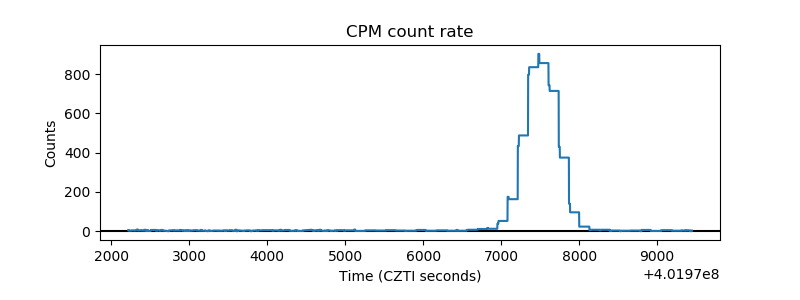 |
| CZT Counter | 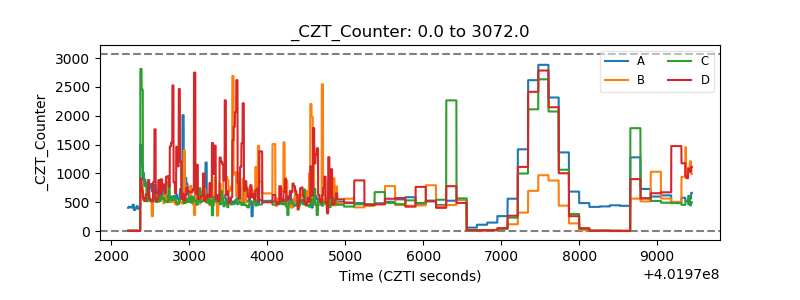 |
| +2.5 Volts monitor | 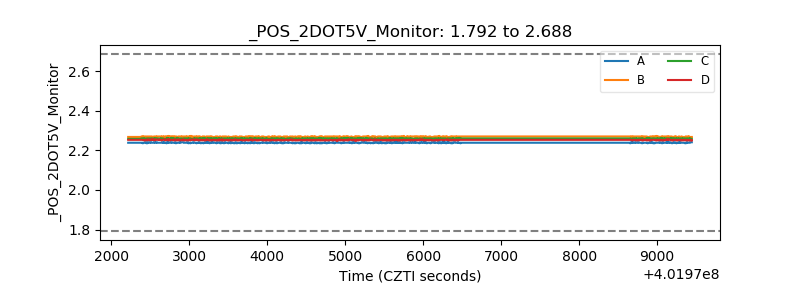 |
| +5 Volts monitor | 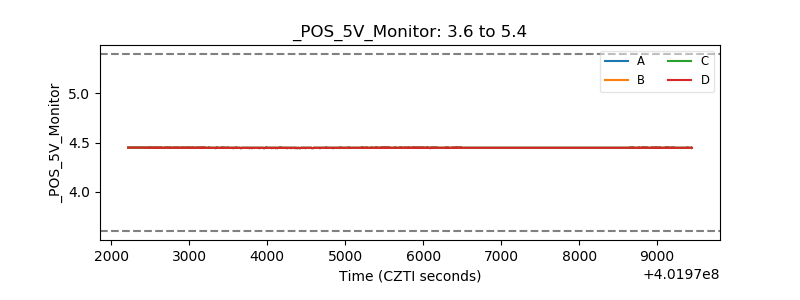 |
| _ROLL_ROT | 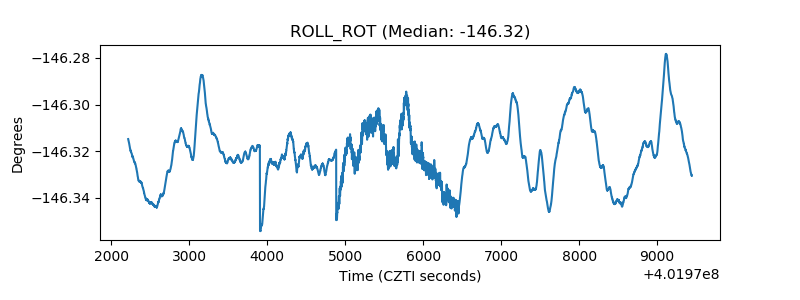 |
| _Roll_DEC | 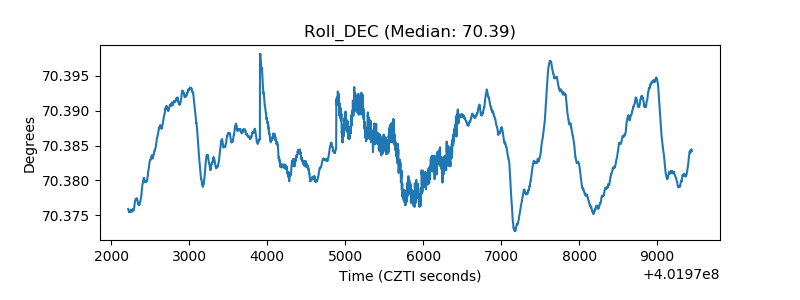 |
| _Roll_RA | 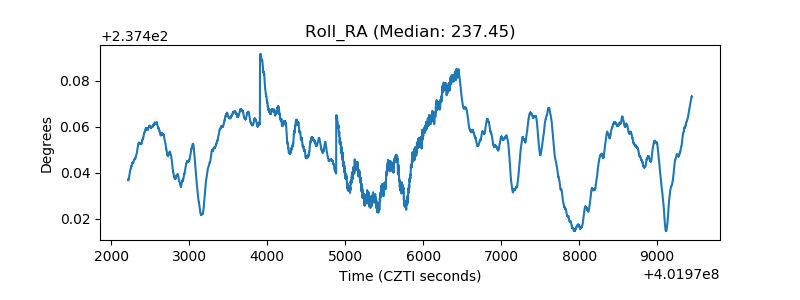 |
| Veto Counter | 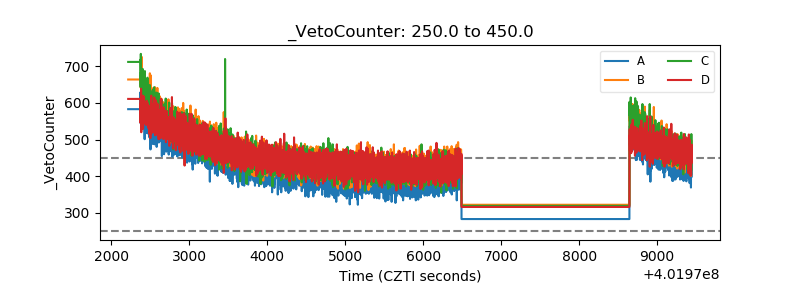 |