| Param | Original file | Final file |
|---|---|---|
| Filename | modeM0/AS1C07_001T12_9000005352_37842cztM0_level2.evt | modeM0/AS1C07_001T12_9000005352_37842cztM0_level2_quad_clean.evt |
| Size (bytes) | 445,227,840 | 64,278,720 |
| Size | 424.6 MB | 61.3 MB |
| Events in quadrant A | 2,464,949 | 443,083 |
| Events in quadrant B | 2,919,058 | 433,659 |
| Events in quadrant C | 2,503,907 | 414,764 |
| Events in quadrant D | 5,261,091 | 309,301 |
| Mode M9 | |||
|---|---|---|---|
| Quadrant | BADHDUFLAG | Total packets | Discarded packets |
| A | 0 | 19 | 0 |
| B | 0 | 19 | 0 |
| C | 0 | 19 | 0 |
| D | 0 | 19 | 0 |
| Mode M0 | |||
|---|---|---|---|
| Quadrant | BADHDUFLAG | Total packets | Discarded packets |
| A | 0 | 10333 | 2 |
| B | 0 | 11965 | 1 |
| C | 0 | 10499 | 1 |
| D | 0 | 19068 | 1 |
| Mode SS | |||
|---|---|---|---|
| Quadrant | BADHDUFLAG | Total packets | Discarded packets |
| A | 0 | 100 | 0 |
| B | 0 | 100 | 0 |
| C | 0 | 100 | 0 |
| D | 0 | 100 | 0 |
| Quadrant | Total seconds | Saturated seconds | Saturation percentage |
|---|---|---|---|
| A | 4926 | 8 | 0.162404% |
| B | 4926 | 155 | 3.146569% |
| C | 4926 | 40 | 0.812018% |
| D | 4926 | 958 | 19.447828% |
Noise dominated data is calculated using 1-second bins in cleaned event files. If a bin has >2000 counts, and if more than 50% of those come from <1% of pixels, then it is considered to be noise-dominated and hence unusable.
| Quadrant | # 1 sec bins | Bins with >0 counts | Bins with >2000 counts | High rate bins dominated by noise | Noise dominated (total time) | Noise dominated (detector-on time) | Marked lightcurve |
|---|---|---|---|---|---|---|---|
| A | 6840 | 4927 | 3 | 3 | 0.04% | 0.06% | 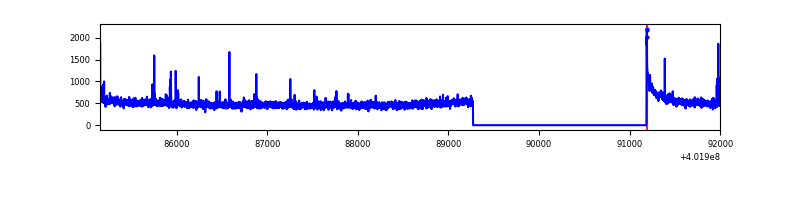 |
| B | 6840 | 4927 | 131 | 131 | 1.92% | 2.66% | 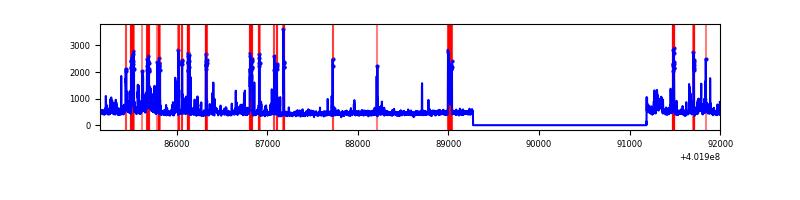 |
| C | 6840 | 4927 | 27 | 27 | 0.39% | 0.55% | 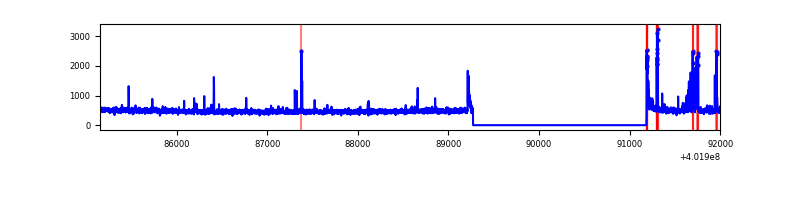 |
| D | 6840 | 4927 | 834 | 834 | 12.19% | 16.93% | 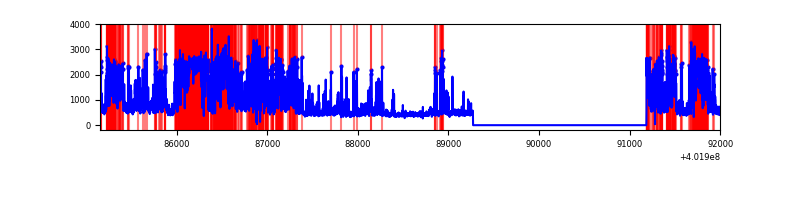 |
Top three noisy pixels from each quadrant. If the there are fewer than three noisy pixels in the level2.evt file, extra rows are filled as -1
| Pixel properties | Quadrant properties | ||||||
|---|---|---|---|---|---|---|---|
| Quadrant | DetID | PixID | Counts | Sigma | Mean | Median | Sigma |
| A | 10 | 83 | 283672 | 2593.18 | 543 | 533 | 109.2 |
| A | 9 | 143 | 29578 | 266.01 | 543 | 533 | 109.2 |
| A | 15 | 222 | 21984 | 196.46 | 543 | 533 | 109.2 |
| B | 5 | 172 | 308458 | 3036.0 | 533 | 520 | 101.4 |
| B | 10 | 246 | 231707 | 2279.3 | 533 | 520 | 101.4 |
| B | 0 | 229 | 123166 | 1209.18 | 533 | 520 | 101.4 |
| C | 15 | 214 | 203539 | 1666.34 | 530 | 534 | 121.8 |
| C | 1 | 23 | 160705 | 1314.74 | 530 | 534 | 121.8 |
| C | 0 | 10 | 41488 | 336.17 | 530 | 534 | 121.8 |
| D | 13 | 249 | 1220498 | 10384.66 | 485 | 471 | 117.5 |
| D | 1 | 52 | 1157009 | 9844.26 | 485 | 471 | 117.5 |
| D | 2 | 250 | 303810 | 2581.97 | 485 | 471 | 117.5 |
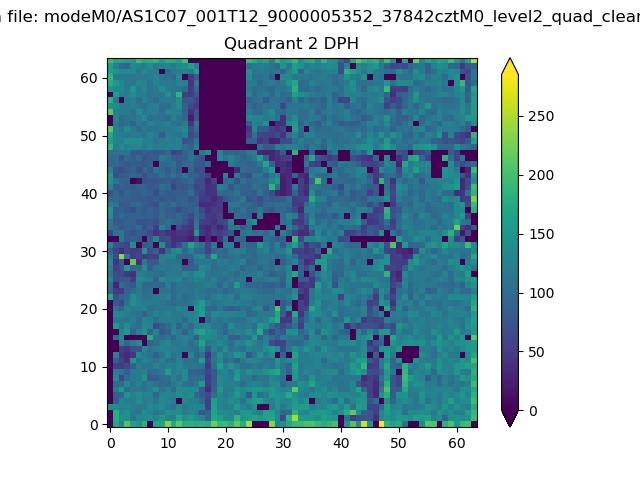
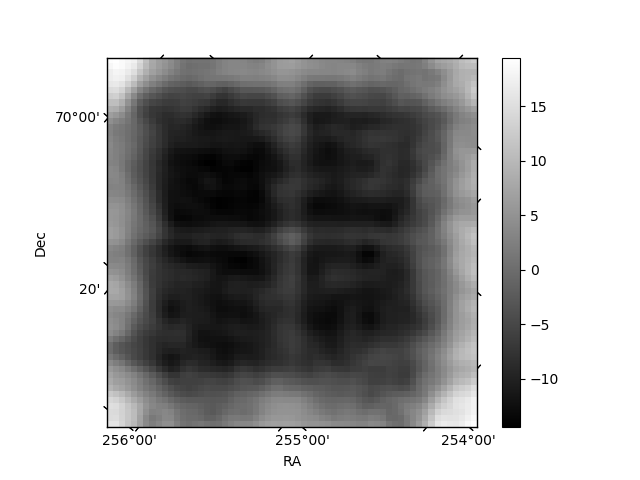
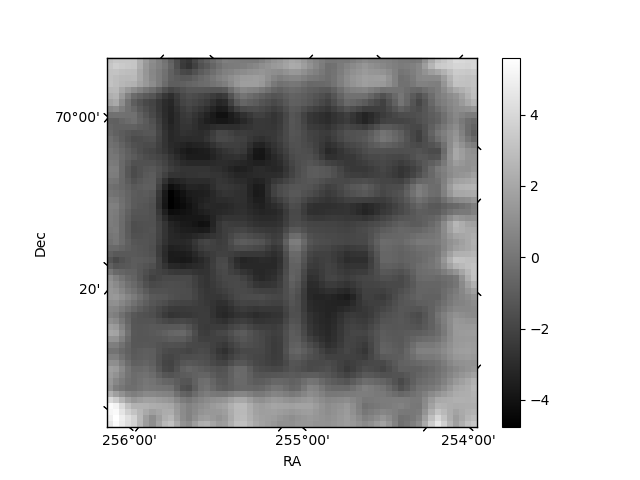
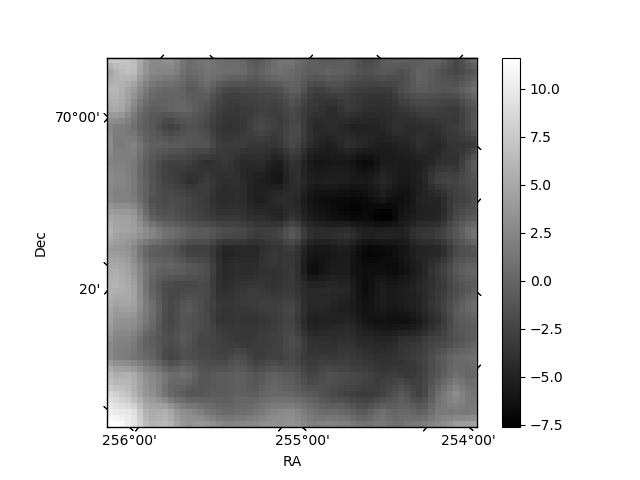
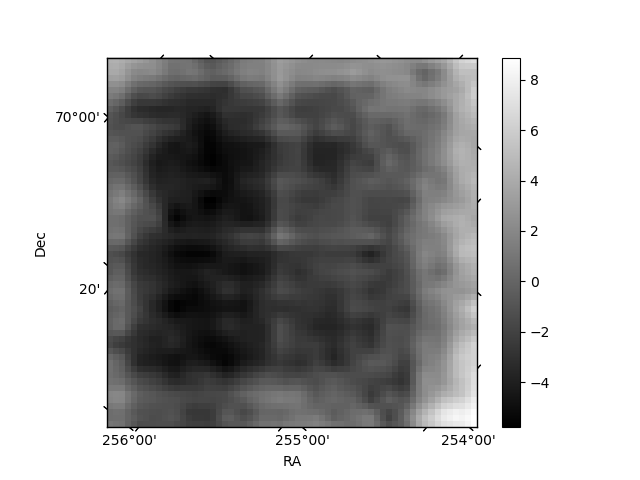
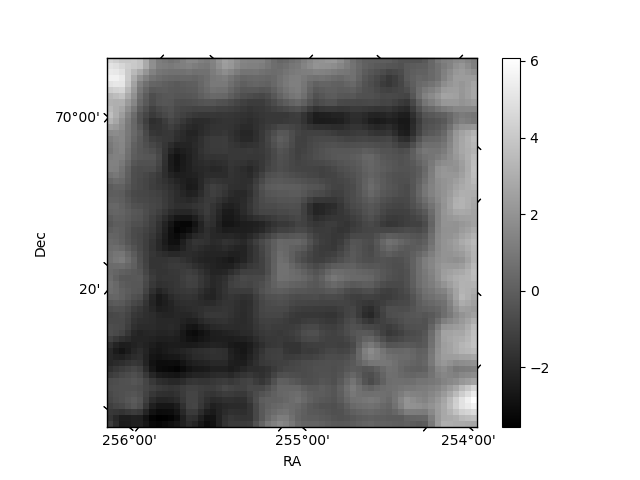
Histogram calculated using DETX and DETY for each event in the final _common_clean file
| Quadrant A | 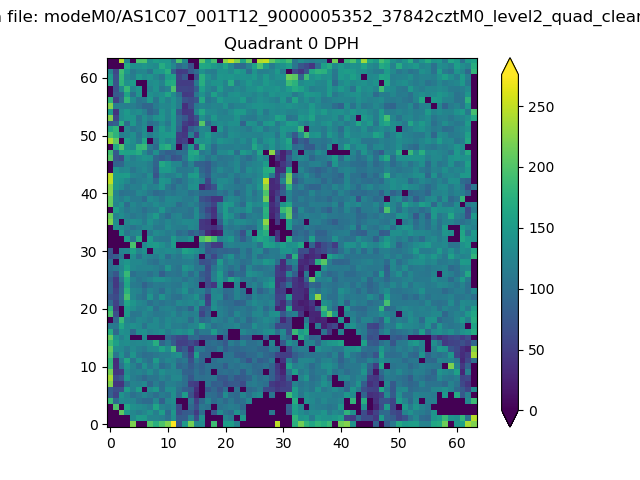 |
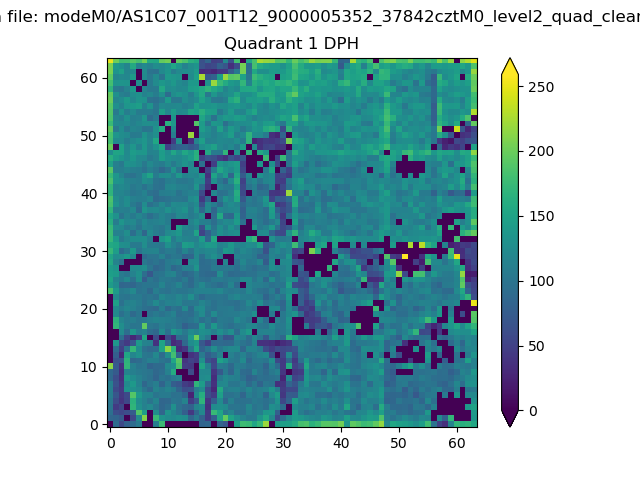 |
Quadrant B |
|---|---|---|---|
| Quadrant D | 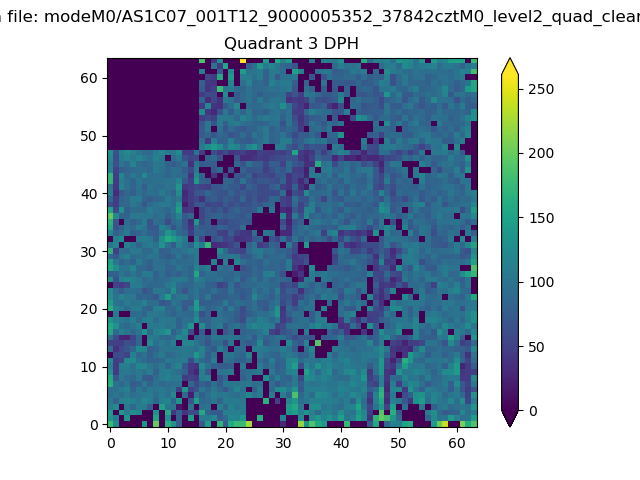 |
 |
Quadrant C |
| Plot type | Count rate plots | Images |
|---|---|---|
| Comparison with Poisson distribution Blue bars denote a histogram of data divided into 1 sec bins. Red curve is a Poisson curve with rate = median count rate of data. |
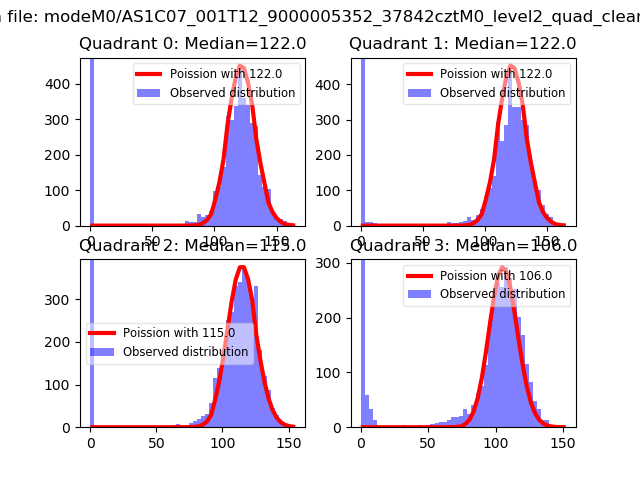 |
 |
| Quadrant-wise count rates Data is divided into 100 sec bins |
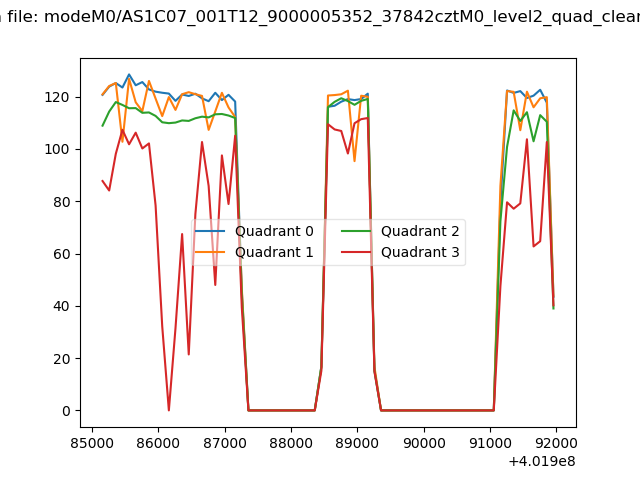 |
|
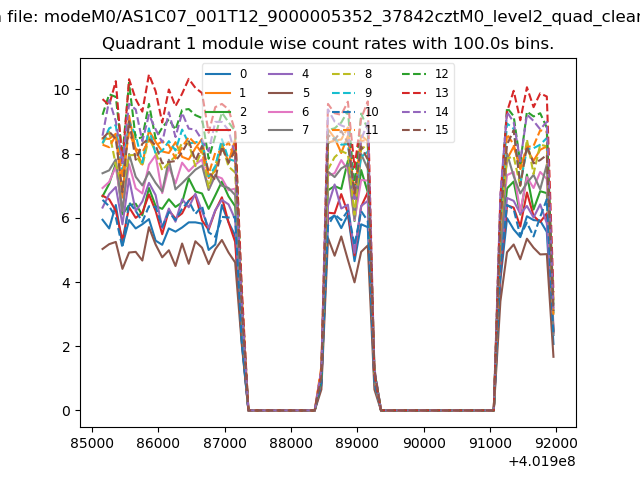
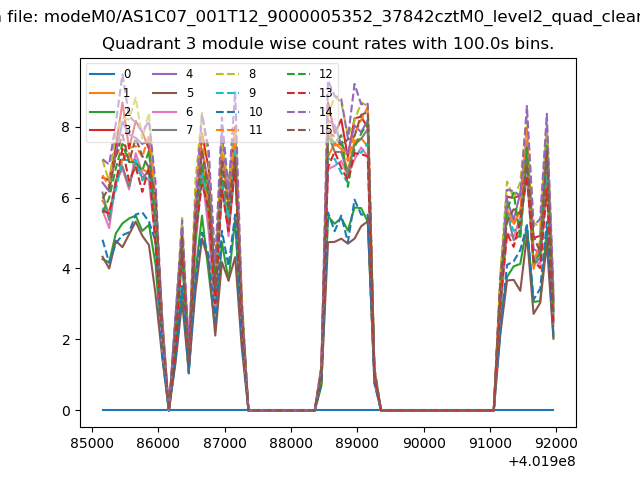
| Module-wise count rates for Quadrant A Data is divided into 100 sec bins |
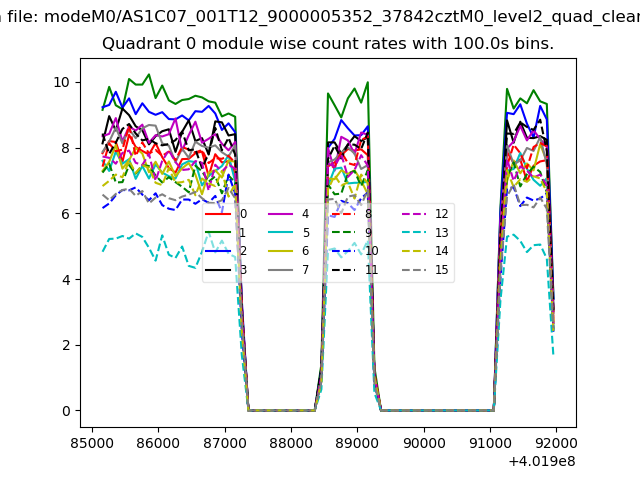 |
 |
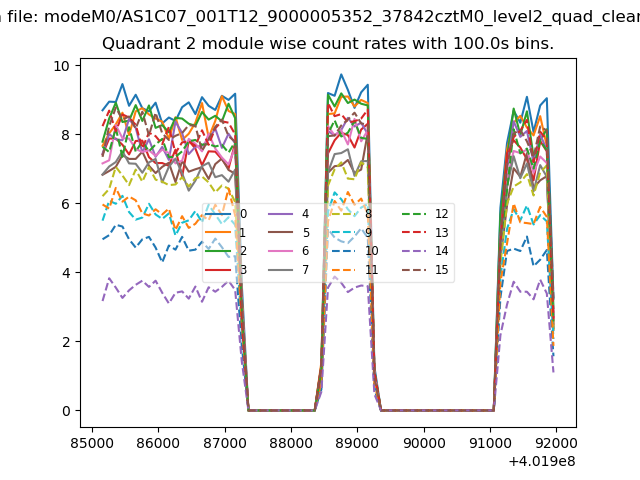
| Module-wise count rates for Quadrant B Data is divided into 100 sec bins |
 |
 |
| Module-wise count rates for Quadrant C Data is divided into 100 sec bins |
 |
 |
| Module-wise count rates for Quadrant D Data is divided into 100 sec bins |
 |
 |
| Parameter | Plot |
|---|---|
| CZT HV Monitor | 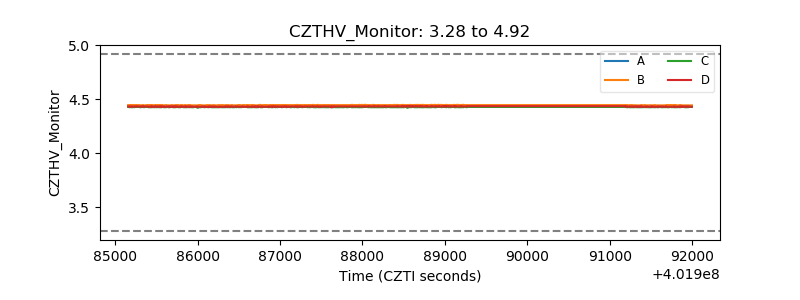 |
| D_VDD | 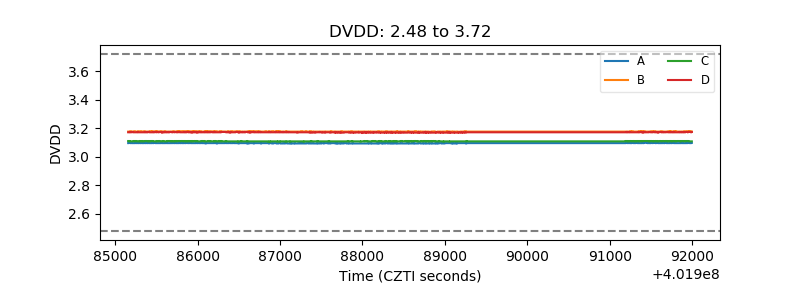 |
| Temperature 1 | 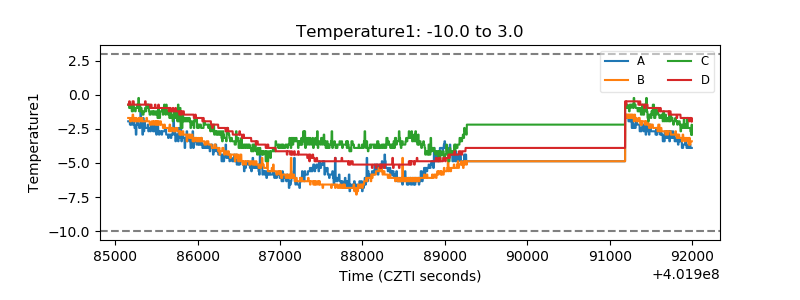 |
| Veto HV Monitor | 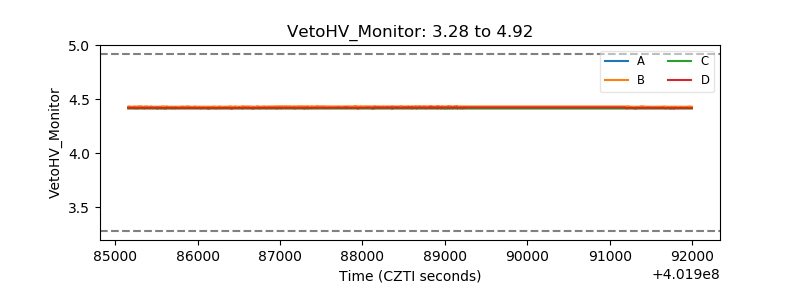 |
| Veto LLD | 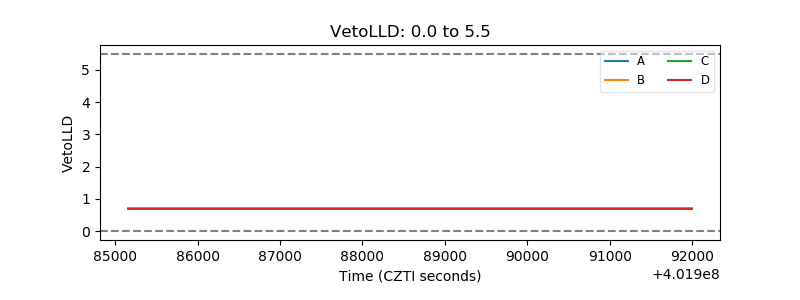 |
| Alpha Counter | 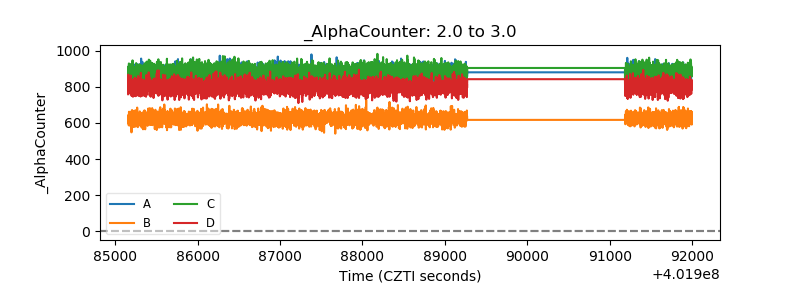 |
| _CPM_Rate | 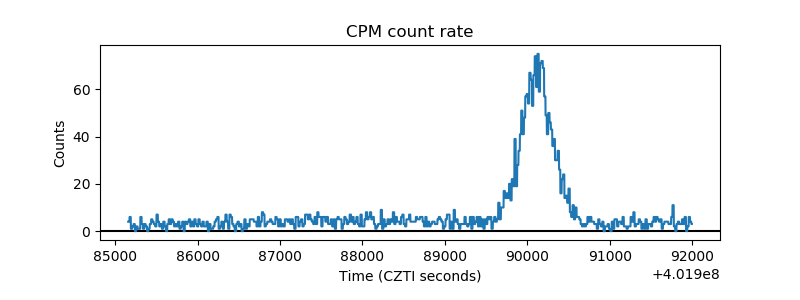 |
| CZT Counter | 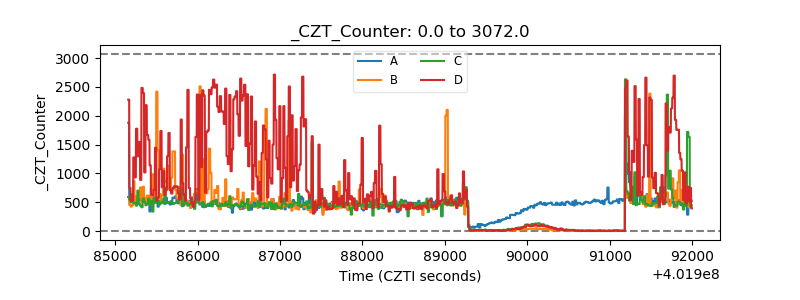 |
| +2.5 Volts monitor | 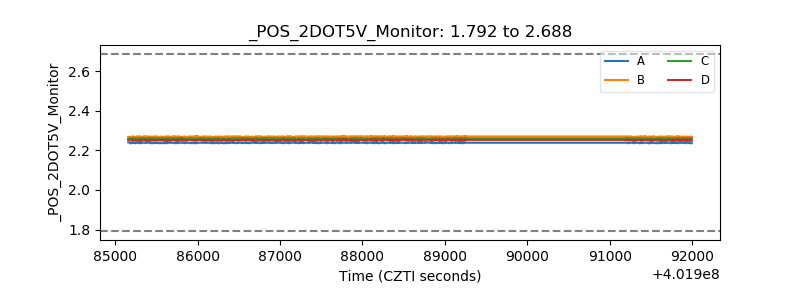 |
| +5 Volts monitor | 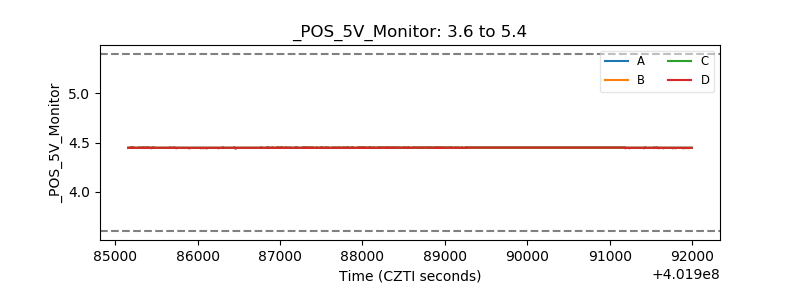 |
| _ROLL_ROT |  |
| _Roll_DEC | 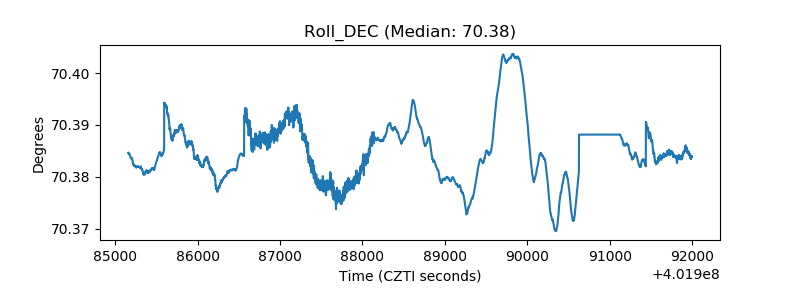 |
| _Roll_RA | 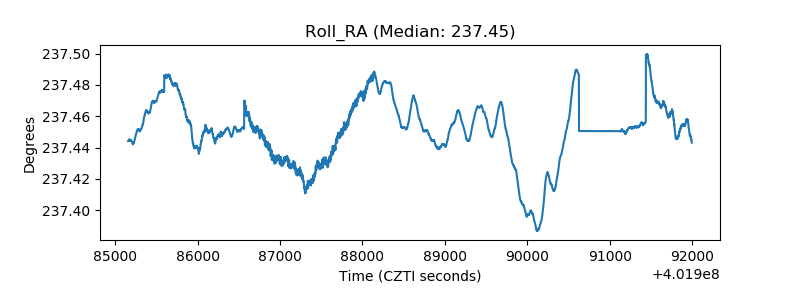 |
| Veto Counter | 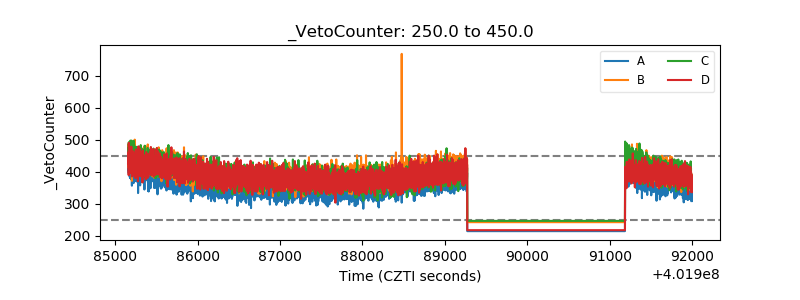 |