| Param | Original file | Final file |
|---|---|---|
| Filename | modeM0/AS1C07_001T12_9000005352_37843cztM0_level2.evt | modeM0/AS1C07_001T12_9000005352_37843cztM0_level2_quad_clean.evt |
| Size (bytes) | 459,535,680 | 75,764,160 |
| Size | 438.2 MB | 72.3 MB |
| Events in quadrant A | 2,833,700 | 507,021 |
| Events in quadrant B | 3,056,159 | 501,426 |
| Events in quadrant C | 3,055,041 | 476,103 |
| Events in quadrant D | 4,594,662 | 420,396 |
| Mode M9 | |||
|---|---|---|---|
| Quadrant | BADHDUFLAG | Total packets | Discarded packets |
| A | 0 | 16 | 0 |
| B | 0 | 16 | 0 |
| C | 0 | 16 | 0 |
| D | 0 | 16 | 0 |
| Mode M0 | |||
|---|---|---|---|
| Quadrant | BADHDUFLAG | Total packets | Discarded packets |
| A | 0 | 11929 | 3 |
| B | 0 | 12925 | 2 |
| C | 0 | 12537 | 2 |
| D | 0 | 17491 | 2 |
| Mode SS | |||
|---|---|---|---|
| Quadrant | BADHDUFLAG | Total packets | Discarded packets |
| A | 0 | 112 | 0 |
| B | 0 | 112 | 0 |
| C | 0 | 112 | 0 |
| D | 0 | 112 | 0 |
| Quadrant | Total seconds | Saturated seconds | Saturation percentage |
|---|---|---|---|
| A | 5564 | 16 | 0.287563% |
| B | 5564 | 110 | 1.976995% |
| C | 5564 | 92 | 1.653487% |
| D | 5565 | 437 | 7.852650% |
Noise dominated data is calculated using 1-second bins in cleaned event files. If a bin has >2000 counts, and if more than 50% of those come from <1% of pixels, then it is considered to be noise-dominated and hence unusable.
| Quadrant | # 1 sec bins | Bins with >0 counts | Bins with >2000 counts | High rate bins dominated by noise | Noise dominated (total time) | Noise dominated (detector-on time) | Marked lightcurve |
|---|---|---|---|---|---|---|---|
| A | 7118 | 5565 | 9 | 9 | 0.13% | 0.16% | 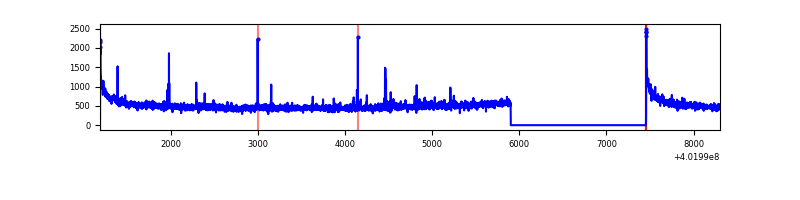 |
| B | 7118 | 5565 | 87 | 87 | 1.22% | 1.56% | 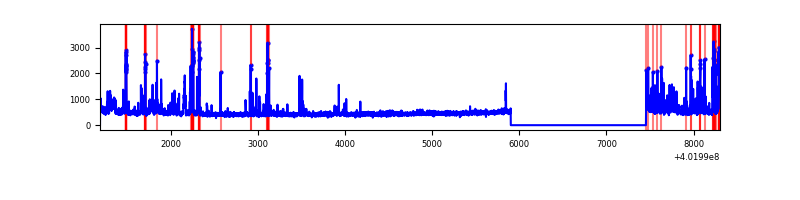 |
| C | 7118 | 5565 | 84 | 84 | 1.18% | 1.51% | 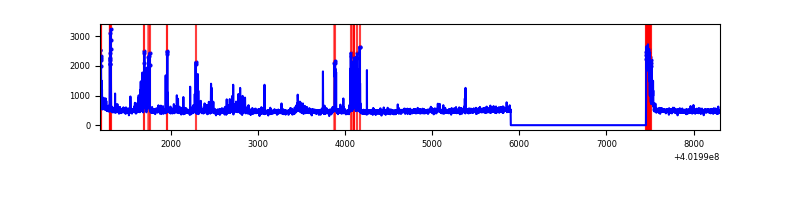 |
| D | 7119 | 5566 | 397 | 397 | 5.58% | 7.13% | 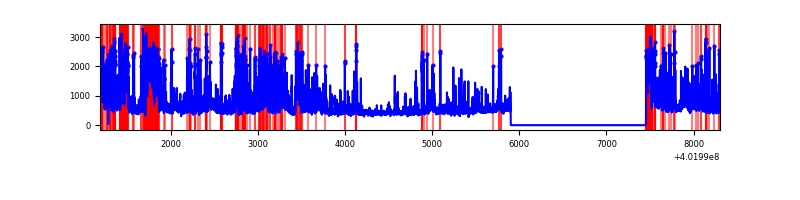 |
Top three noisy pixels from each quadrant. If the there are fewer than three noisy pixels in the level2.evt file, extra rows are filled as -1
| Pixel properties | Quadrant properties | ||||||
|---|---|---|---|---|---|---|---|
| Quadrant | DetID | PixID | Counts | Sigma | Mean | Median | Sigma |
| A | 10 | 83 | 370374 | 3013.05 | 611 | 598 | 122.7 |
| A | 9 | 143 | 30296 | 241.99 | 611 | 598 | 122.7 |
| A | 12 | 189 | 24707 | 196.45 | 611 | 598 | 122.7 |
| B | 5 | 172 | 361960 | 3129.8 | 601 | 585 | 115.5 |
| B | 0 | 229 | 73884 | 634.83 | 601 | 585 | 115.5 |
| B | 4 | 81 | 66607 | 571.8 | 601 | 585 | 115.5 |
| C | 1 | 23 | 310834 | 2238.05 | 592 | 596 | 138.6 |
| C | 15 | 214 | 233304 | 1678.75 | 592 | 596 | 138.6 |
| C | 0 | 10 | 161432 | 1160.27 | 592 | 596 | 138.6 |
| D | 1 | 52 | 722729 | 5136.9 | 580 | 564 | 140.6 |
| D | 13 | 249 | 552120 | 3923.33 | 580 | 564 | 140.6 |
| D | 2 | 250 | 411464 | 2922.81 | 580 | 564 | 140.6 |
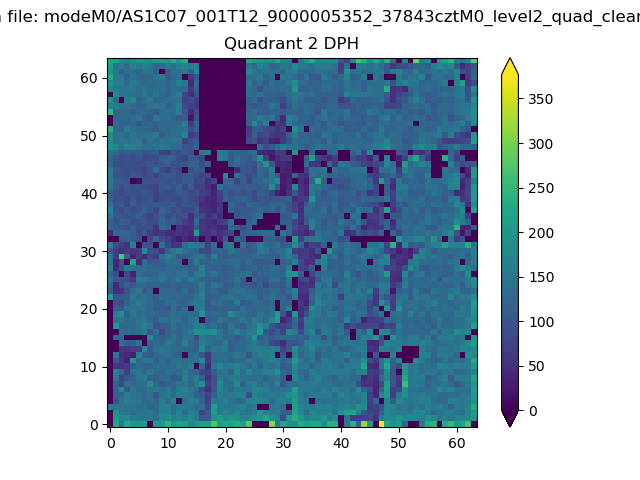
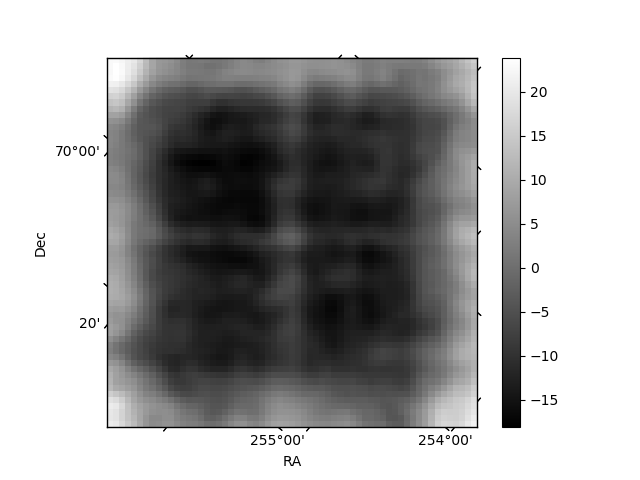
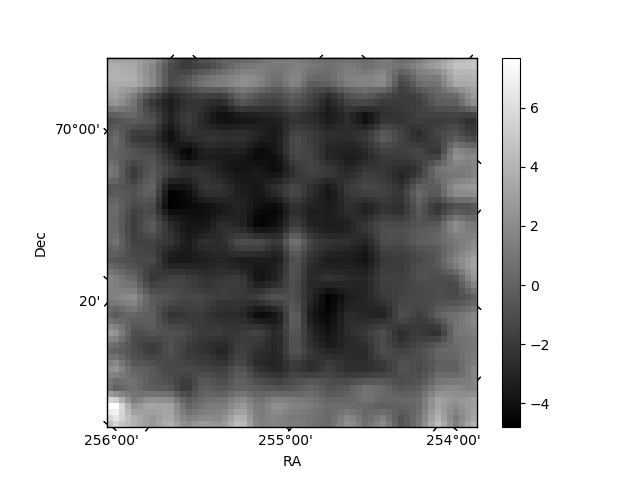
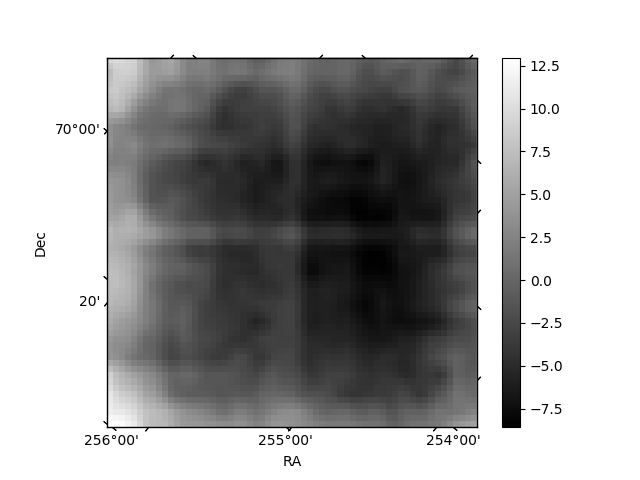
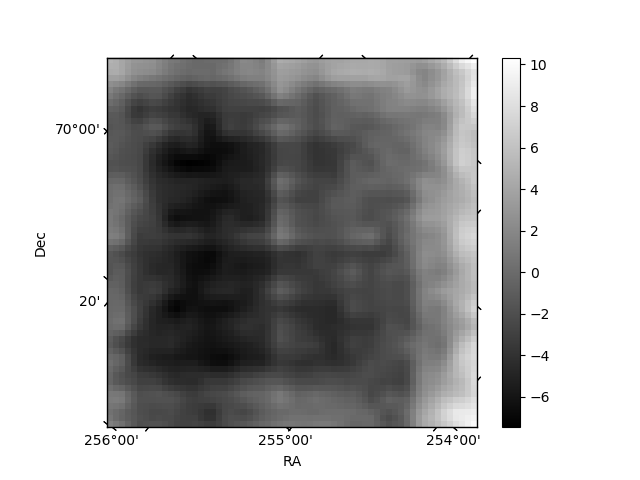
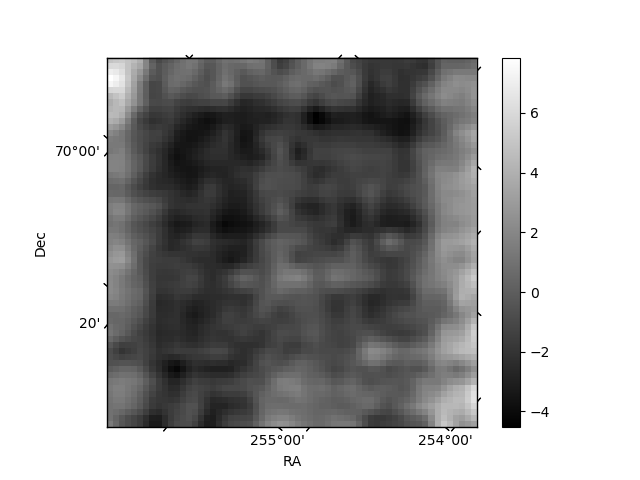
Histogram calculated using DETX and DETY for each event in the final _common_clean file
| Quadrant A | 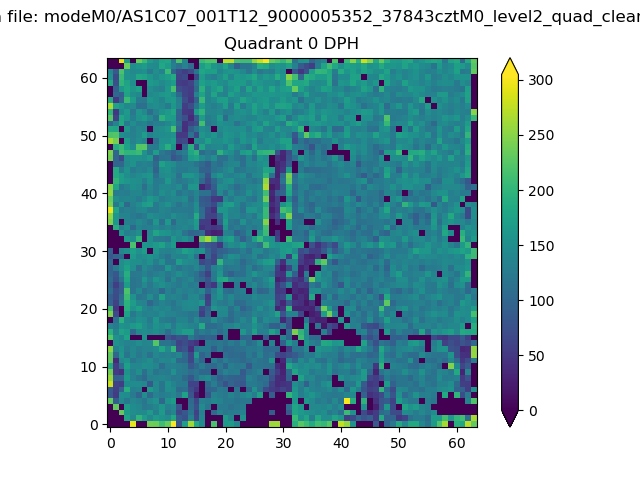 |
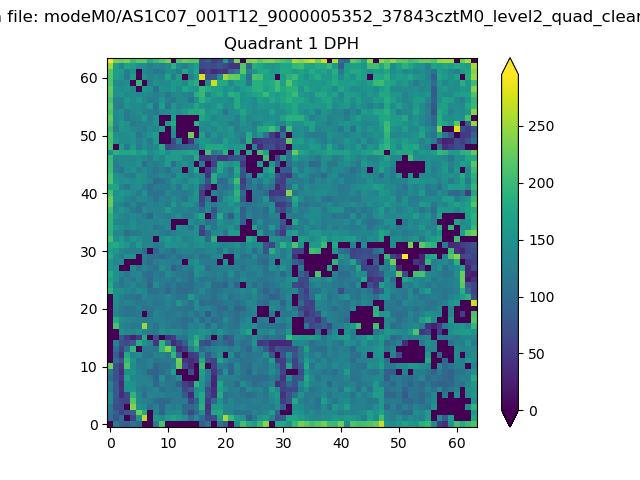 |
Quadrant B |
|---|---|---|---|
| Quadrant D | 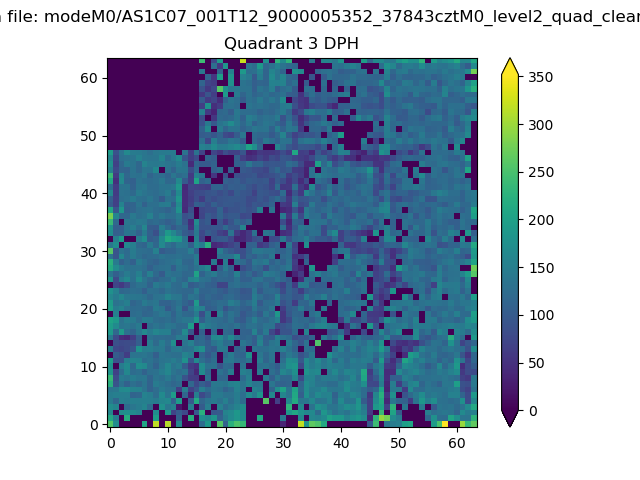 |
 |
Quadrant C |
| Plot type | Count rate plots | Images |
|---|---|---|
| Comparison with Poisson distribution Blue bars denote a histogram of data divided into 1 sec bins. Red curve is a Poisson curve with rate = median count rate of data. |
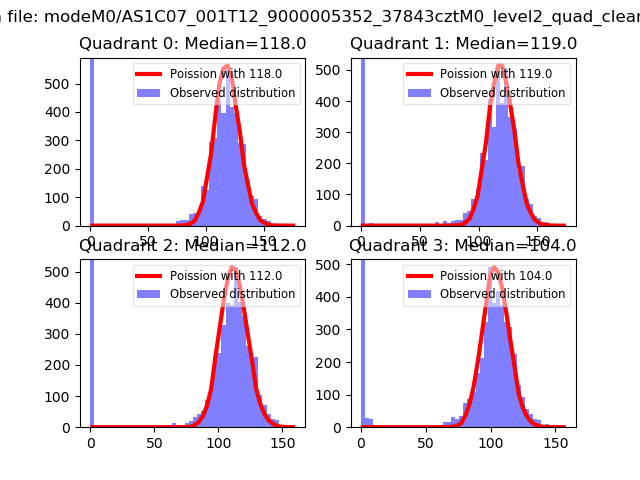 |
 |
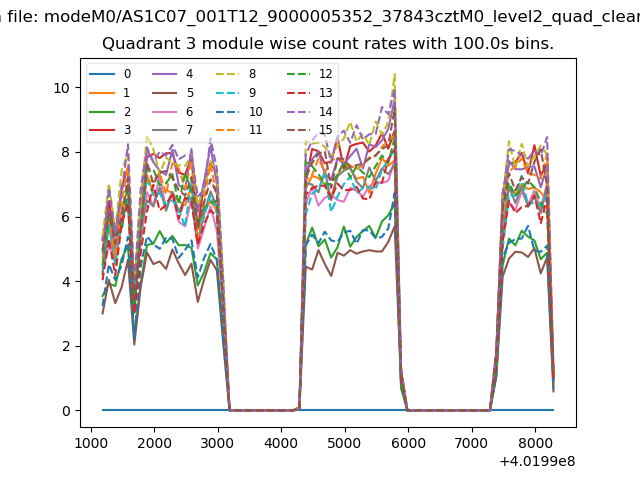
| Quadrant-wise count rates Data is divided into 100 sec bins |
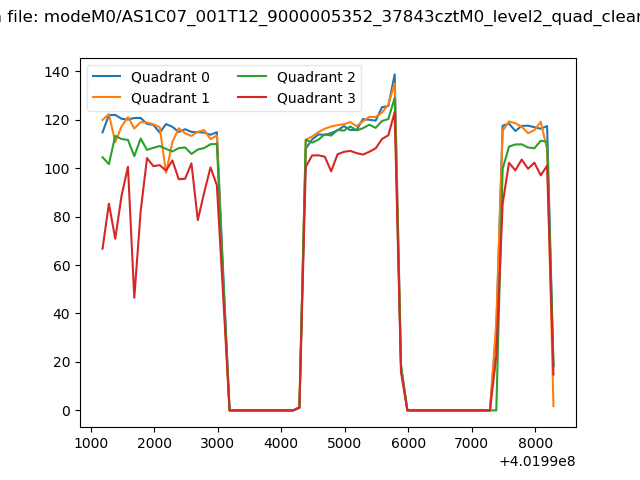 |
|
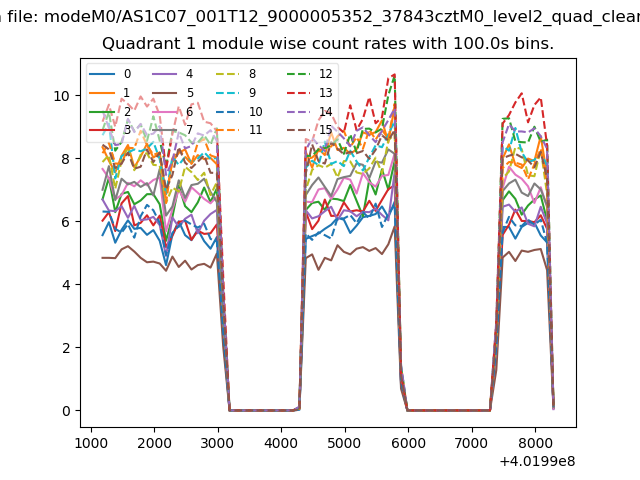
| Module-wise count rates for Quadrant A Data is divided into 100 sec bins |
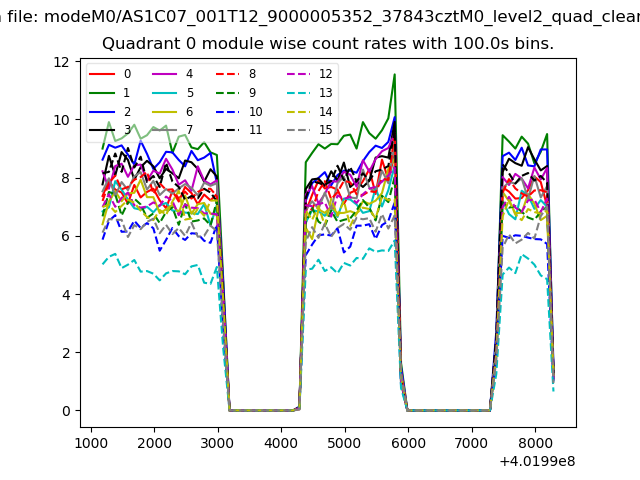 |
 |
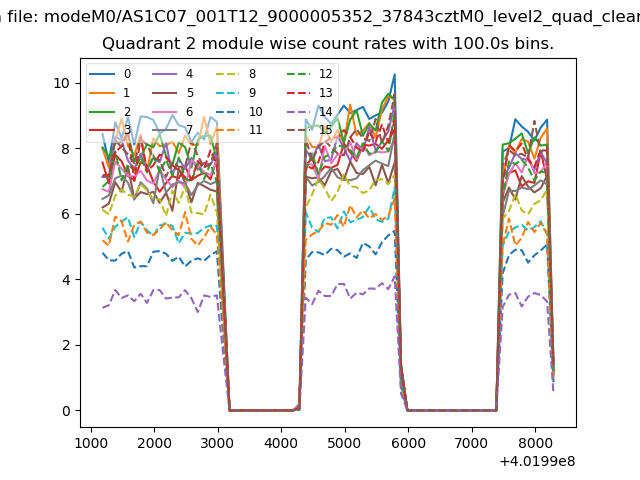
| Module-wise count rates for Quadrant B Data is divided into 100 sec bins |
 |
 |
| Module-wise count rates for Quadrant C Data is divided into 100 sec bins |
 |
 |
| Module-wise count rates for Quadrant D Data is divided into 100 sec bins |
 |
 |
| Parameter | Plot |
|---|---|
| CZT HV Monitor | 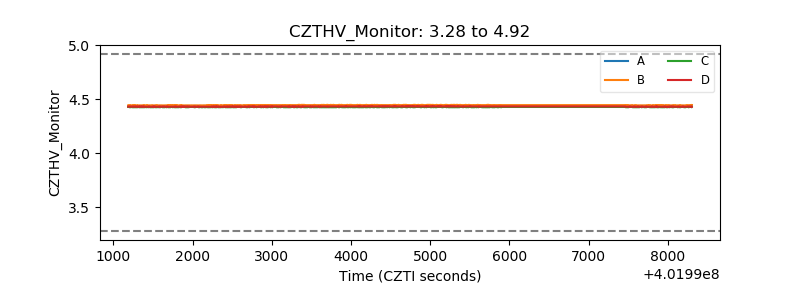 |
| D_VDD | 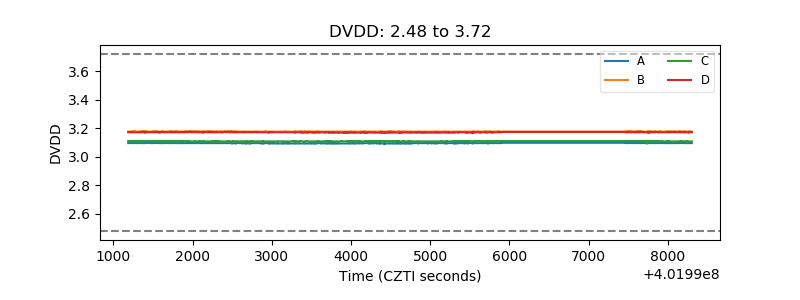 |
| Temperature 1 | 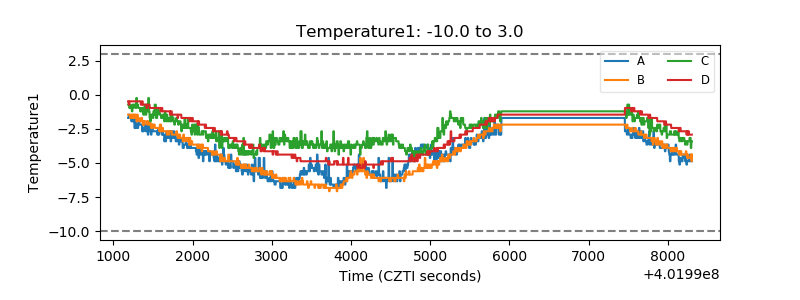 |
| Veto HV Monitor | 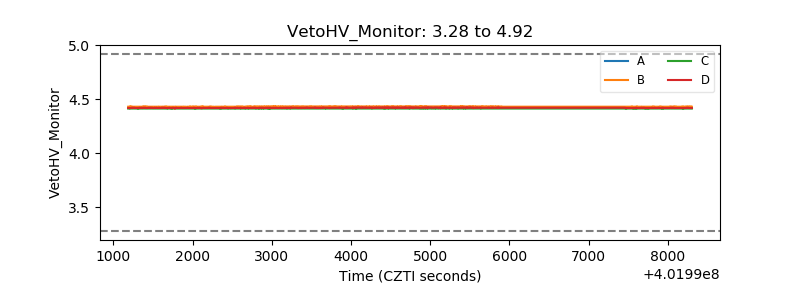 |
| Veto LLD | 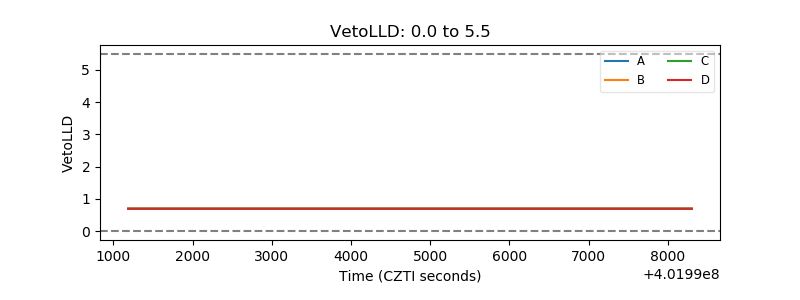 |
| Alpha Counter | 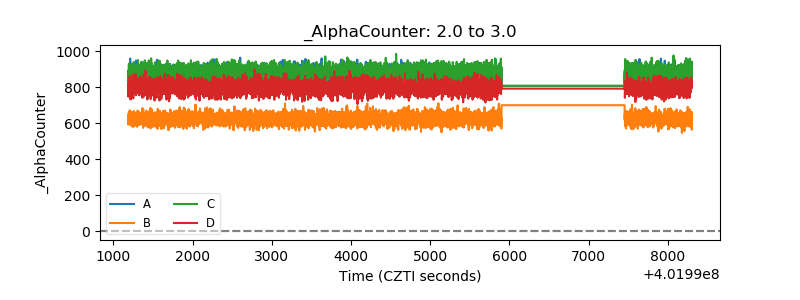 |
| _CPM_Rate | 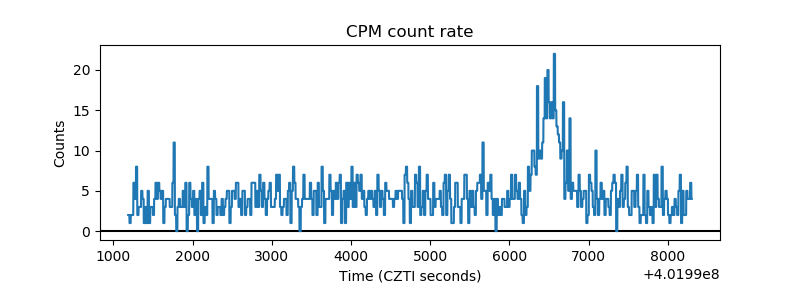 |
| CZT Counter | 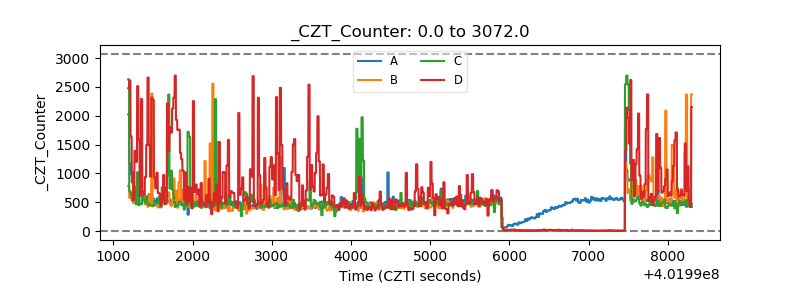 |
| +2.5 Volts monitor | 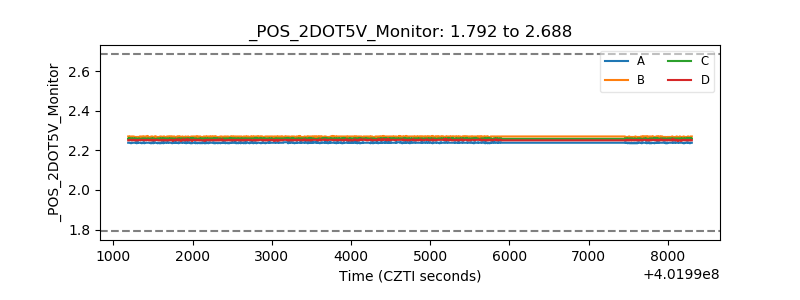 |
| +5 Volts monitor | 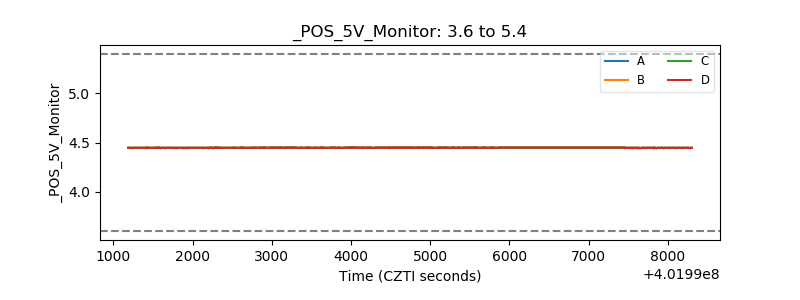 |
| _ROLL_ROT | 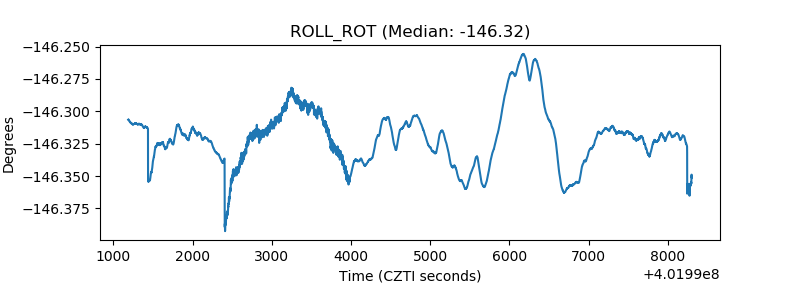 |
| _Roll_DEC | 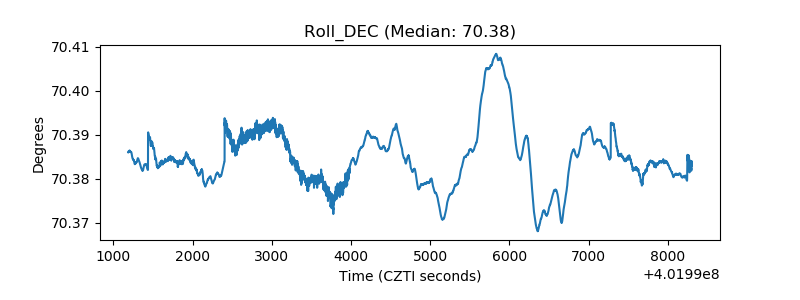 |
| _Roll_RA | 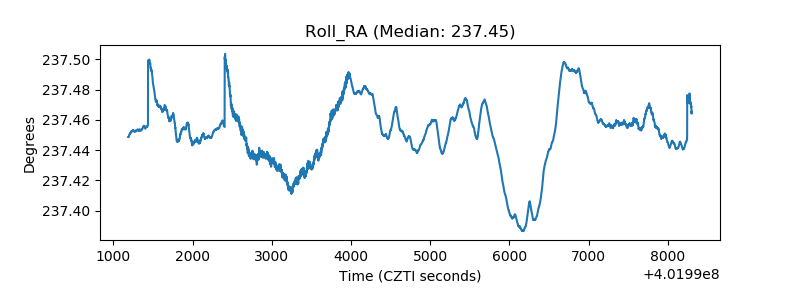 |
| Veto Counter | 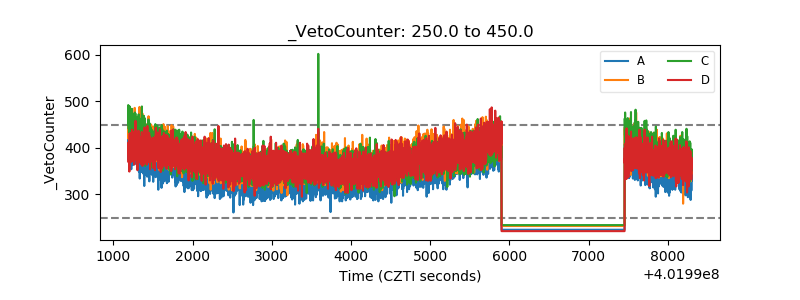 |