| Param | Original file | Final file |
|---|---|---|
| Filename | modeM0/AS1C07_001T12_9000005352_37844cztM0_level2.evt | modeM0/AS1C07_001T12_9000005352_37844cztM0_level2_quad_clean.evt |
| Size (bytes) | 487,051,200 | 85,406,400 |
| Size | 464.5 MB | 81.4 MB |
| Events in quadrant A | 2,929,579 | 562,093 |
| Events in quadrant B | 3,403,750 | 556,279 |
| Events in quadrant C | 2,870,290 | 551,893 |
| Events in quadrant D | 5,153,070 | 510,394 |
| Mode M9 | |||
|---|---|---|---|
| Quadrant | BADHDUFLAG | Total packets | Discarded packets |
| A | 0 | 18 | 0 |
| B | 0 | 18 | 0 |
| C | 0 | 18 | 0 |
| D | 0 | 19 | 0 |
| Mode M0 | |||
|---|---|---|---|
| Quadrant | BADHDUFLAG | Total packets | Discarded packets |
| A | 0 | 12423 | 3 |
| B | 0 | 14171 | 2 |
| C | 0 | 12246 | 2 |
| D | 0 | 19371 | 2 |
| Mode SS | |||
|---|---|---|---|
| Quadrant | BADHDUFLAG | Total packets | Discarded packets |
| A | 0 | 116 | 0 |
| B | 0 | 116 | 0 |
| C | 0 | 116 | 0 |
| D | 0 | 116 | 0 |
| Quadrant | Total seconds | Saturated seconds | Saturation percentage |
|---|---|---|---|
| A | 5807 | 16 | 0.275530% |
| B | 5807 | 167 | 2.875840% |
| C | 5807 | 68 | 1.171001% |
| D | 5807 | 498 | 8.575857% |
Noise dominated data is calculated using 1-second bins in cleaned event files. If a bin has >2000 counts, and if more than 50% of those come from <1% of pixels, then it is considered to be noise-dominated and hence unusable.
| Quadrant | # 1 sec bins | Bins with >0 counts | Bins with >2000 counts | High rate bins dominated by noise | Noise dominated (total time) | Noise dominated (detector-on time) | Marked lightcurve |
|---|---|---|---|---|---|---|---|
| A | 7150 | 5808 | 9 | 9 | 0.13% | 0.15% | 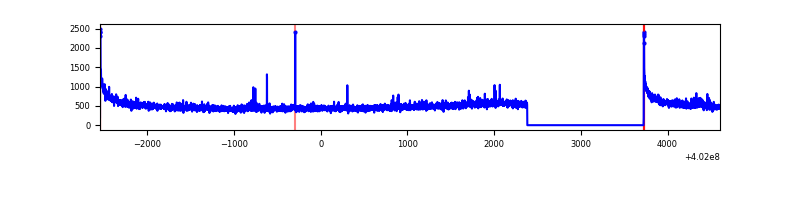 |
| B | 7150 | 5808 | 145 | 145 | 2.03% | 2.50% | 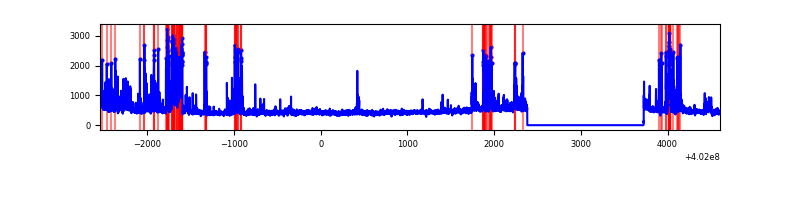 |
| C | 7150 | 5808 | 60 | 60 | 0.84% | 1.03% | 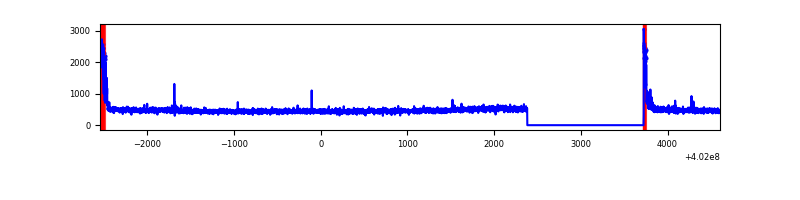 |
| D | 7150 | 5808 | 444 | 444 | 6.21% | 7.64% | 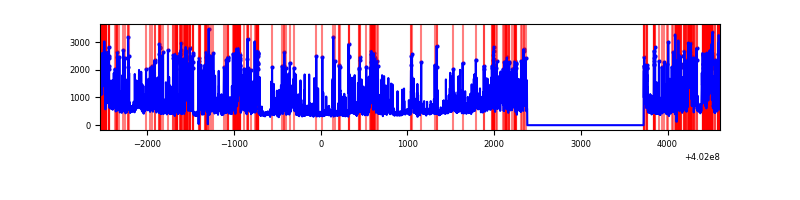 |
Top three noisy pixels from each quadrant. If the there are fewer than three noisy pixels in the level2.evt file, extra rows are filled as -1
| Pixel properties | Quadrant properties | ||||||
|---|---|---|---|---|---|---|---|
| Quadrant | DetID | PixID | Counts | Sigma | Mean | Median | Sigma |
| A | 10 | 83 | 371893 | 2886.89 | 636 | 621 | 128.6 |
| A | 15 | 222 | 41470 | 317.62 | 636 | 621 | 128.6 |
| A | 13 | 6 | 17650 | 132.41 | 636 | 621 | 128.6 |
| B | 5 | 172 | 600749 | 4972.46 | 628 | 611 | 120.7 |
| B | 4 | 81 | 75489 | 620.4 | 628 | 611 | 120.7 |
| B | 0 | 229 | 62543 | 513.14 | 628 | 611 | 120.7 |
| C | 15 | 214 | 241879 | 1655.55 | 619 | 622 | 145.7 |
| C | 0 | 10 | 200172 | 1369.35 | 619 | 622 | 145.7 |
| C | 14 | 67 | 6984 | 43.66 | 619 | 622 | 145.7 |
| D | 1 | 52 | 1689070 | 11491.56 | 603 | 587 | 146.9 |
| D | 2 | 249 | 605038 | 4113.8 | 603 | 587 | 146.9 |
| D | 13 | 249 | 187307 | 1270.79 | 603 | 587 | 146.9 |
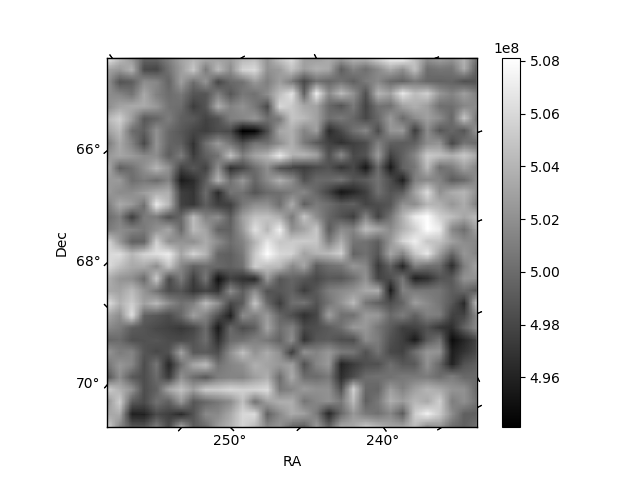
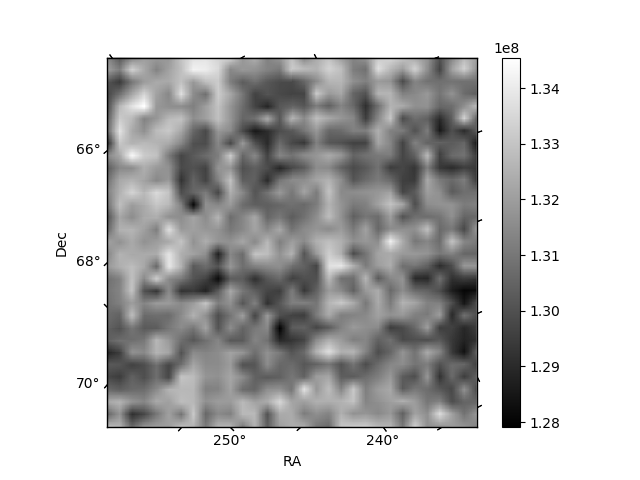
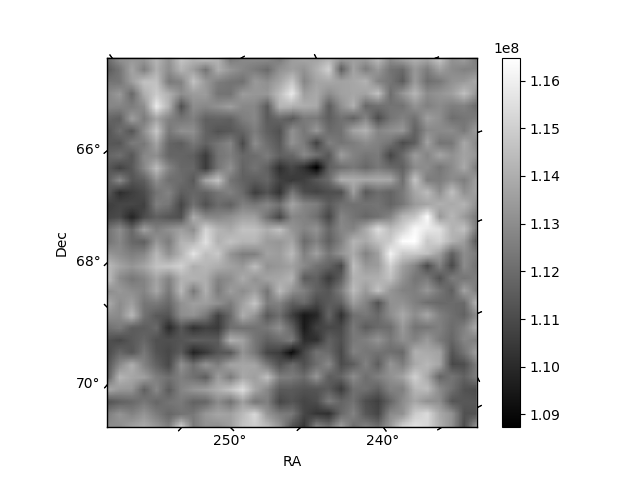
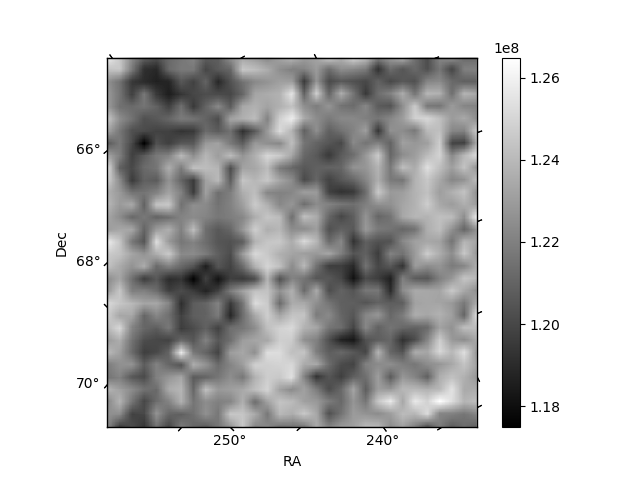
Histogram calculated using DETX and DETY for each event in the final _common_clean file
| Quadrant A | 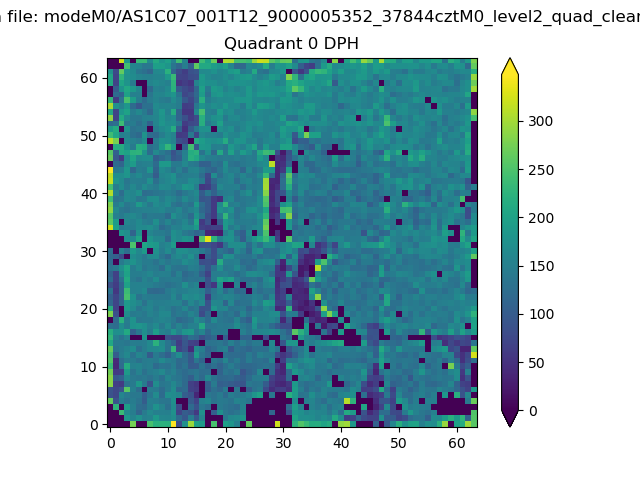 |
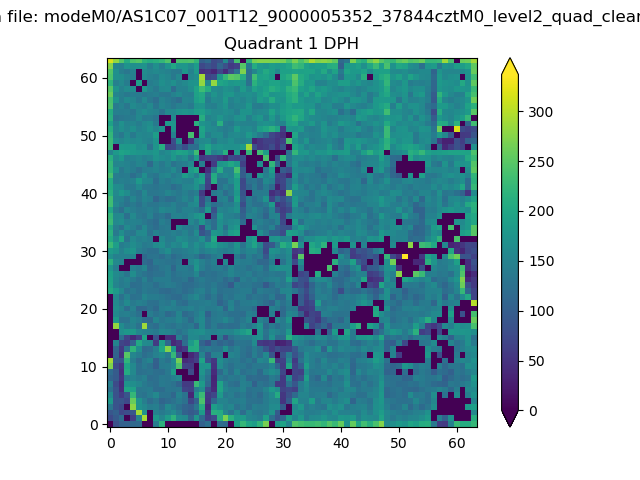 |
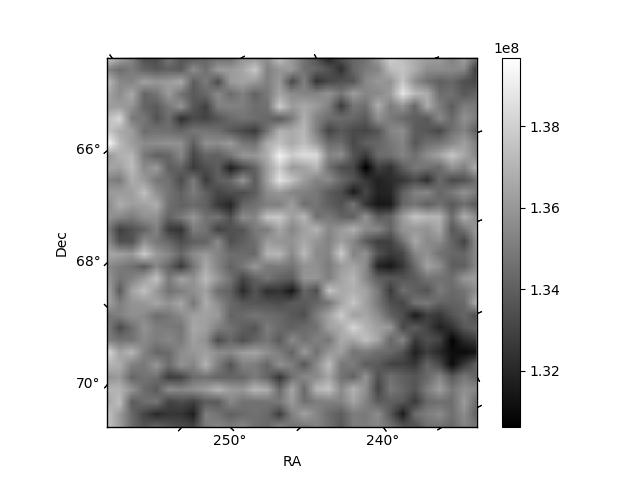
Quadrant B |
|---|---|---|---|
| Quadrant D | 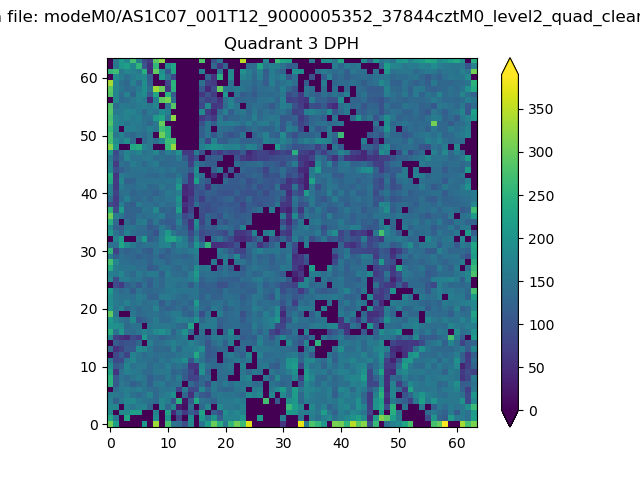 |
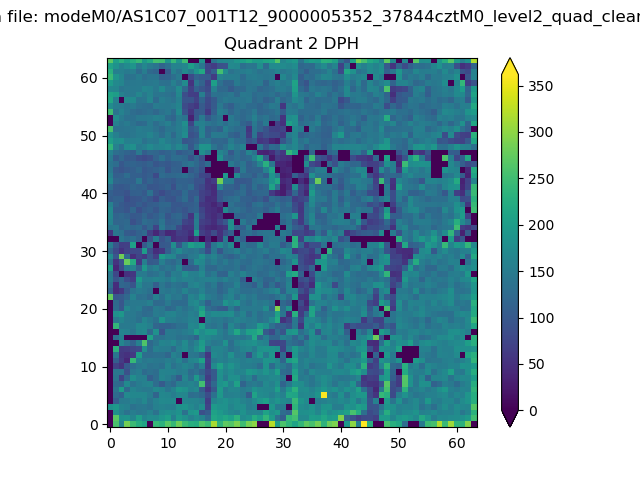 |
Quadrant C |
| Plot type | Count rate plots | Images |
|---|---|---|
| Comparison with Poisson distribution Blue bars denote a histogram of data divided into 1 sec bins. Red curve is a Poisson curve with rate = median count rate of data. |
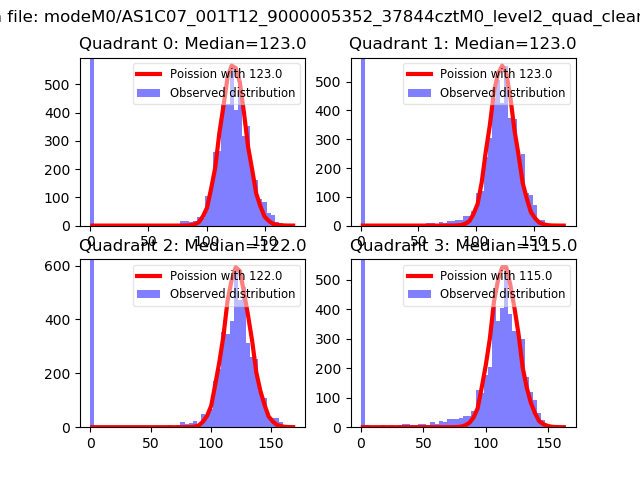 |
 |
| Quadrant-wise count rates Data is divided into 100 sec bins |
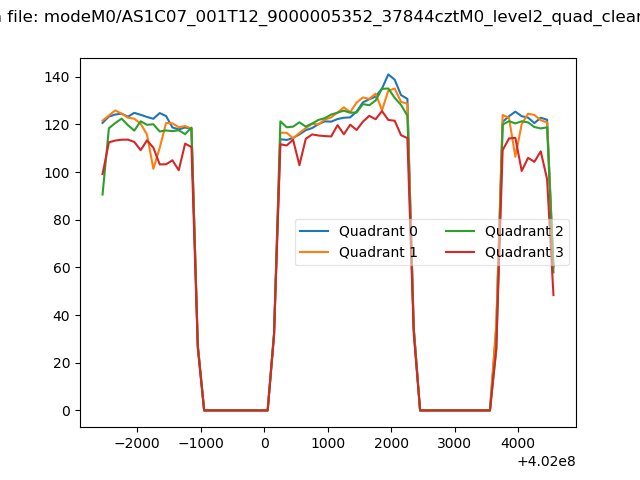 |
|
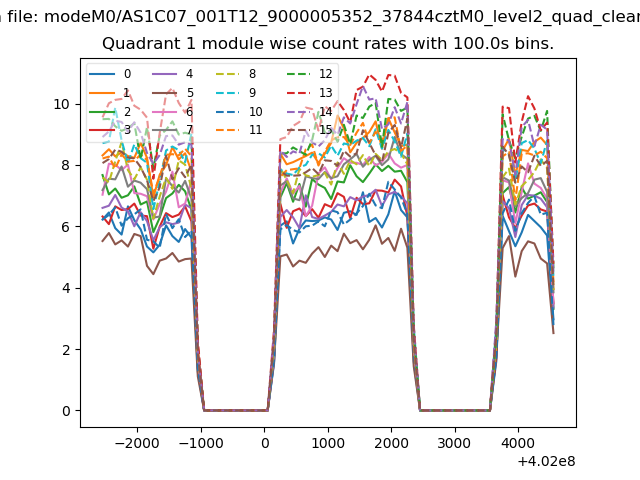
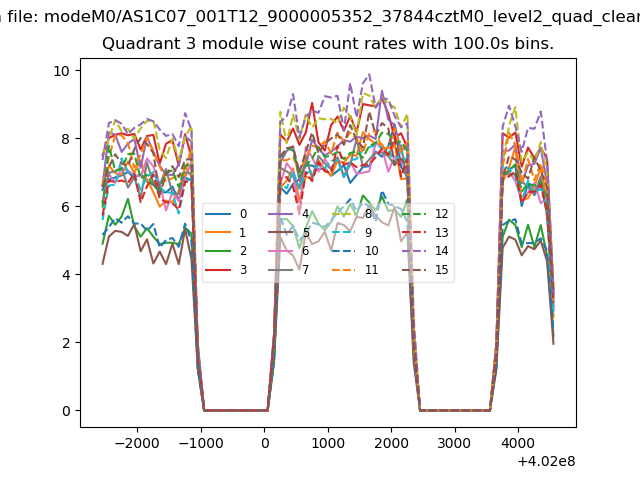
| Module-wise count rates for Quadrant A Data is divided into 100 sec bins |
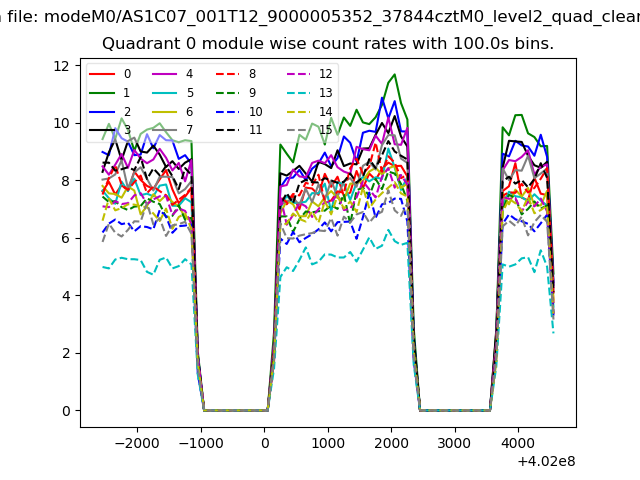 |
 |
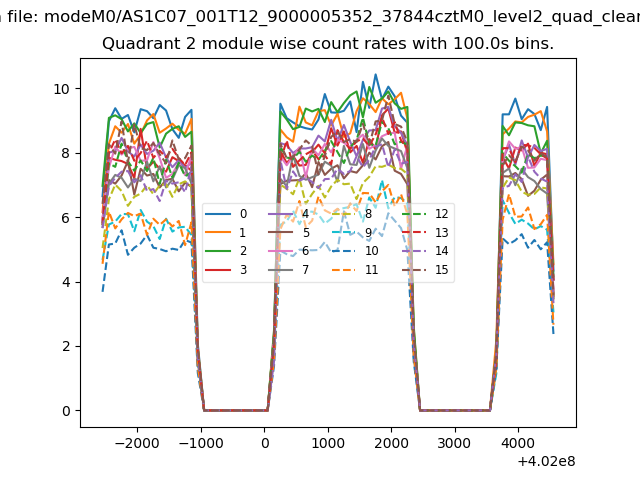
| Module-wise count rates for Quadrant B Data is divided into 100 sec bins |
 |
 |
| Module-wise count rates for Quadrant C Data is divided into 100 sec bins |
 |
 |
| Module-wise count rates for Quadrant D Data is divided into 100 sec bins |
 |
 |
| Parameter | Plot |
|---|---|
| CZT HV Monitor |  |
| D_VDD | 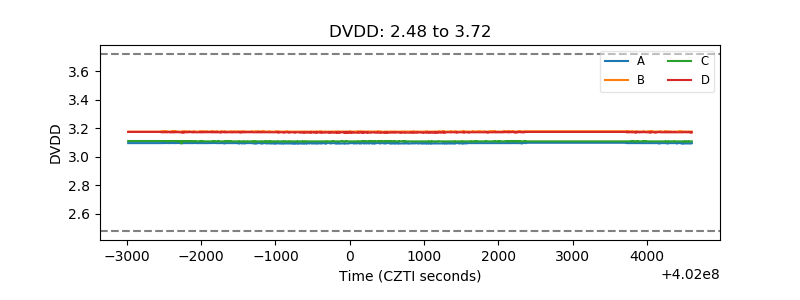 |
| Temperature 1 | 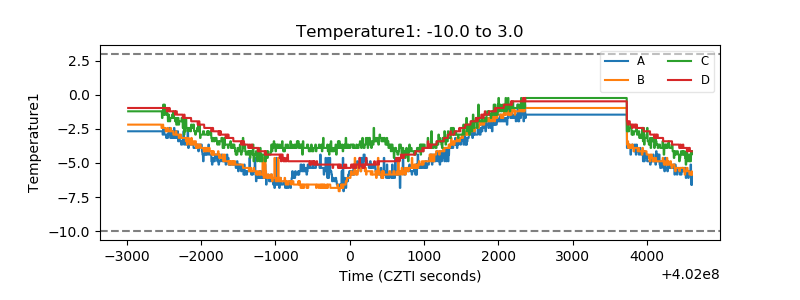 |
| Veto HV Monitor | 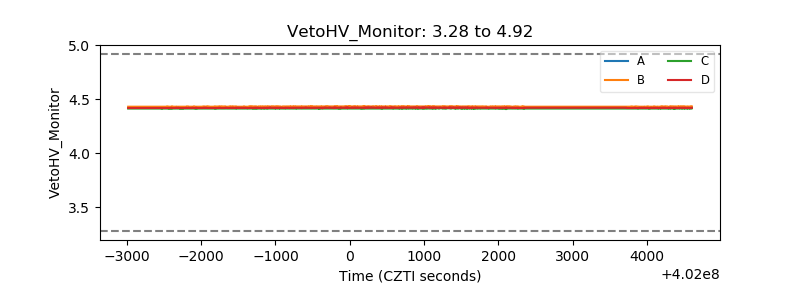 |
| Veto LLD | 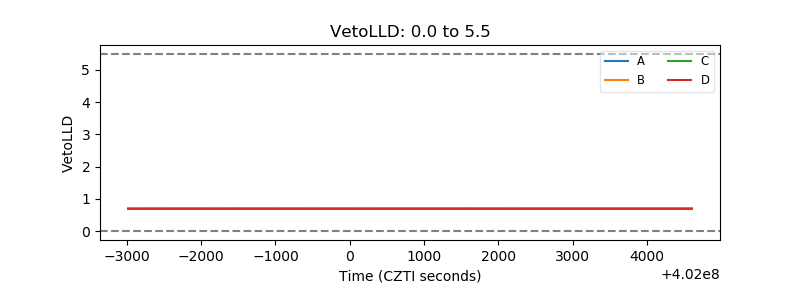 |
| Alpha Counter | 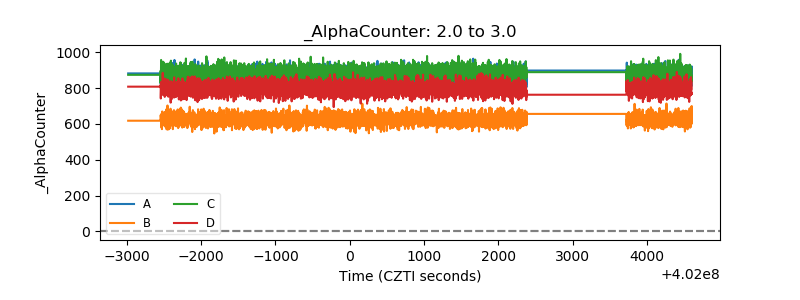 |
| _CPM_Rate | 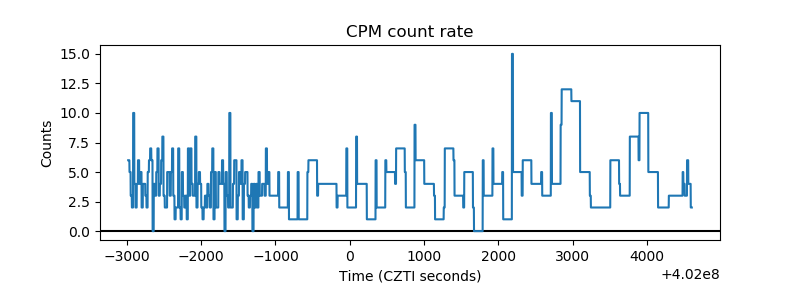 |
| CZT Counter | 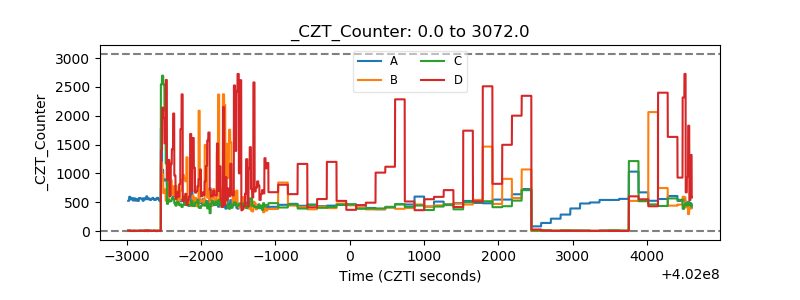 |
| +2.5 Volts monitor | 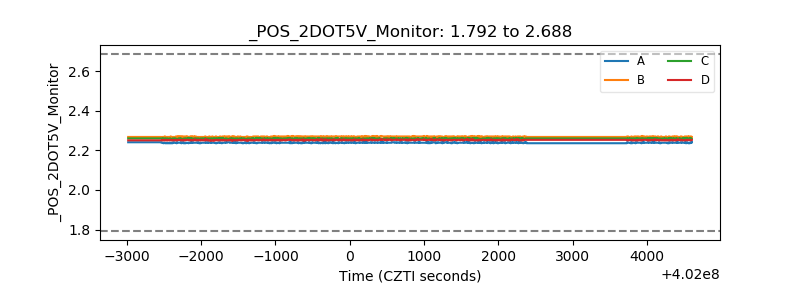 |
| +5 Volts monitor | 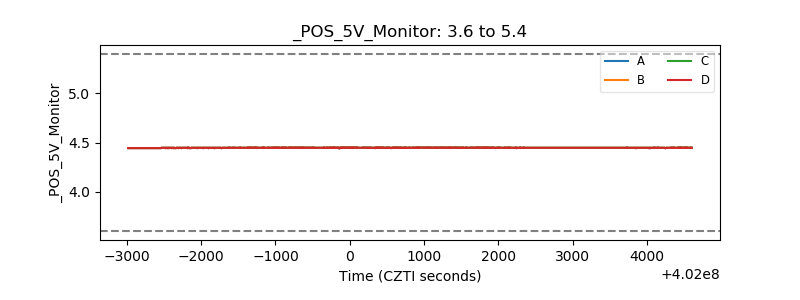 |
| _ROLL_ROT | 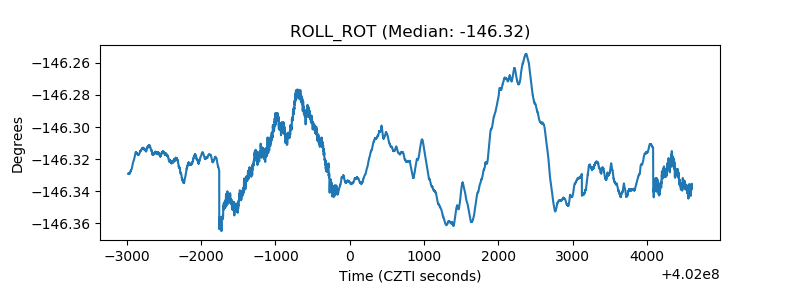 |
| _Roll_DEC | 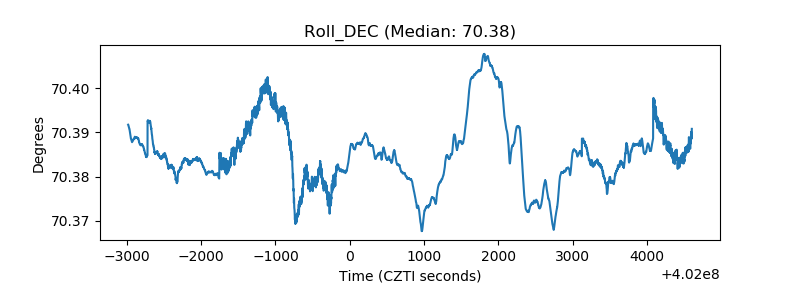 |
| _Roll_RA | 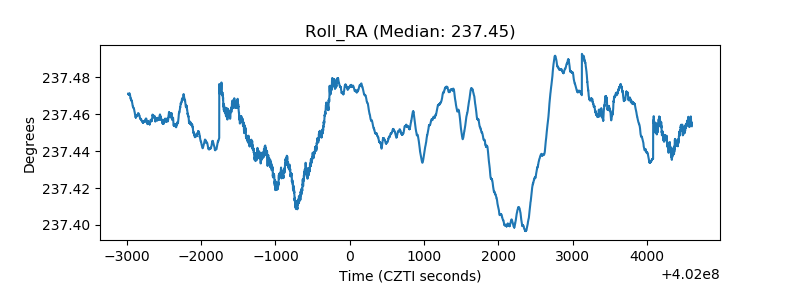 |
| Veto Counter | 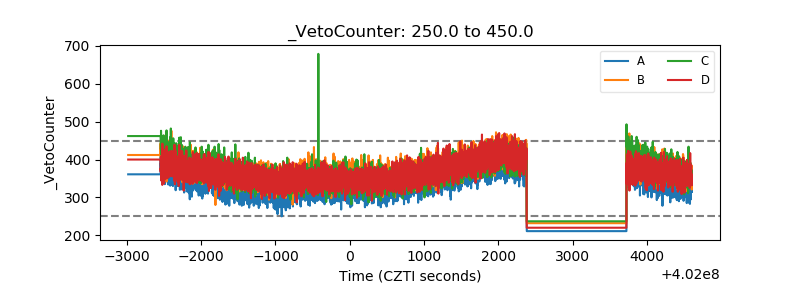 |