| Param | Original file | Final file |
|---|---|---|
| Filename | modeM0/AS1C07_001T12_9000005352_37845cztM0_level2.evt | modeM0/AS1C07_001T12_9000005352_37845cztM0_level2_quad_clean.evt |
| Size (bytes) | 501,471,360 | 82,074,240 |
| Size | 478.2 MB | 78.3 MB |
| Events in quadrant A | 3,026,646 | 534,028 |
| Events in quadrant B | 3,316,812 | 532,200 |
| Events in quadrant C | 2,877,290 | 528,426 |
| Events in quadrant D | 5,565,675 | 477,843 |
| Mode M9 | |||
|---|---|---|---|
| Quadrant | BADHDUFLAG | Total packets | Discarded packets |
| A | 0 | 22 | 0 |
| B | 0 | 22 | 0 |
| C | 0 | 22 | 0 |
| D | 0 | 23 | 0 |
| Mode M0 | |||
|---|---|---|---|
| Quadrant | BADHDUFLAG | Total packets | Discarded packets |
| A | 0 | 12781 | 3 |
| B | 0 | 13968 | 2 |
| C | 0 | 12343 | 2 |
| D | 0 | 20678 | 2 |
| Mode SS | |||
|---|---|---|---|
| Quadrant | BADHDUFLAG | Total packets | Discarded packets |
| A | 0 | 120 | 0 |
| B | 0 | 120 | 0 |
| C | 0 | 120 | 0 |
| D | 0 | 120 | 0 |
| Quadrant | Total seconds | Saturated seconds | Saturation percentage |
|---|---|---|---|
| A | 5903 | 17 | 0.287989% |
| B | 5903 | 173 | 2.930713% |
| C | 5903 | 39 | 0.660681% |
| D | 5903 | 692 | 11.722853% |
Noise dominated data is calculated using 1-second bins in cleaned event files. If a bin has >2000 counts, and if more than 50% of those come from <1% of pixels, then it is considered to be noise-dominated and hence unusable.
| Quadrant | # 1 sec bins | Bins with >0 counts | Bins with >2000 counts | High rate bins dominated by noise | Noise dominated (total time) | Noise dominated (detector-on time) | Marked lightcurve |
|---|---|---|---|---|---|---|---|
| A | 7215 | 5904 | 11 | 11 | 0.15% | 0.19% | 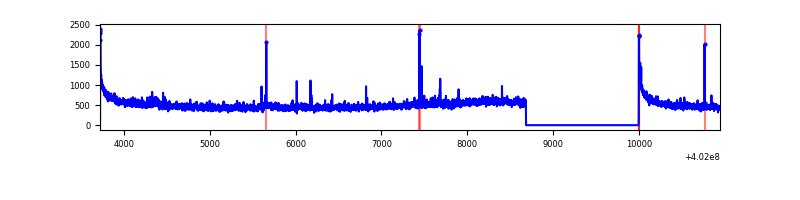 |
| B | 7215 | 5904 | 130 | 130 | 1.80% | 2.20% | 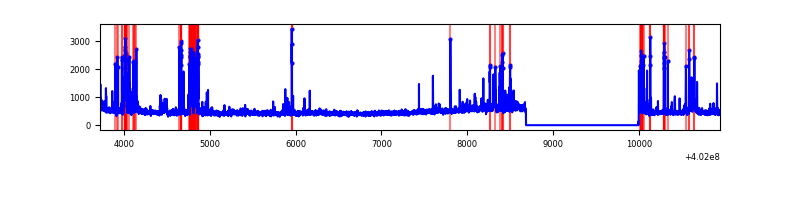 |
| C | 7215 | 5904 | 34 | 34 | 0.47% | 0.58% | 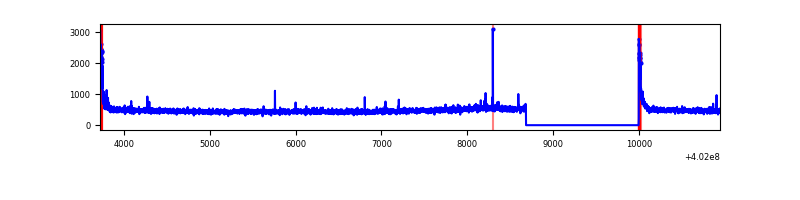 |
| D | 7215 | 5904 | 584 | 584 | 8.09% | 9.89% | 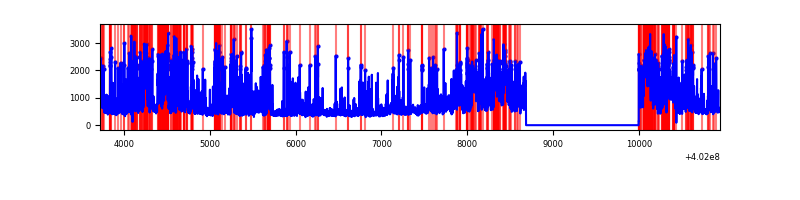 |
Top three noisy pixels from each quadrant. If the there are fewer than three noisy pixels in the level2.evt file, extra rows are filled as -1
| Pixel properties | Quadrant properties | ||||||
|---|---|---|---|---|---|---|---|
| Quadrant | DetID | PixID | Counts | Sigma | Mean | Median | Sigma |
| A | 10 | 83 | 366874 | 2792.3 | 647 | 635 | 131.2 |
| A | 15 | 222 | 95027 | 719.67 | 647 | 635 | 131.2 |
| A | 9 | 143 | 17941 | 131.95 | 647 | 635 | 131.2 |
| B | 5 | 172 | 530167 | 4306.35 | 639 | 621 | 123.0 |
| B | 4 | 81 | 51700 | 415.38 | 639 | 621 | 123.0 |
| B | 0 | 213 | 43095 | 345.41 | 639 | 621 | 123.0 |
| C | 15 | 214 | 247363 | 1671.56 | 632 | 636 | 147.6 |
| C | 0 | 10 | 137936 | 930.2 | 632 | 636 | 147.6 |
| C | 4 | 0 | 9219 | 58.15 | 632 | 636 | 147.6 |
| D | 1 | 52 | 1687815 | 11330.74 | 607 | 589 | 148.9 |
| D | 2 | 249 | 878761 | 5897.46 | 607 | 589 | 148.9 |
| D | 13 | 249 | 224249 | 1502.01 | 607 | 589 | 148.9 |
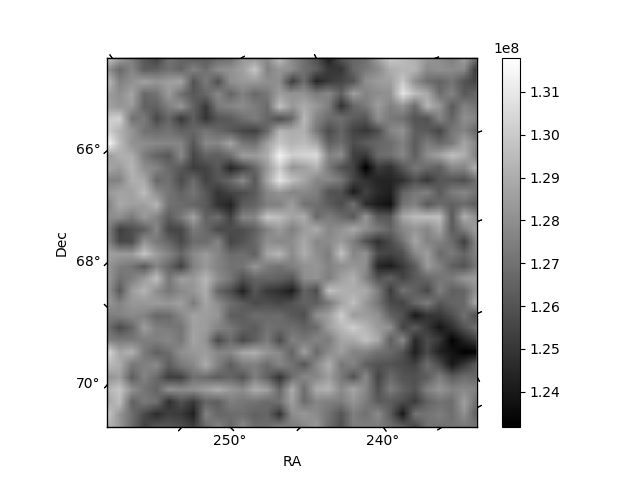
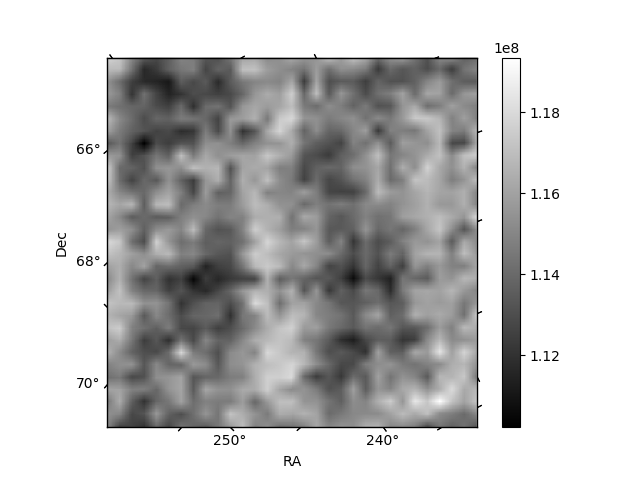
Histogram calculated using DETX and DETY for each event in the final _common_clean file
| Quadrant A | 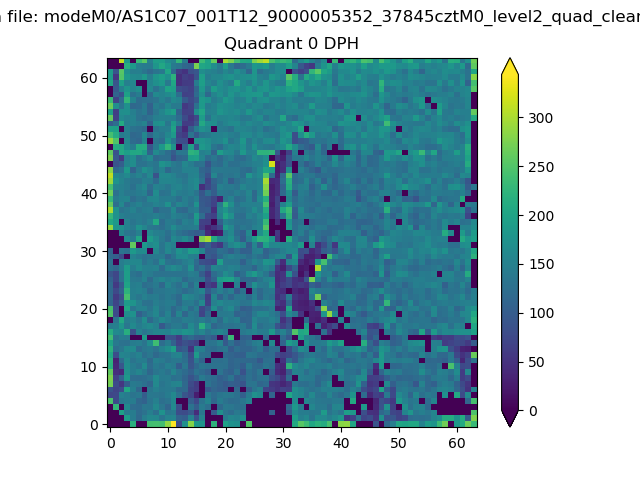 |
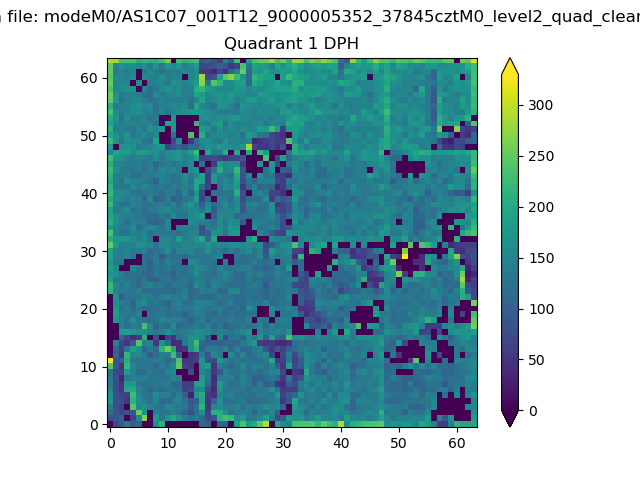 |
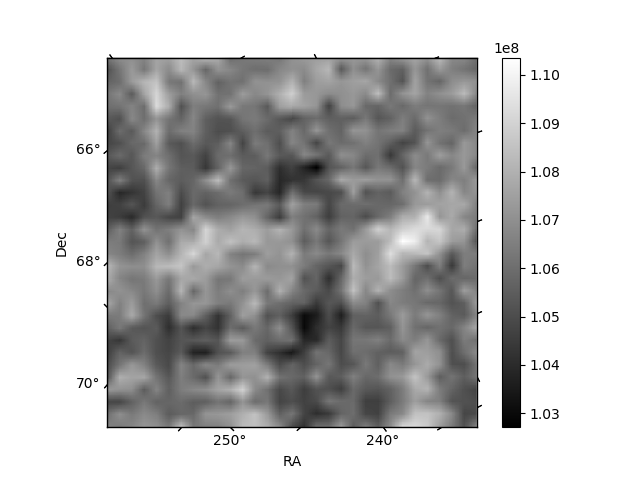
Quadrant B |
|---|---|---|---|
| Quadrant D | 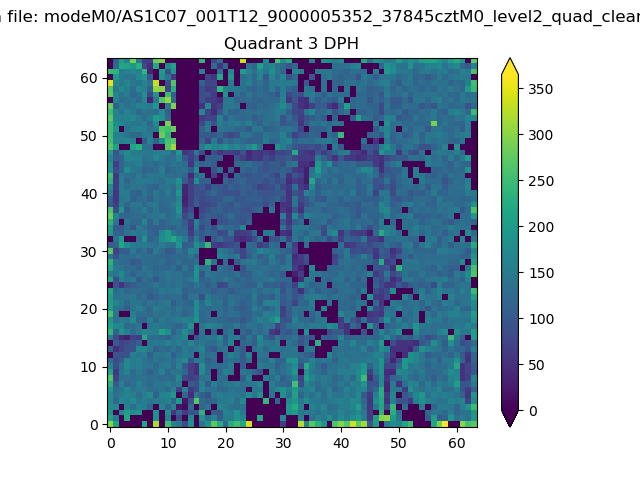 |
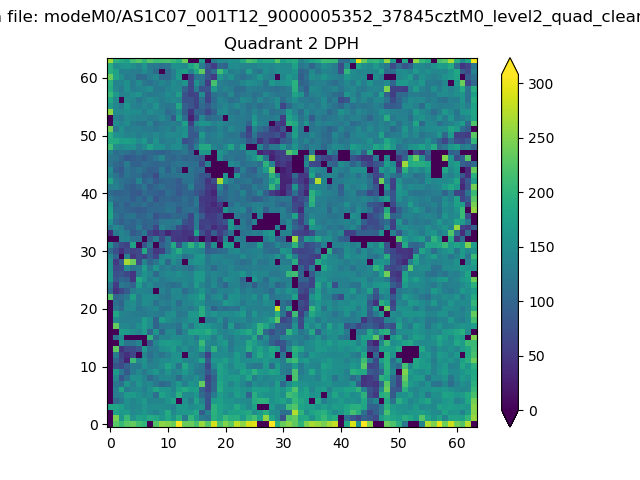 |
Quadrant C |
| Plot type | Count rate plots | Images |
|---|---|---|
| Comparison with Poisson distribution Blue bars denote a histogram of data divided into 1 sec bins. Red curve is a Poisson curve with rate = median count rate of data. |
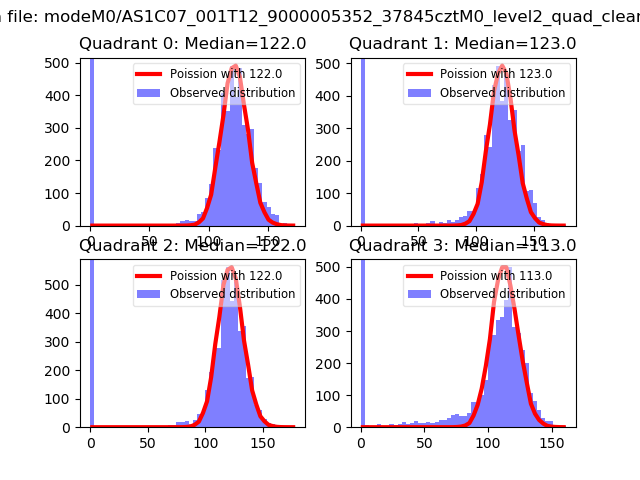 |
 |
| Quadrant-wise count rates Data is divided into 100 sec bins |
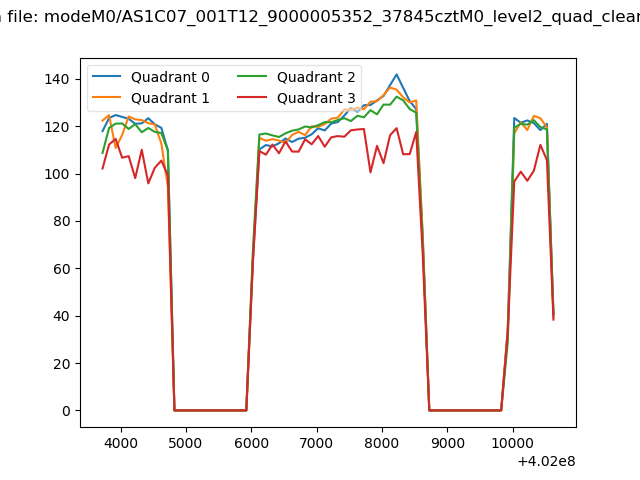 |
|
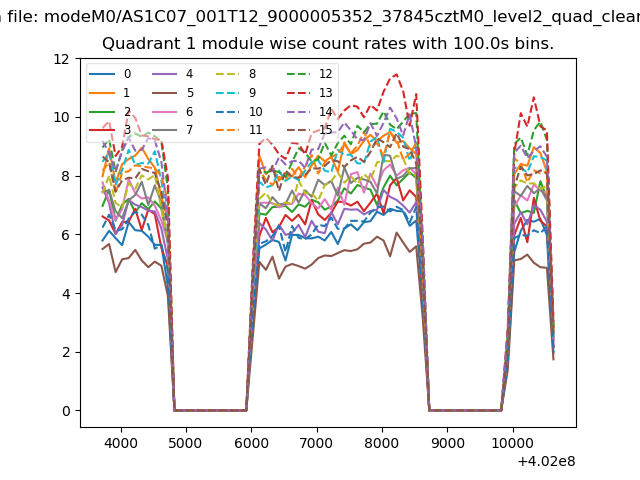
| Module-wise count rates for Quadrant A Data is divided into 100 sec bins |
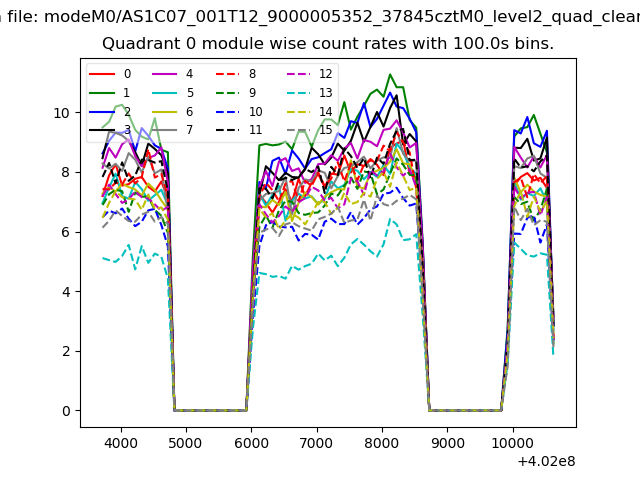 |
 |
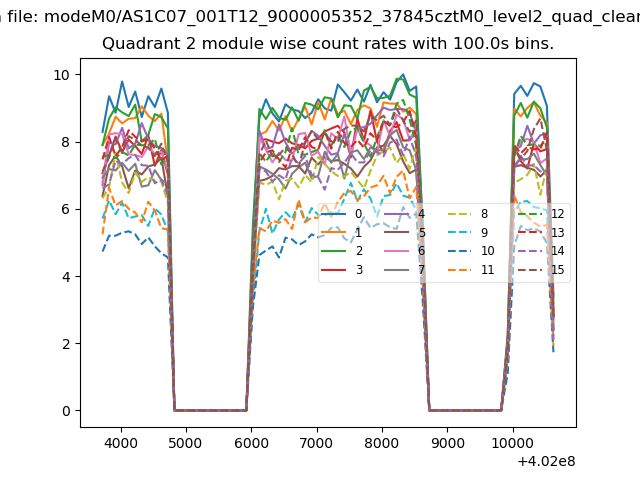
| Module-wise count rates for Quadrant B Data is divided into 100 sec bins |
 |
 |
| Module-wise count rates for Quadrant C Data is divided into 100 sec bins |
 |
 |
| Module-wise count rates for Quadrant D Data is divided into 100 sec bins |
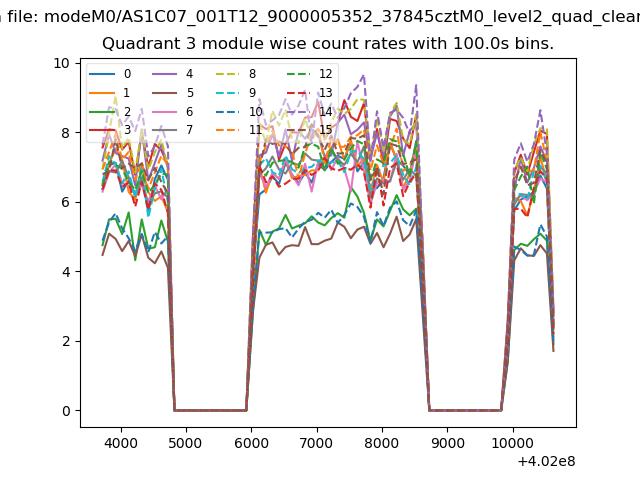 |
 |
| Parameter | Plot |
|---|---|
| CZT HV Monitor | 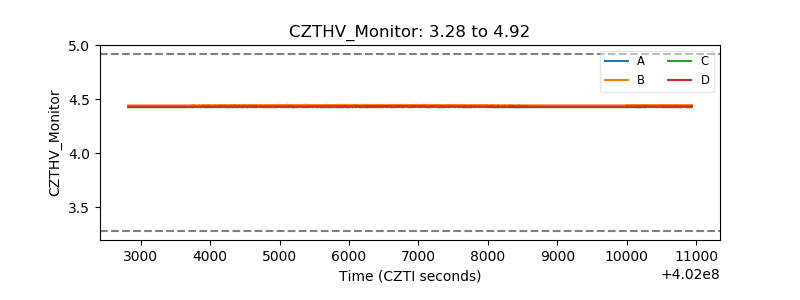 |
| D_VDD | 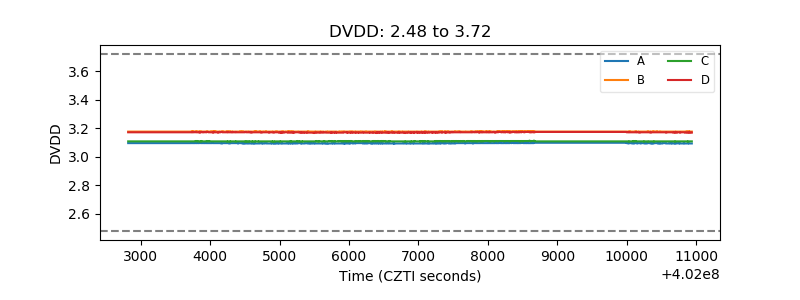 |
| Temperature 1 | 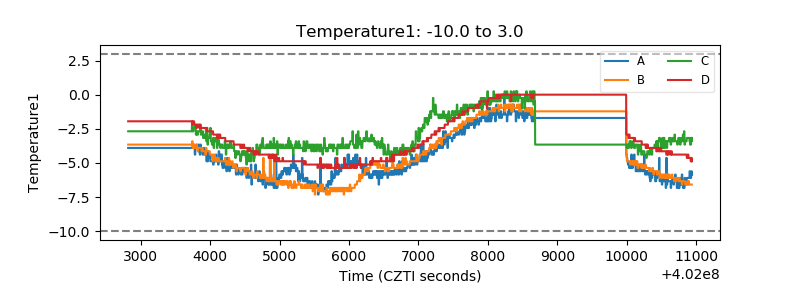 |
| Veto HV Monitor | 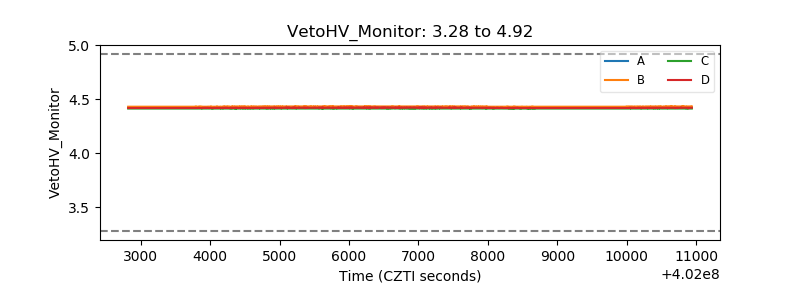 |
| Veto LLD | 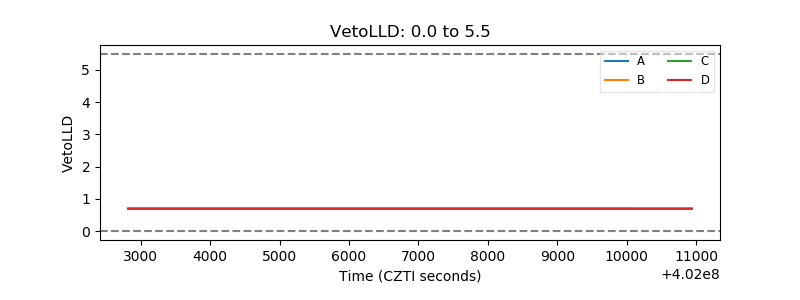 |
| Alpha Counter | 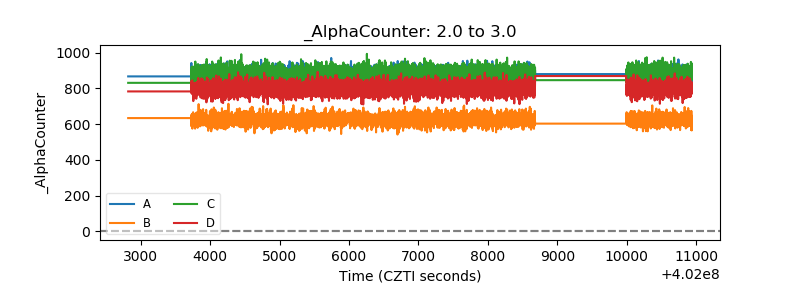 |
| _CPM_Rate | 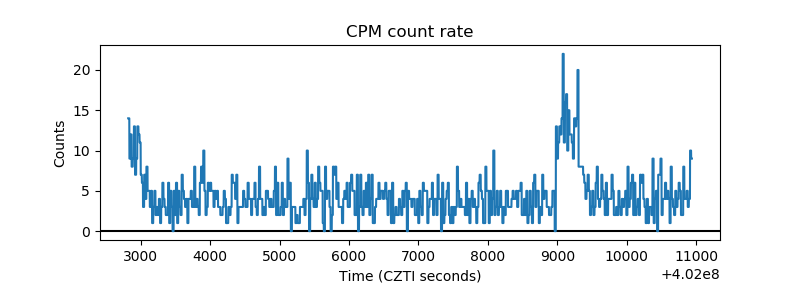 |
| CZT Counter | 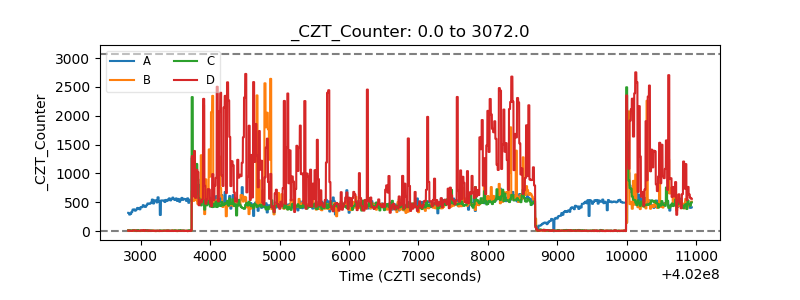 |
| +2.5 Volts monitor | 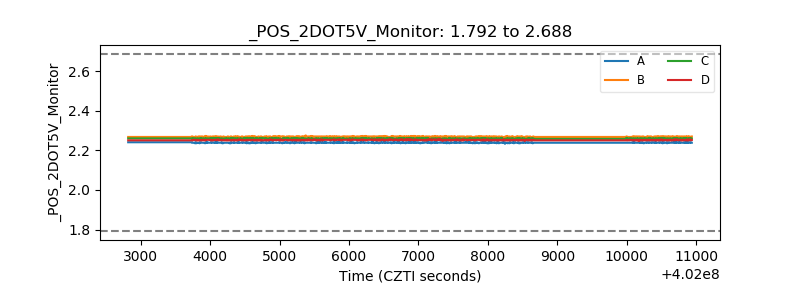 |
| +5 Volts monitor | 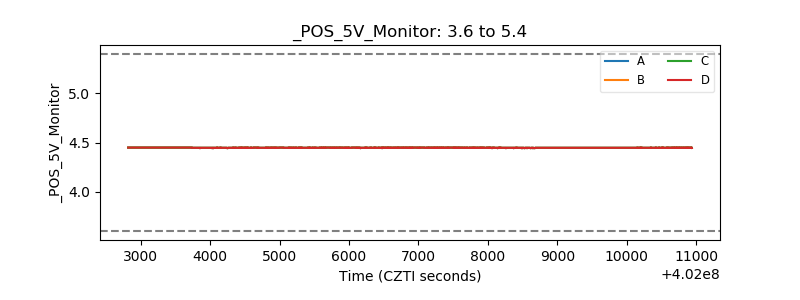 |
| _ROLL_ROT | 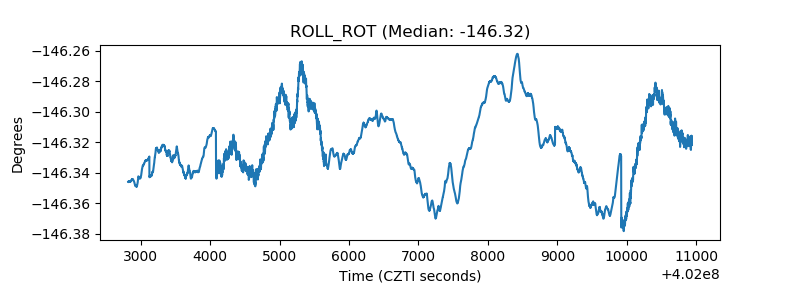 |
| _Roll_DEC | 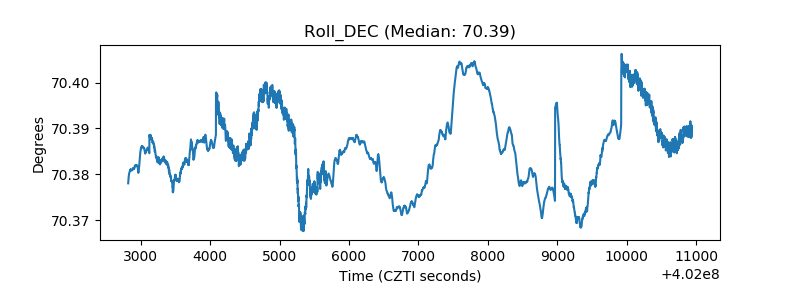 |
| _Roll_RA | 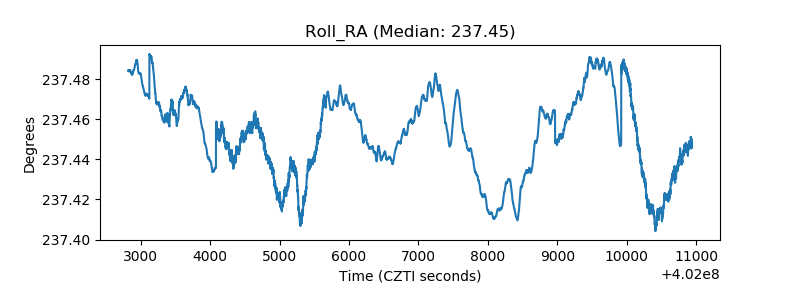 |
| Veto Counter | 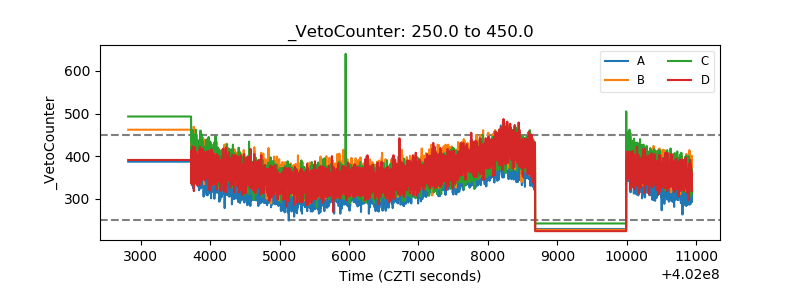 |