| Param | Original file | Final file |
|---|---|---|
| Filename | modeM0/AS1C07_001T12_9000005352_37847cztM0_level2.evt | modeM0/AS1C07_001T12_9000005352_37847cztM0_level2_quad_clean.evt |
| Size (bytes) | 960,022,080 | 138,395,520 |
| Size | 915.5 MB | 132.0 MB |
| Events in quadrant A | 5,356,546 | 897,358 |
| Events in quadrant B | 6,107,927 | 892,086 |
| Events in quadrant C | 5,208,862 | 889,626 |
| Events in quadrant D | 11,665,216 | 757,561 |
| Mode M9 | |||
|---|---|---|---|
| Quadrant | BADHDUFLAG | Total packets | Discarded packets |
| A | 0 | 41 | 0 |
| B | 0 | 41 | 0 |
| C | 0 | 41 | 0 |
| D | 0 | 41 | 0 |
| Mode M0 | |||
|---|---|---|---|
| Quadrant | BADHDUFLAG | Total packets | Discarded packets |
| A | 0 | 22935 | 4 |
| B | 0 | 25728 | 3 |
| C | 0 | 22461 | 3 |
| D | 0 | 42306 | 3 |
| Mode SS | |||
|---|---|---|---|
| Quadrant | BADHDUFLAG | Total packets | Discarded packets |
| A | 0 | 224 | 0 |
| B | 0 | 224 | 0 |
| C | 0 | 224 | 0 |
| D | 0 | 224 | 0 |
| Quadrant | Total seconds | Saturated seconds | Saturation percentage |
|---|---|---|---|
| A | 10888 | 22 | 0.202057% |
| B | 10888 | 295 | 2.709405% |
| C | 10888 | 36 | 0.330639% |
| D | 10888 | 2082 | 19.121969% |
Noise dominated data is calculated using 1-second bins in cleaned event files. If a bin has >2000 counts, and if more than 50% of those come from <1% of pixels, then it is considered to be noise-dominated and hence unusable.
| Quadrant | # 1 sec bins | Bins with >0 counts | Bins with >2000 counts | High rate bins dominated by noise | Noise dominated (total time) | Noise dominated (detector-on time) | Marked lightcurve |
|---|---|---|---|---|---|---|---|
| A | 15002 | 10891 | 9 | 9 | 0.06% | 0.08% | 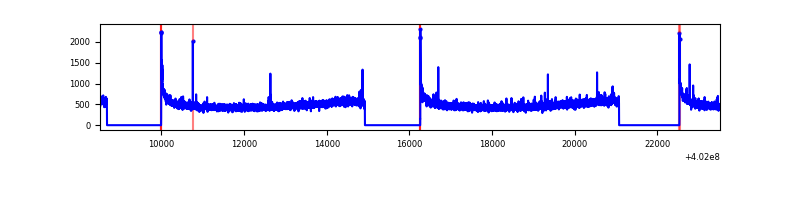 |
| B | 15002 | 10891 | 195 | 195 | 1.30% | 1.79% | 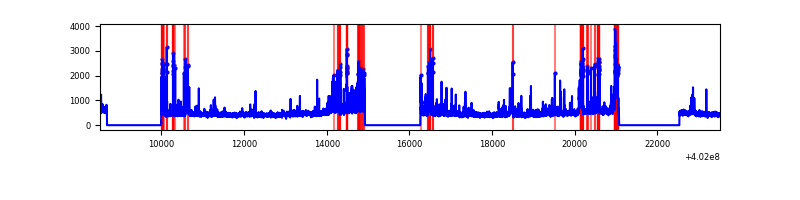 |
| C | 15002 | 10891 | 25 | 25 | 0.17% | 0.23% | 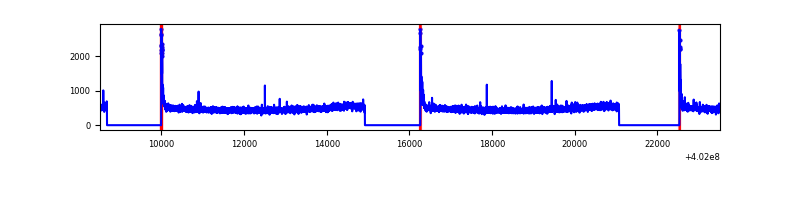 |
| D | 15002 | 10891 | 1783 | 1783 | 11.89% | 16.37% | 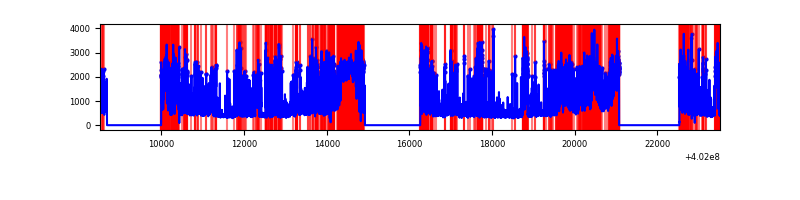 |
Top three noisy pixels from each quadrant. If the there are fewer than three noisy pixels in the level2.evt file, extra rows are filled as -1
| Pixel properties | Quadrant properties | ||||||
|---|---|---|---|---|---|---|---|
| Quadrant | DetID | PixID | Counts | Sigma | Mean | Median | Sigma |
| A | 10 | 83 | 629299 | 2621.47 | 1201 | 1181 | 239.6 |
| A | 9 | 143 | 21131 | 83.26 | 1201 | 1181 | 239.6 |
| A | 13 | 254 | 17296 | 67.26 | 1201 | 1181 | 239.6 |
| B | 5 | 172 | 980784 | 4334.72 | 1184 | 1154 | 226.0 |
| B | 4 | 171 | 86992 | 379.82 | 1184 | 1154 | 226.0 |
| B | 4 | 81 | 85969 | 375.29 | 1184 | 1154 | 226.0 |
| C | 15 | 214 | 456080 | 1674.81 | 1168 | 1173 | 271.6 |
| C | 0 | 10 | 160860 | 587.91 | 1168 | 1173 | 271.6 |
| C | 14 | 67 | 18507 | 63.82 | 1168 | 1173 | 271.6 |
| D | 1 | 52 | 3437264 | 13011.92 | 1081 | 1051 | 264.1 |
| D | 2 | 249 | 1790586 | 6776.44 | 1081 | 1051 | 264.1 |
| D | 13 | 249 | 1508892 | 5709.75 | 1081 | 1051 | 264.1 |
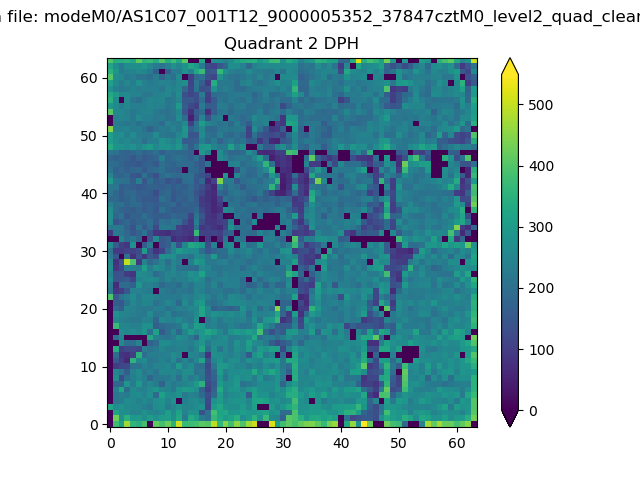
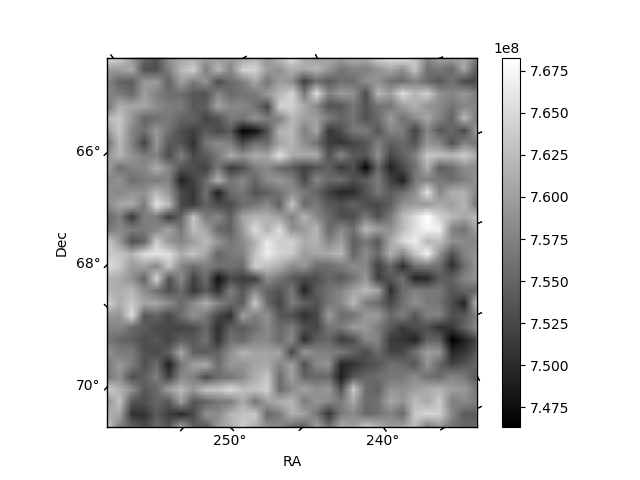
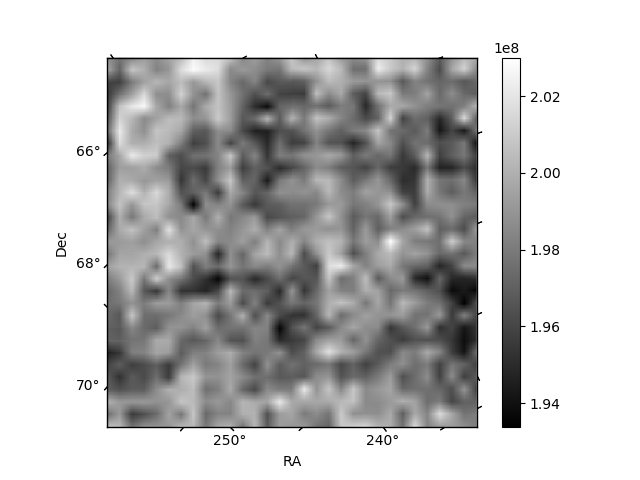
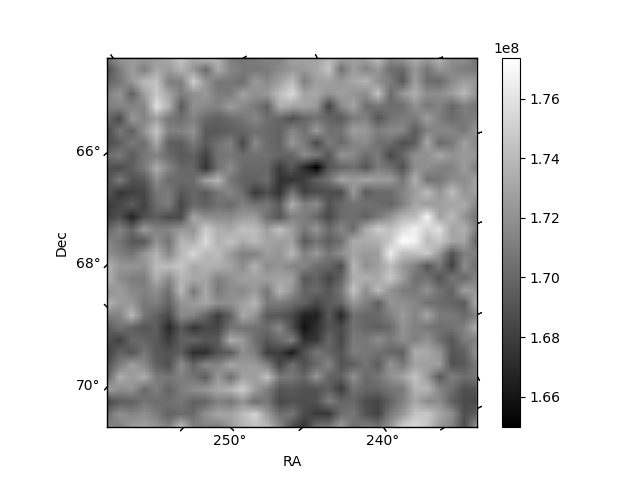
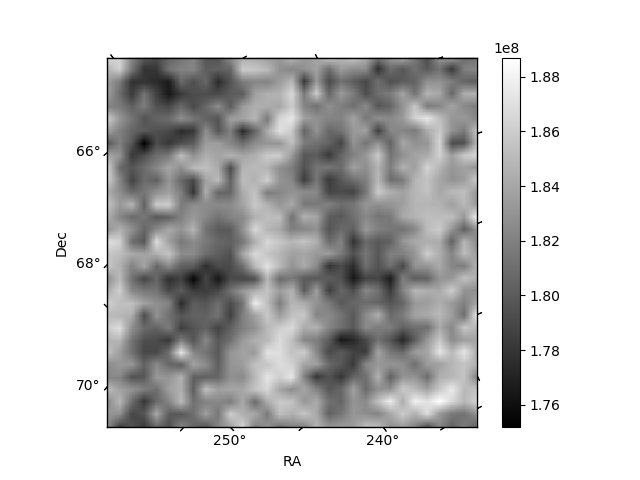
Histogram calculated using DETX and DETY for each event in the final _common_clean file
| Quadrant A | 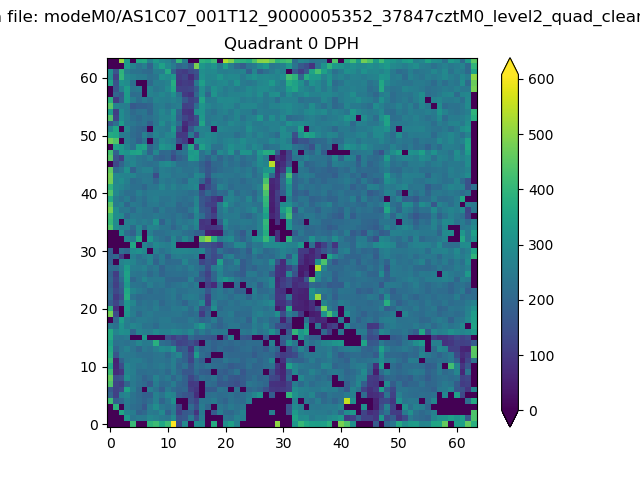 |
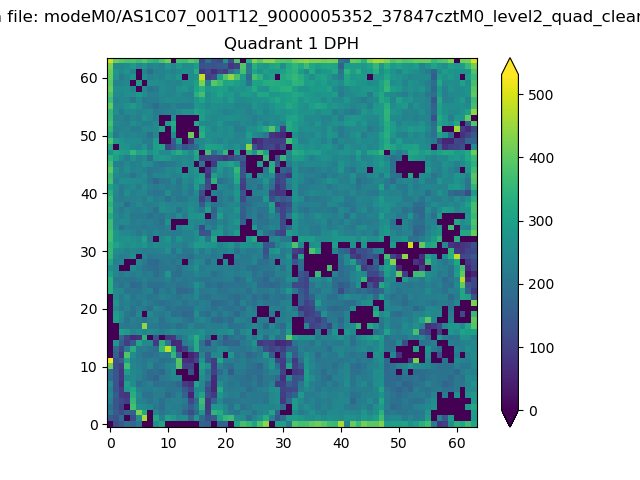 |
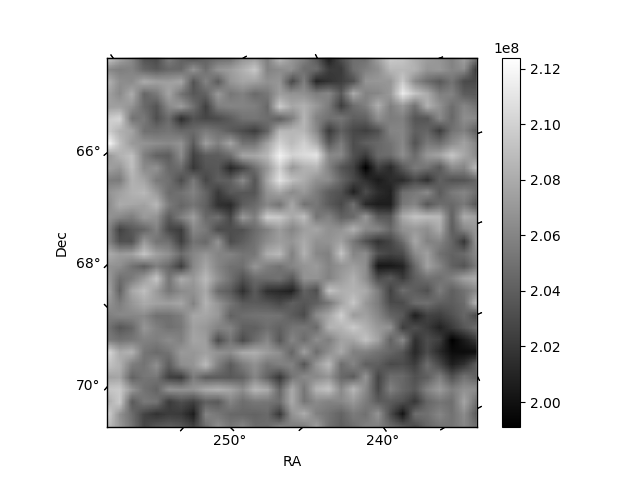
Quadrant B |
|---|---|---|---|
| Quadrant D | 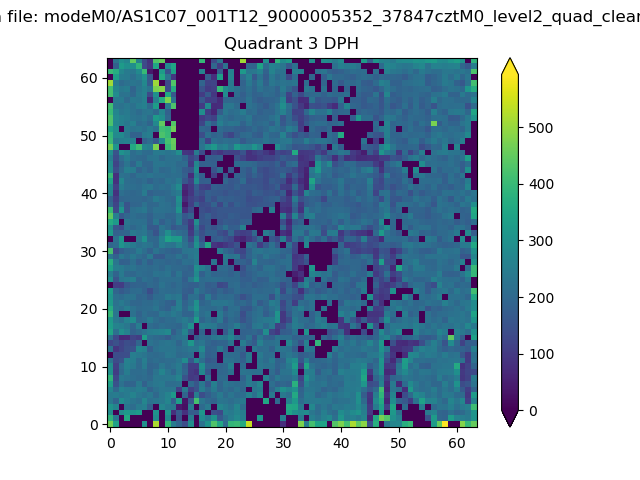 |
 |
Quadrant C |
| Plot type | Count rate plots | Images |
|---|---|---|
| Comparison with Poisson distribution Blue bars denote a histogram of data divided into 1 sec bins. Red curve is a Poisson curve with rate = median count rate of data. |
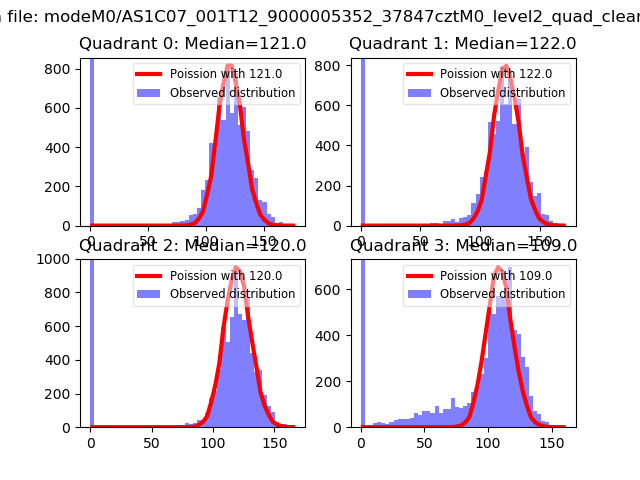 |
 |
| Quadrant-wise count rates Data is divided into 100 sec bins |
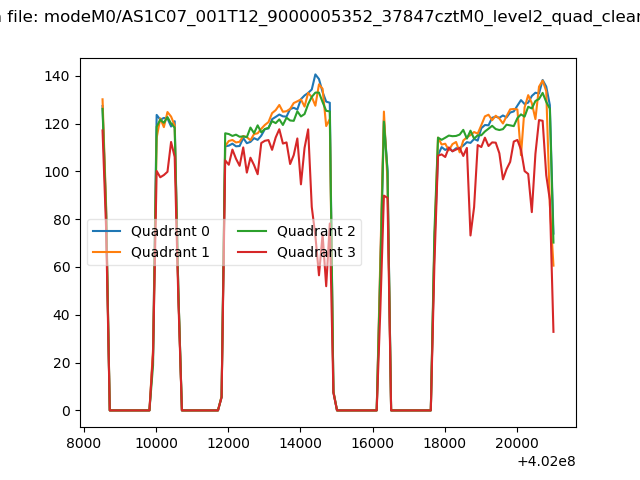 |
|
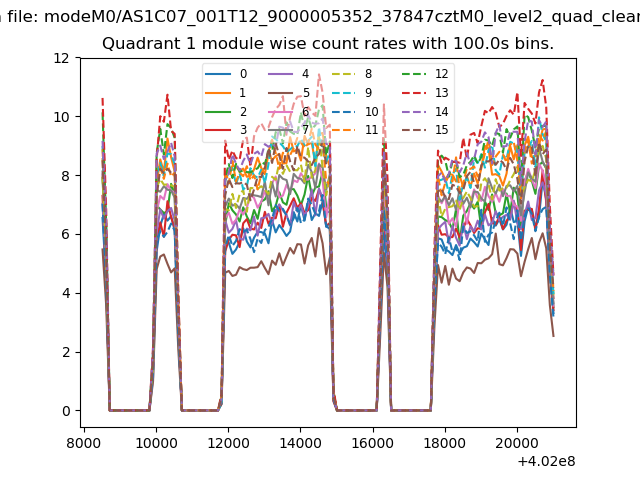
| Module-wise count rates for Quadrant A Data is divided into 100 sec bins |
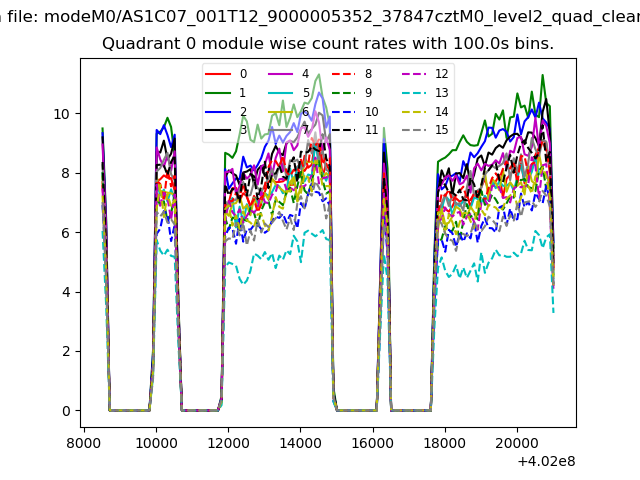 |
 |
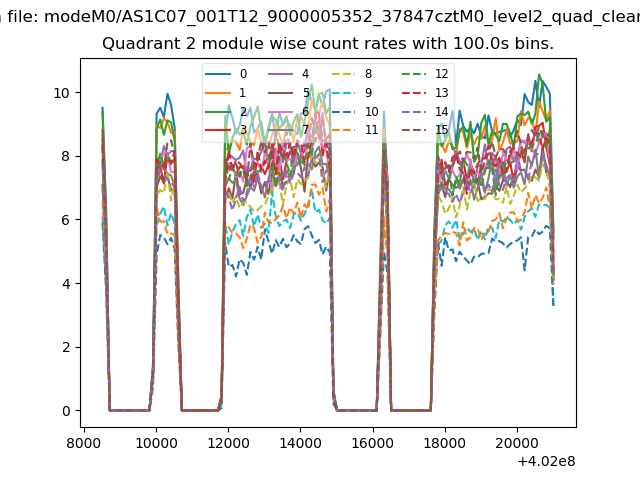
| Module-wise count rates for Quadrant B Data is divided into 100 sec bins |
 |
 |
| Module-wise count rates for Quadrant C Data is divided into 100 sec bins |
 |
 |
| Module-wise count rates for Quadrant D Data is divided into 100 sec bins |
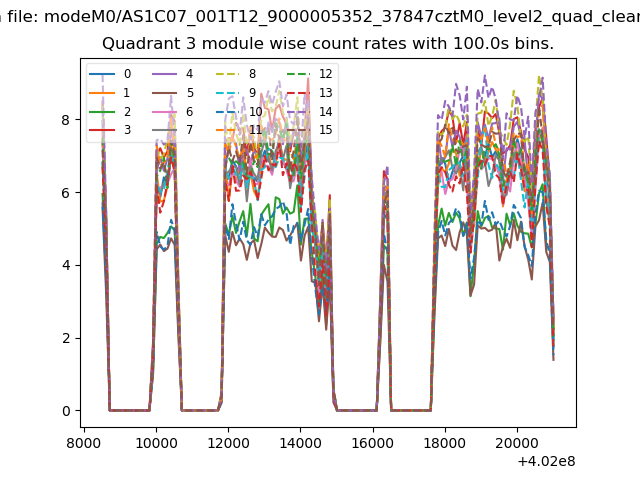 |
 |
| Parameter | Plot |
|---|---|
| CZT HV Monitor | 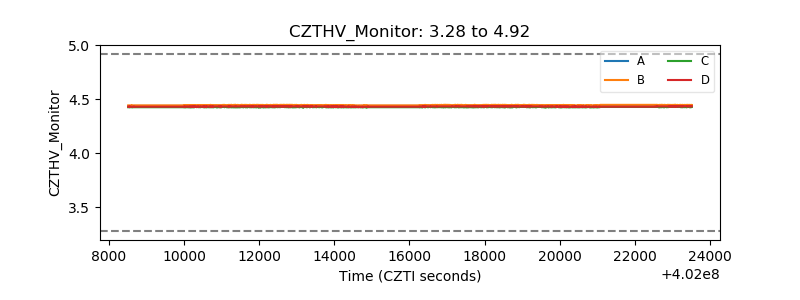 |
| D_VDD | 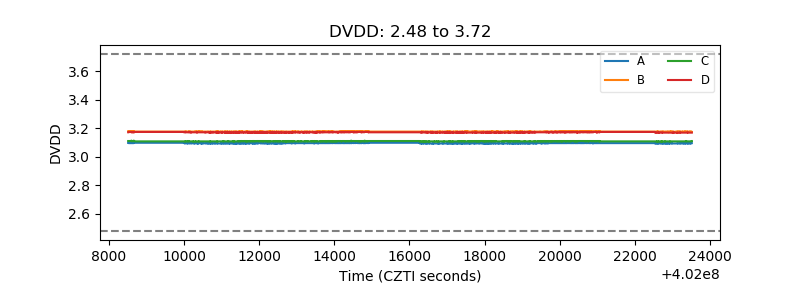 |
| Temperature 1 | 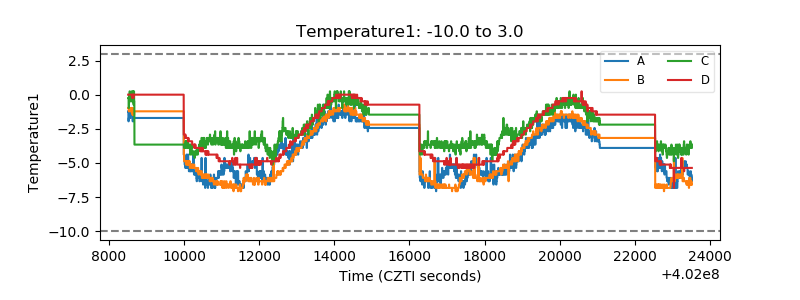 |
| Veto HV Monitor | 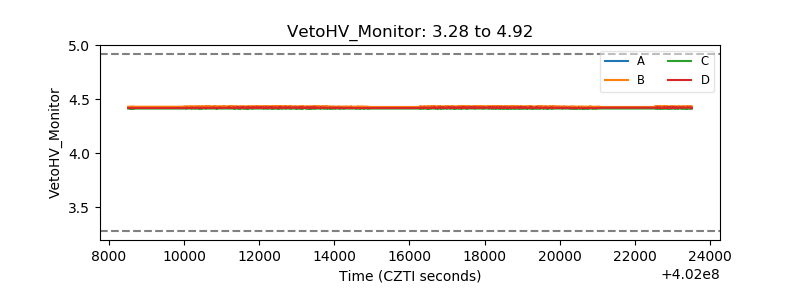 |
| Veto LLD | 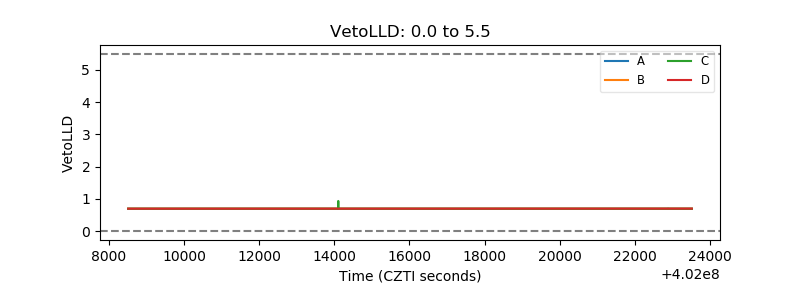 |
| Alpha Counter | 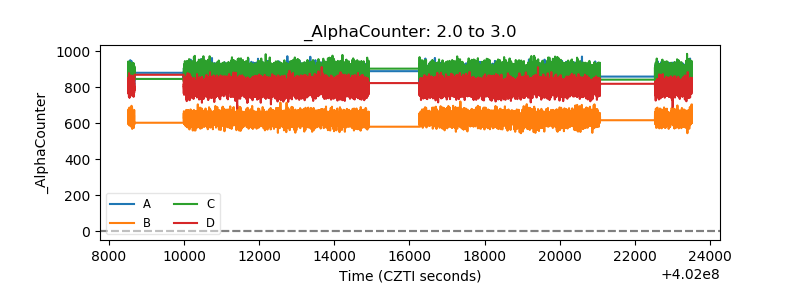 |
| _CPM_Rate | 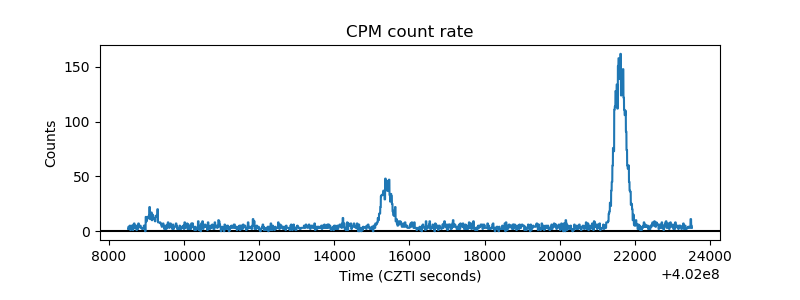 |
| CZT Counter | 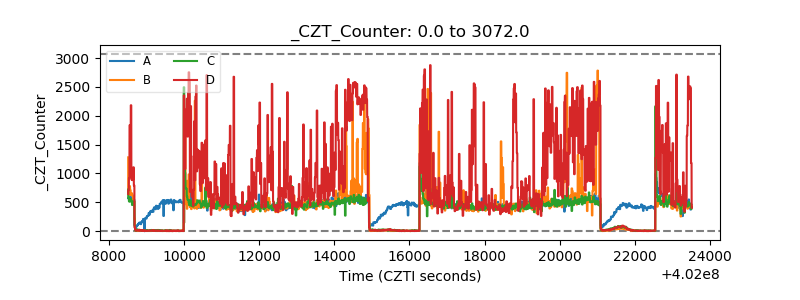 |
| +2.5 Volts monitor | 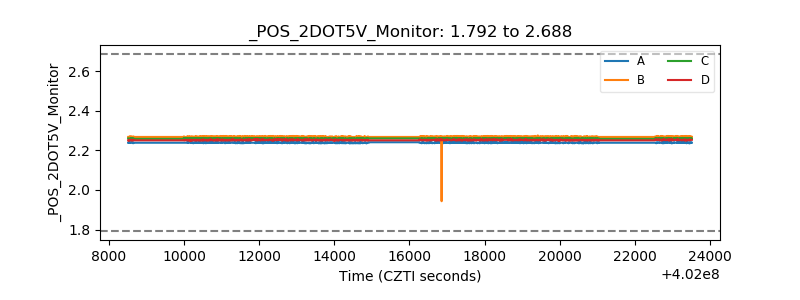 |
| +5 Volts monitor | 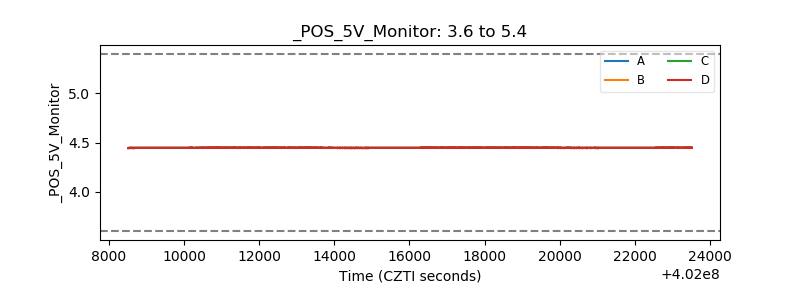 |
| _ROLL_ROT | 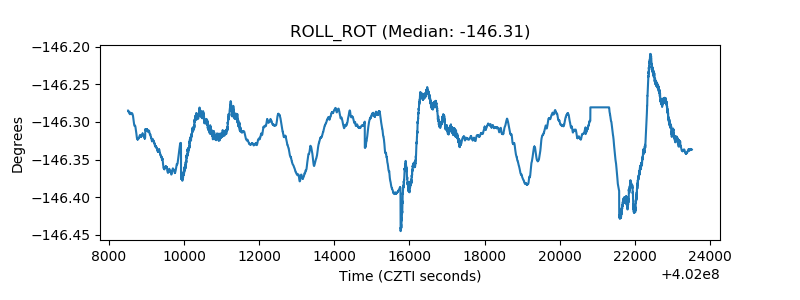 |
| _Roll_DEC | 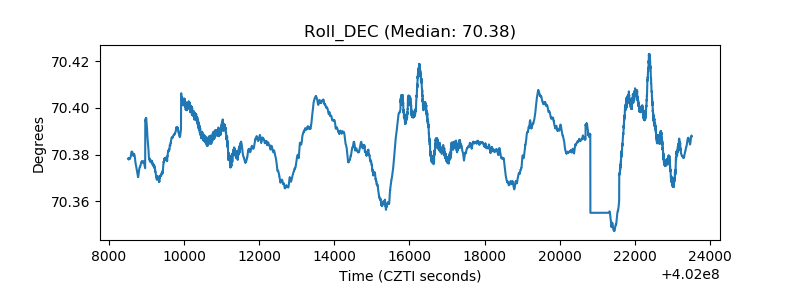 |
| _Roll_RA | 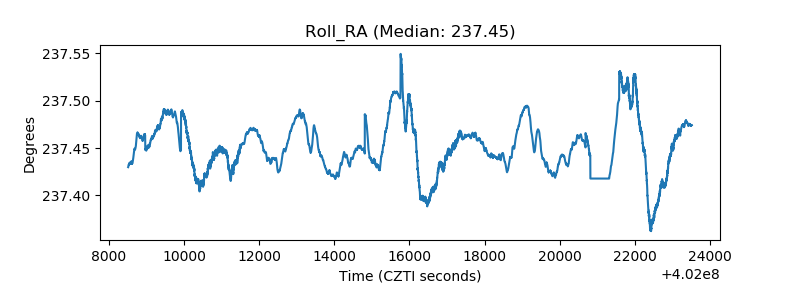 |
| Veto Counter | 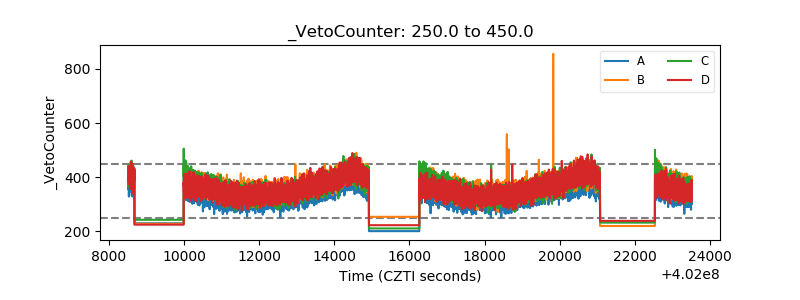 |