| Param | Original file | Final file |
|---|---|---|
| Filename | modeM0/AS1C07_001T12_9000005352_37848cztM0_level2.evt | modeM0/AS1C07_001T12_9000005352_37848cztM0_level2_quad_clean.evt |
| Size (bytes) | 544,337,280 | 66,790,080 |
| Size | 519.1 MB | 63.7 MB |
| Events in quadrant A | 2,940,461 | 442,067 |
| Events in quadrant B | 4,384,469 | 395,217 |
| Events in quadrant C | 2,883,992 | 428,975 |
| Events in quadrant D | 5,881,777 | 349,045 |
| Mode M9 | |||
|---|---|---|---|
| Quadrant | BADHDUFLAG | Total packets | Discarded packets |
| A | 0 | 30 | 0 |
| B | 0 | 30 | 0 |
| C | 0 | 30 | 0 |
| D | 0 | 30 | 0 |
| Mode M0 | |||
|---|---|---|---|
| Quadrant | BADHDUFLAG | Total packets | Discarded packets |
| A | 0 | 12370 | 3 |
| B | 0 | 16988 | 2 |
| C | 0 | 12293 | 2 |
| D | 0 | 21506 | 2 |
| Mode SS | |||
|---|---|---|---|
| Quadrant | BADHDUFLAG | Total packets | Discarded packets |
| A | 0 | 120 | 0 |
| B | 0 | 120 | 0 |
| C | 0 | 120 | 0 |
| D | 0 | 120 | 0 |
| Quadrant | Total seconds | Saturated seconds | Saturation percentage |
|---|---|---|---|
| A | 5820 | 9 | 0.154639% |
| B | 5820 | 645 | 11.082474% |
| C | 5820 | 26 | 0.446735% |
| D | 5820 | 971 | 16.683849% |
Noise dominated data is calculated using 1-second bins in cleaned event files. If a bin has >2000 counts, and if more than 50% of those come from <1% of pixels, then it is considered to be noise-dominated and hence unusable.
| Quadrant | # 1 sec bins | Bins with >0 counts | Bins with >2000 counts | High rate bins dominated by noise | Noise dominated (total time) | Noise dominated (detector-on time) | Marked lightcurve |
|---|---|---|---|---|---|---|---|
| A | 8834 | 5822 | 4 | 4 | 0.05% | 0.07% | 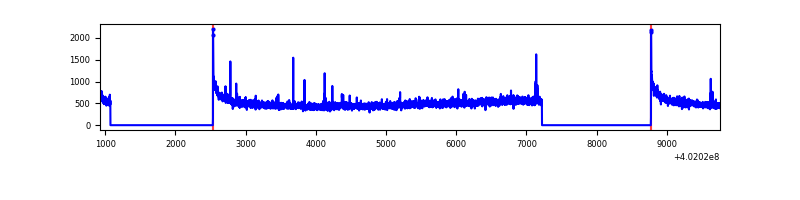 |
| B | 8834 | 5822 | 525 | 525 | 5.94% | 9.02% | 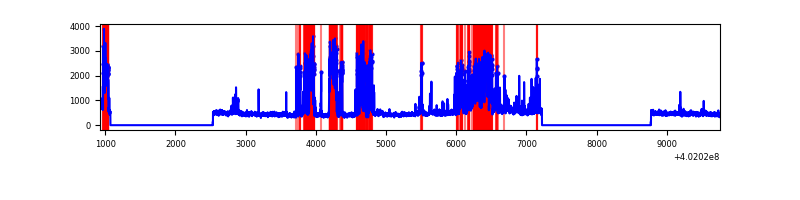 |
| C | 8834 | 5822 | 26 | 26 | 0.29% | 0.45% | 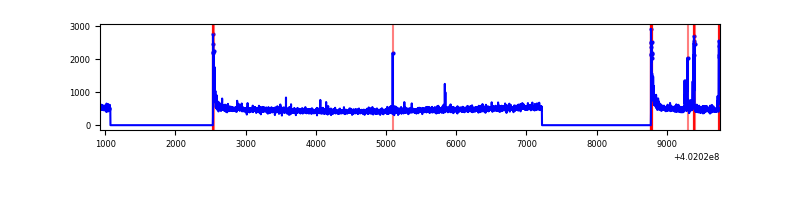 |
| D | 8834 | 5822 | 816 | 816 | 9.24% | 14.02% | 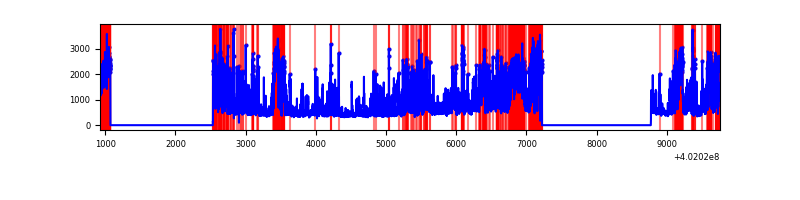 |
Top three noisy pixels from each quadrant. If the there are fewer than three noisy pixels in the level2.evt file, extra rows are filled as -1
| Pixel properties | Quadrant properties | ||||||
|---|---|---|---|---|---|---|---|
| Quadrant | DetID | PixID | Counts | Sigma | Mean | Median | Sigma |
| A | 10 | 83 | 364028 | 2804.96 | 642 | 628 | 129.6 |
| A | 15 | 222 | 51208 | 390.41 | 642 | 628 | 129.6 |
| A | 9 | 143 | 17398 | 129.44 | 642 | 628 | 129.6 |
| B | 5 | 172 | 1837205 | 15745.64 | 608 | 592 | 116.6 |
| B | 0 | 155 | 33446 | 281.66 | 608 | 592 | 116.6 |
| B | 0 | 230 | 22178 | 185.06 | 608 | 592 | 116.6 |
| C | 15 | 214 | 245501 | 1682.87 | 624 | 629 | 145.5 |
| C | 0 | 10 | 102971 | 703.34 | 624 | 629 | 145.5 |
| C | 1 | 23 | 73550 | 501.15 | 624 | 629 | 145.5 |
| D | 1 | 52 | 1568755 | 10965.26 | 582 | 564 | 143.0 |
| D | 2 | 249 | 976684 | 6825.32 | 582 | 564 | 143.0 |
| D | 13 | 249 | 632201 | 4416.59 | 582 | 564 | 143.0 |
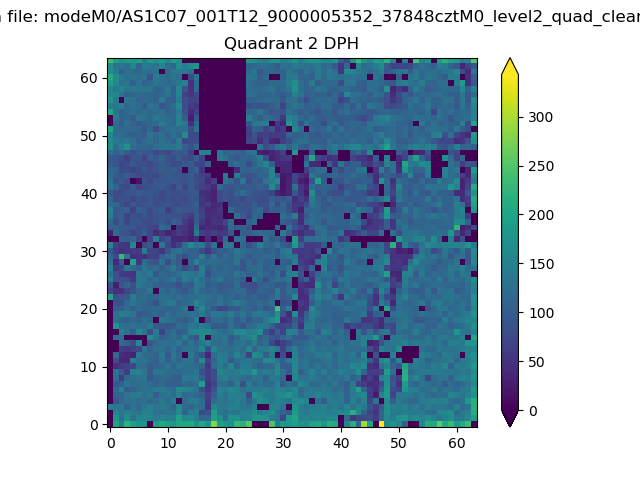
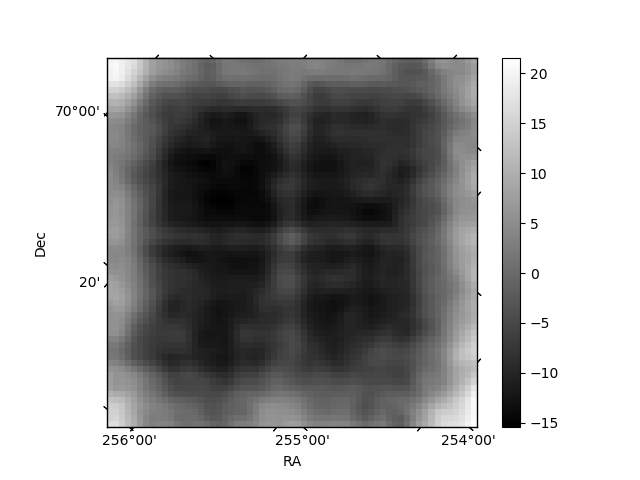
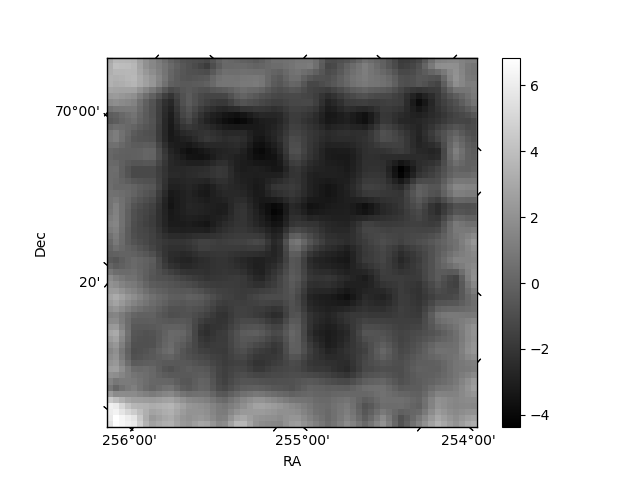
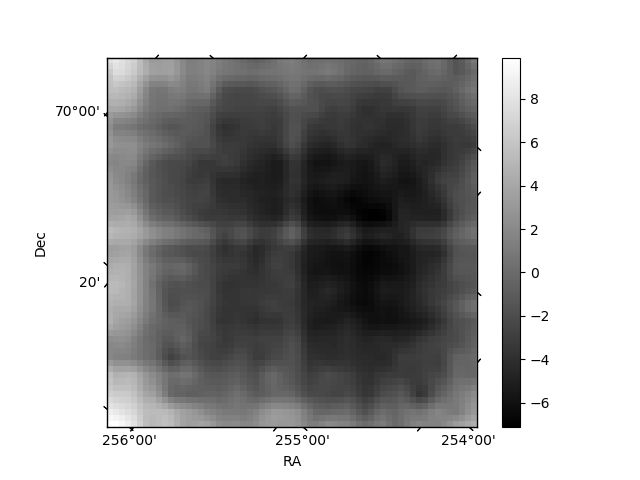
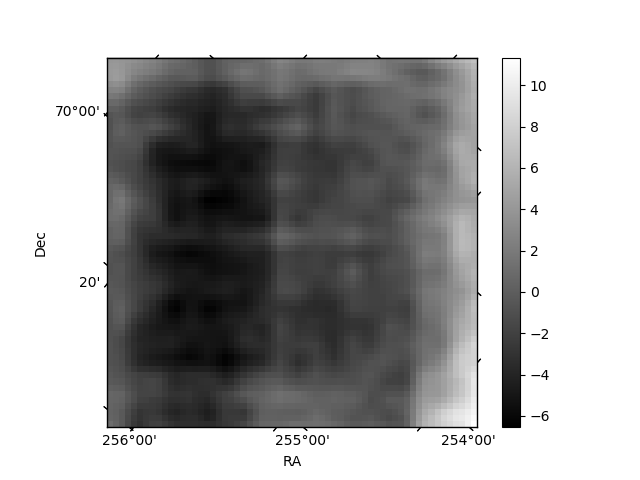
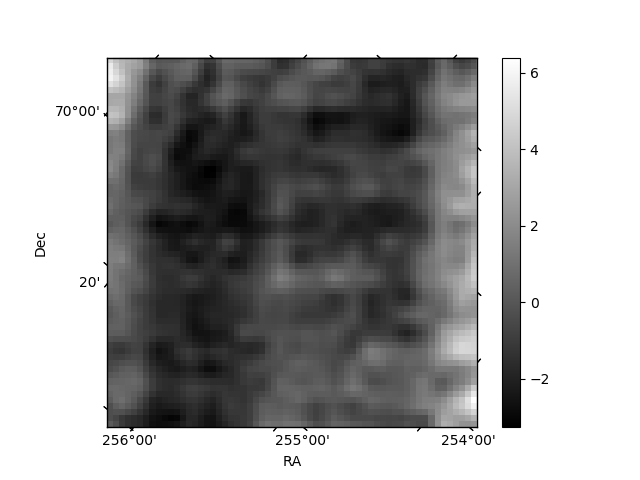
Histogram calculated using DETX and DETY for each event in the final _common_clean file
| Quadrant A | 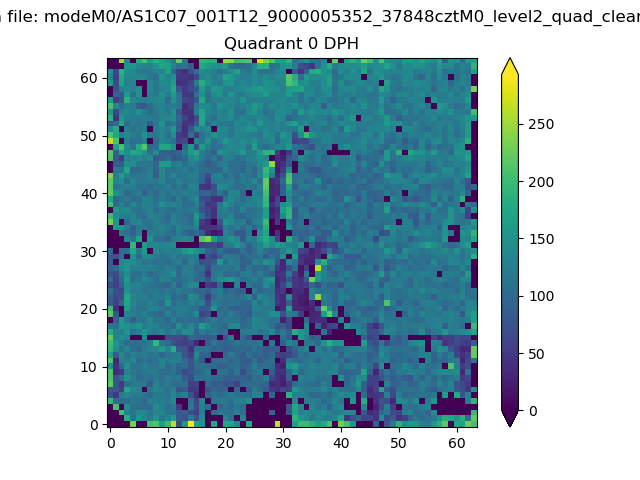 |
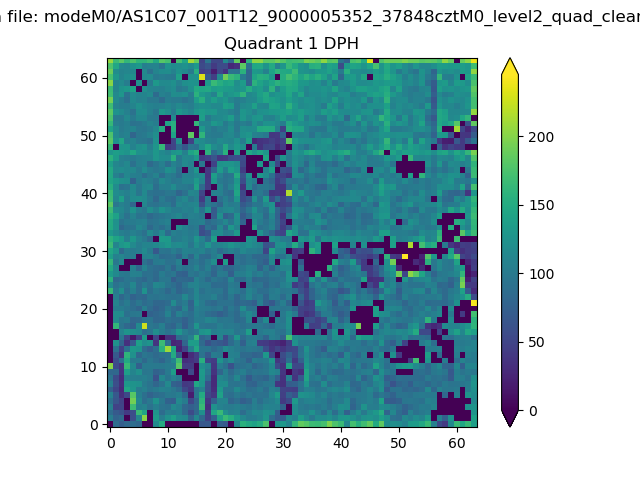 |
Quadrant B |
|---|---|---|---|
| Quadrant D | 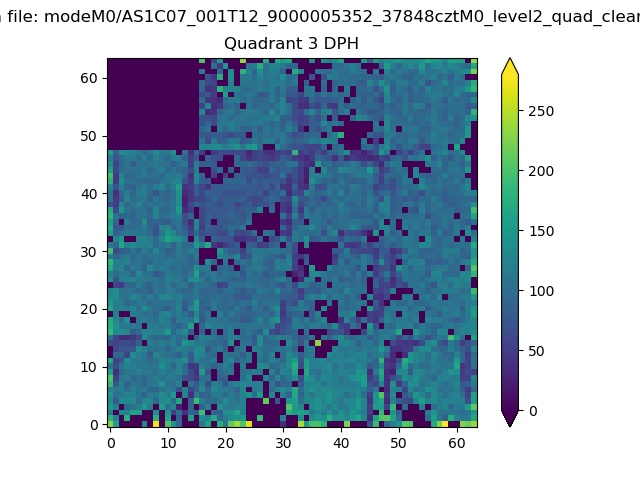 |
 |
Quadrant C |
| Plot type | Count rate plots | Images |
|---|---|---|
| Comparison with Poisson distribution Blue bars denote a histogram of data divided into 1 sec bins. Red curve is a Poisson curve with rate = median count rate of data. |
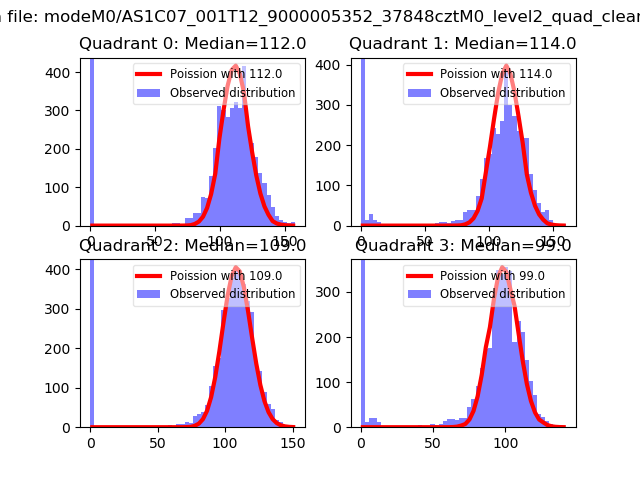 |
 |
| Quadrant-wise count rates Data is divided into 100 sec bins |
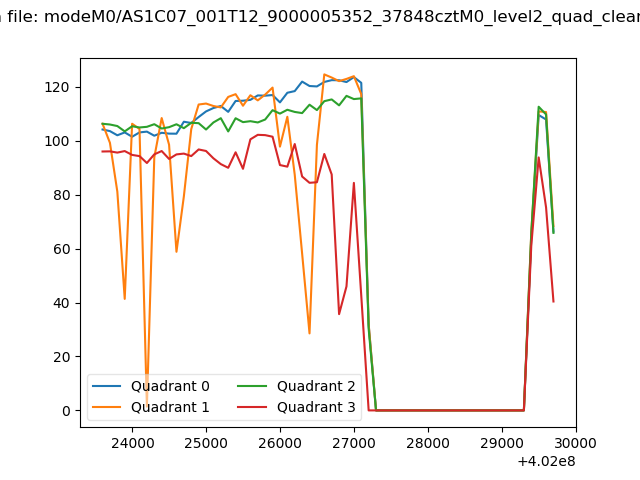 |
|
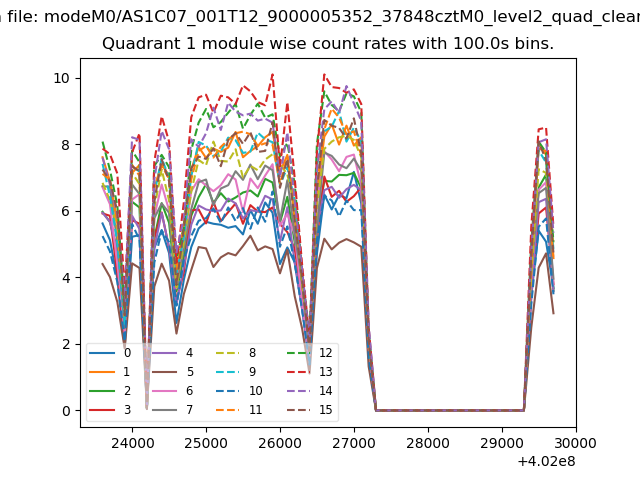
| Module-wise count rates for Quadrant A Data is divided into 100 sec bins |
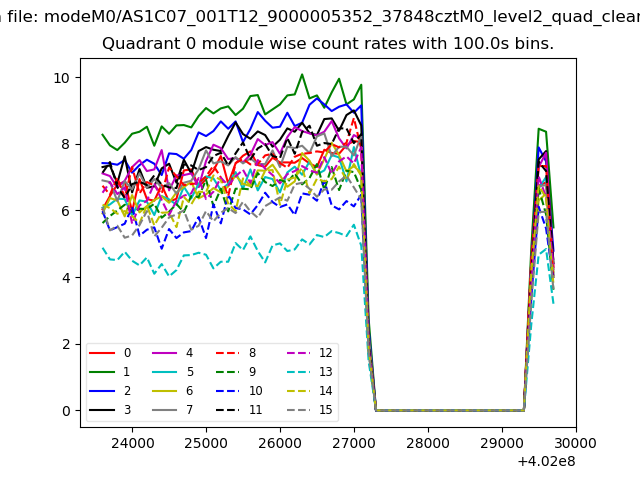 |
 |
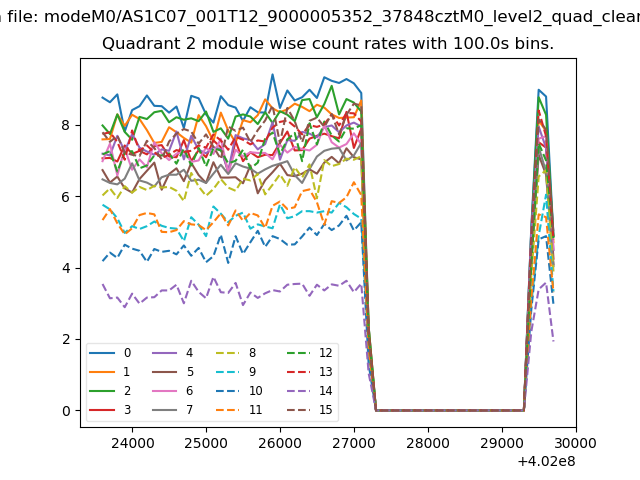
| Module-wise count rates for Quadrant B Data is divided into 100 sec bins |
 |
 |
| Module-wise count rates for Quadrant C Data is divided into 100 sec bins |
 |
 |
| Module-wise count rates for Quadrant D Data is divided into 100 sec bins |
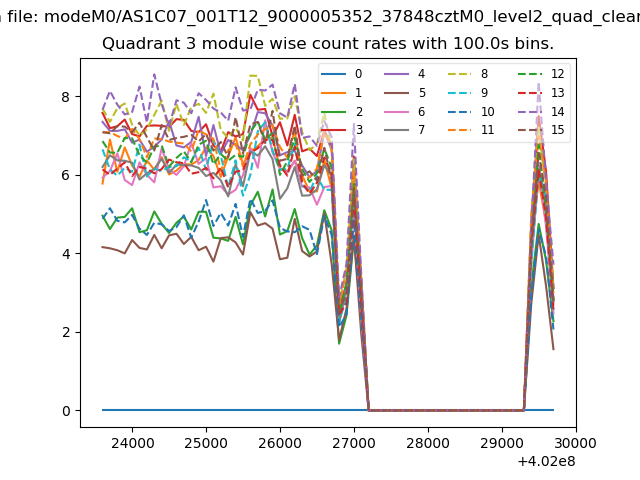 |
 |
| Parameter | Plot |
|---|---|
| CZT HV Monitor | 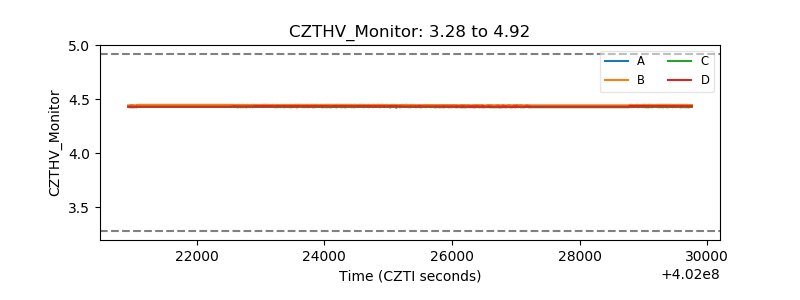 |
| D_VDD | 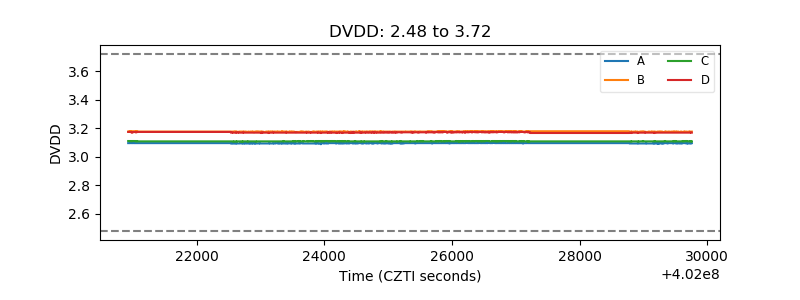 |
| Temperature 1 | 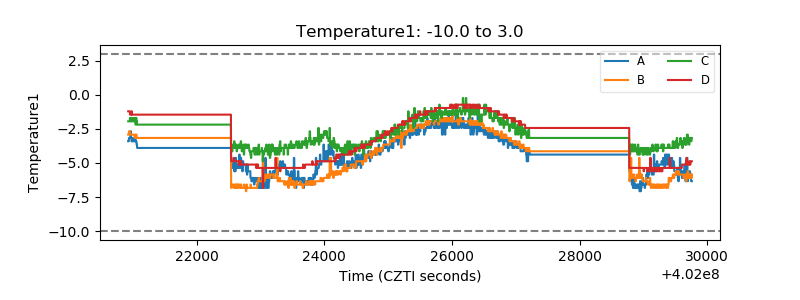 |
| Veto HV Monitor | 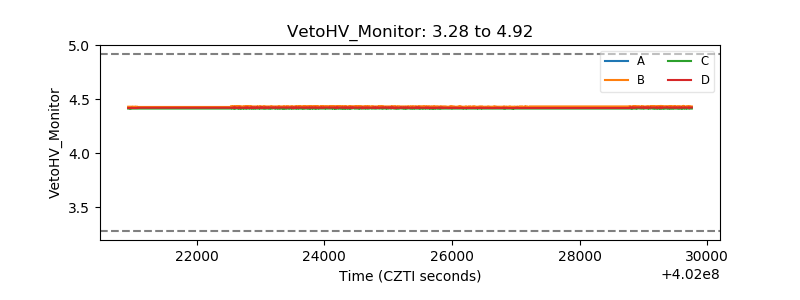 |
| Veto LLD | 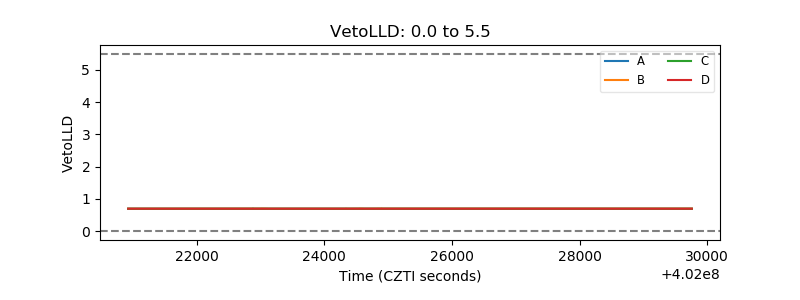 |
| Alpha Counter | 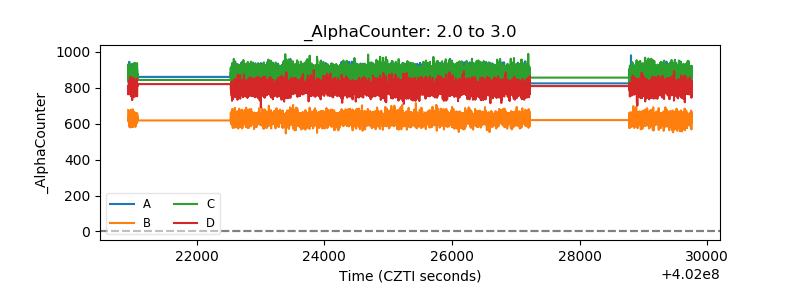 |
| _CPM_Rate | 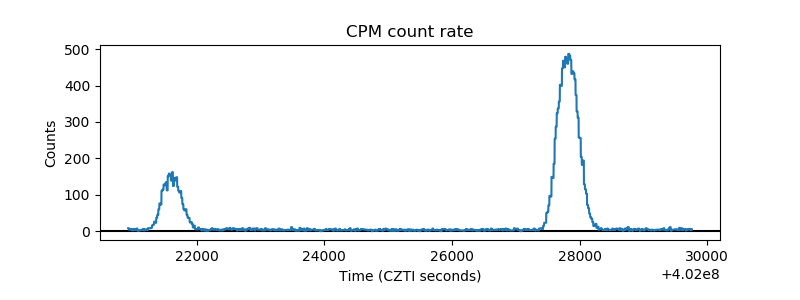 |
| CZT Counter | 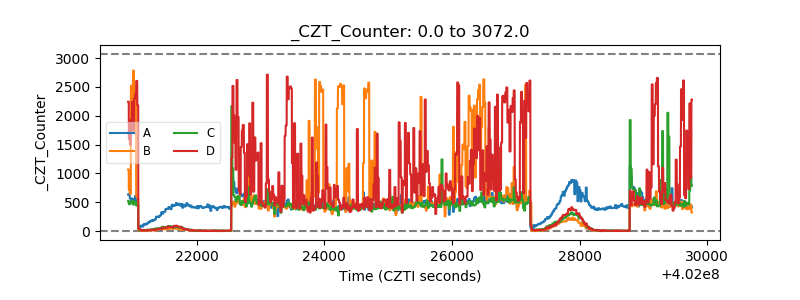 |
| +2.5 Volts monitor | 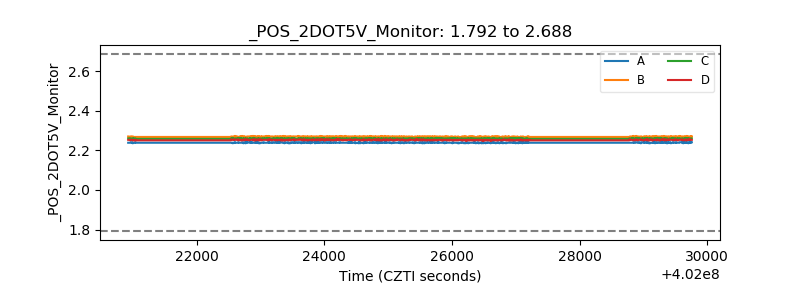 |
| +5 Volts monitor | 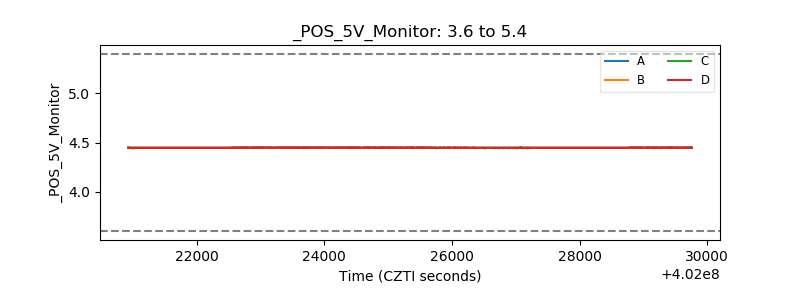 |
| _ROLL_ROT | 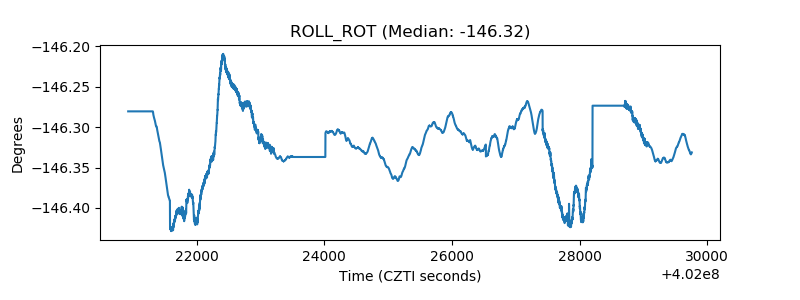 |
| _Roll_DEC | 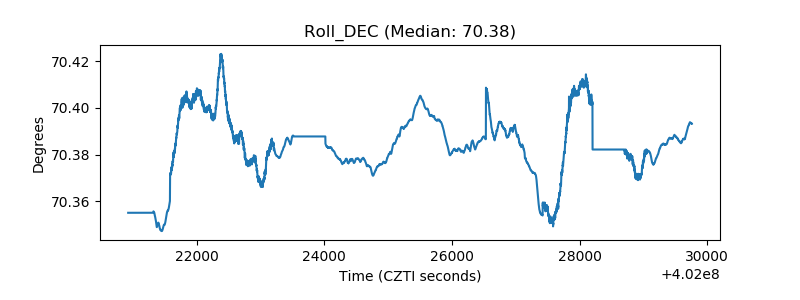 |
| _Roll_RA |  |
| Veto Counter | 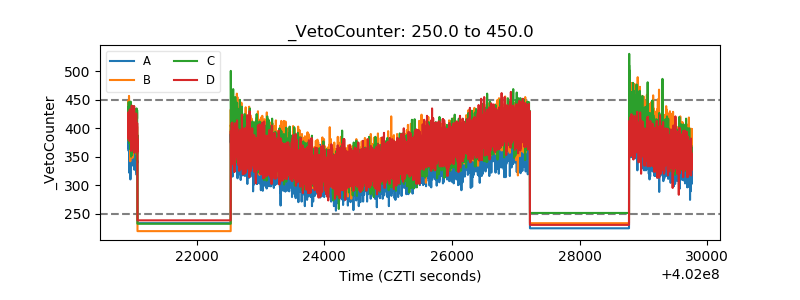 |