| Param | Original file | Final file |
|---|---|---|
| Filename | modeM0/AS1C07_001T12_9000005352_37851cztM0_level2.evt | modeM0/AS1C07_001T12_9000005352_37851cztM0_level2_quad_clean.evt |
| Size (bytes) | 411,534,720 | 96,356,160 |
| Size | 392.5 MB | 91.9 MB |
| Events in quadrant A | 2,667,037 | 652,197 |
| Events in quadrant B | 2,664,213 | 662,180 |
| Events in quadrant C | 2,545,144 | 640,970 |
| Events in quadrant D | 4,232,532 | 597,382 |
| Mode M9 | |||
|---|---|---|---|
| Quadrant | BADHDUFLAG | Total packets | Discarded packets |
| A | 0 | 17 | 0 |
| B | 0 | 17 | 0 |
| C | 0 | 17 | 0 |
| D | 0 | 17 | 0 |
| Mode M0 | |||
|---|---|---|---|
| Quadrant | BADHDUFLAG | Total packets | Discarded packets |
| A | 0 | 11063 | 2 |
| B | 0 | 11316 | 1 |
| C | 0 | 10808 | 1 |
| D | 0 | 16132 | 1 |
| Mode SS | |||
|---|---|---|---|
| Quadrant | BADHDUFLAG | Total packets | Discarded packets |
| A | 0 | 108 | 0 |
| B | 0 | 108 | 0 |
| C | 0 | 108 | 0 |
| D | 0 | 108 | 0 |
| Quadrant | Total seconds | Saturated seconds | Saturation percentage |
|---|---|---|---|
| A | 5209 | 15 | 0.287963% |
| B | 5209 | 56 | 1.075062% |
| C | 5209 | 27 | 0.518334% |
| D | 5209 | 282 | 5.413707% |
Noise dominated data is calculated using 1-second bins in cleaned event files. If a bin has >2000 counts, and if more than 50% of those come from <1% of pixels, then it is considered to be noise-dominated and hence unusable.
| Quadrant | # 1 sec bins | Bins with >0 counts | Bins with >2000 counts | High rate bins dominated by noise | Noise dominated (total time) | Noise dominated (detector-on time) | Marked lightcurve |
|---|---|---|---|---|---|---|---|
| A | 7002 | 5210 | 10 | 10 | 0.14% | 0.19% | 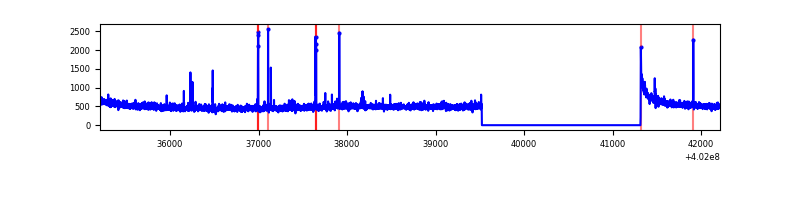 |
| B | 7002 | 5210 | 44 | 44 | 0.63% | 0.84% | 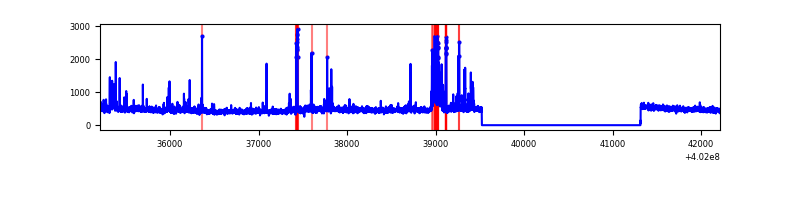 |
| C | 7002 | 5210 | 23 | 23 | 0.33% | 0.44% | 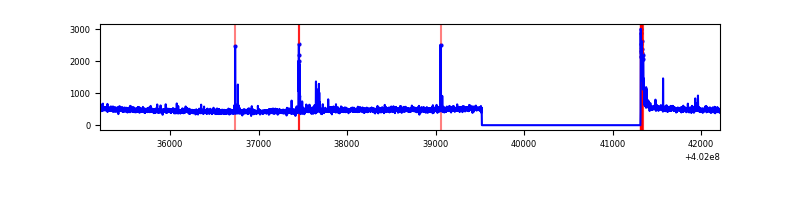 |
| D | 7002 | 5210 | 259 | 259 | 3.70% | 4.97% | 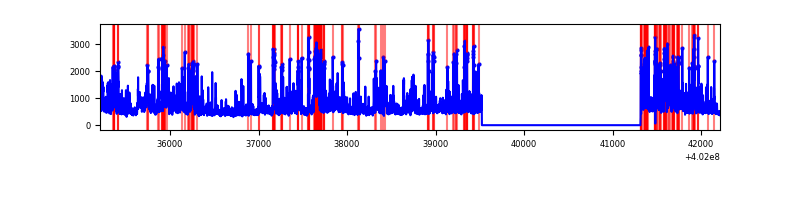 |
Top three noisy pixels from each quadrant. If the there are fewer than three noisy pixels in the level2.evt file, extra rows are filled as -1
| Pixel properties | Quadrant properties | ||||||
|---|---|---|---|---|---|---|---|
| Quadrant | DetID | PixID | Counts | Sigma | Mean | Median | Sigma |
| A | 10 | 83 | 287151 | 2416.71 | 591 | 580 | 118.6 |
| A | 9 | 143 | 49704 | 414.27 | 591 | 580 | 118.6 |
| A | 15 | 222 | 26442 | 218.1 | 591 | 580 | 118.6 |
| B | 5 | 172 | 277102 | 2509.87 | 581 | 566 | 110.2 |
| B | 0 | 230 | 31263 | 278.61 | 581 | 566 | 110.2 |
| B | 0 | 219 | 18415 | 162.0 | 581 | 566 | 110.2 |
| C | 15 | 214 | 217285 | 1654.89 | 563 | 567 | 131.0 |
| C | 0 | 10 | 79244 | 600.79 | 563 | 567 | 131.0 |
| C | 1 | 23 | 44918 | 338.67 | 563 | 567 | 131.0 |
| D | 2 | 249 | 836017 | 6146.58 | 558 | 542 | 135.9 |
| D | 1 | 52 | 622425 | 4575.19 | 558 | 542 | 135.9 |
| D | 2 | 250 | 168097 | 1232.7 | 558 | 542 | 135.9 |
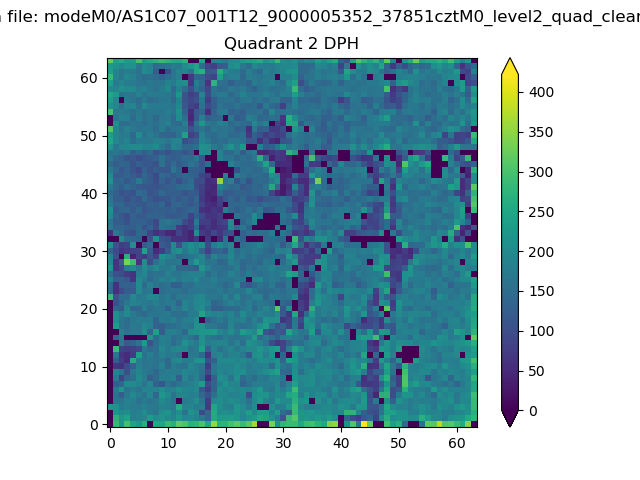
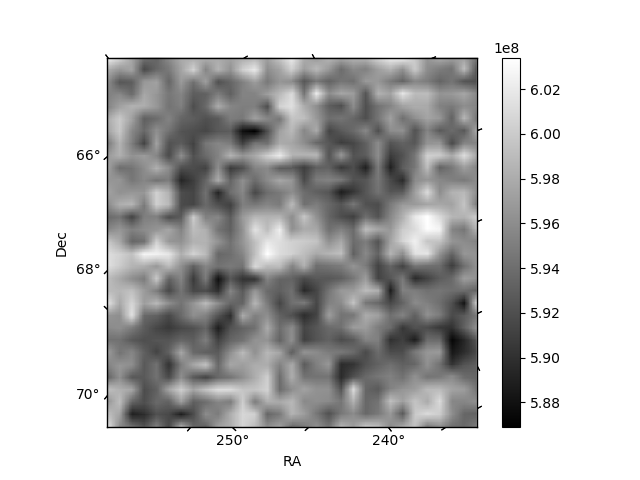
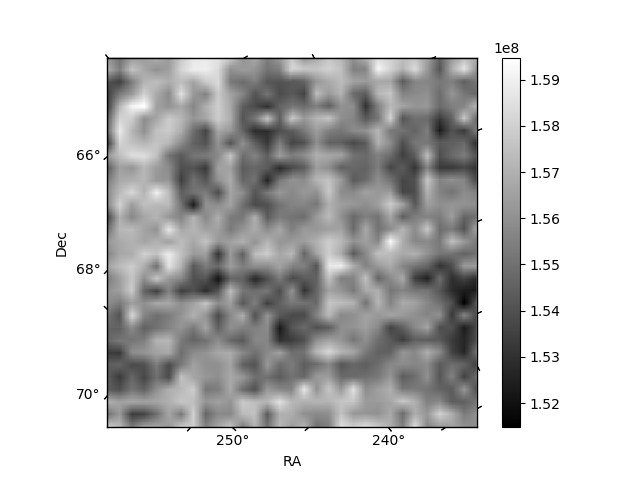
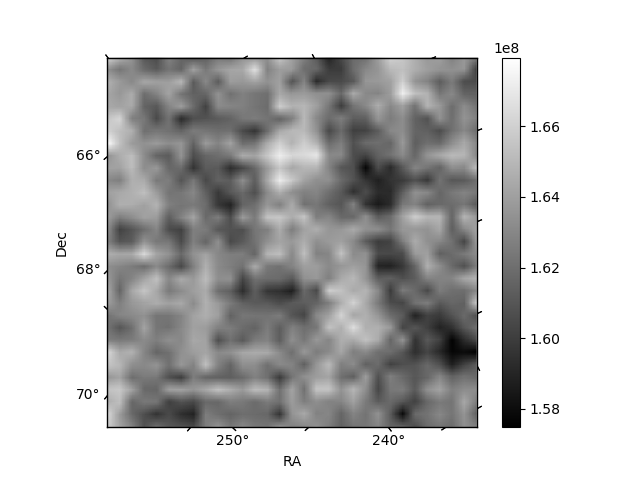
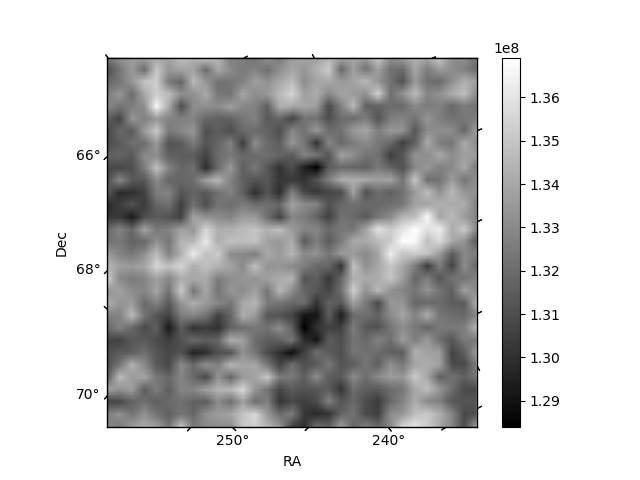
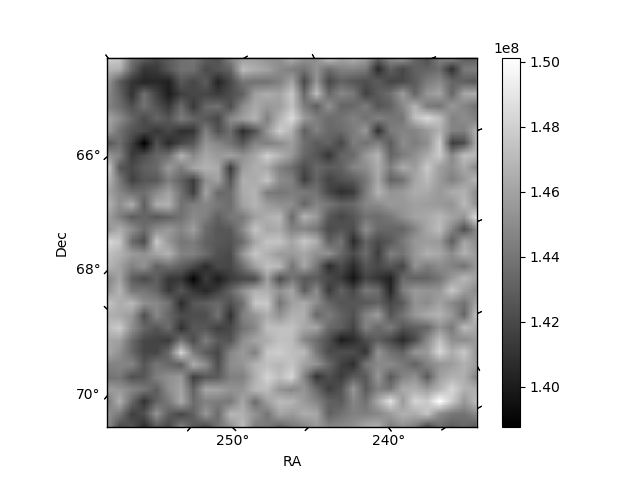
Histogram calculated using DETX and DETY for each event in the final _common_clean file
| Quadrant A | 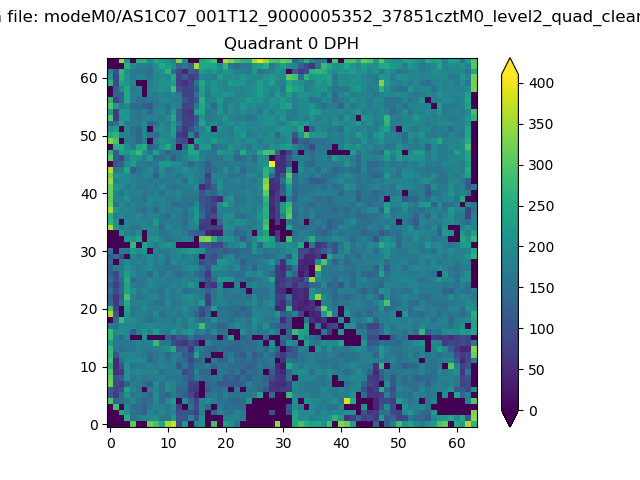 |
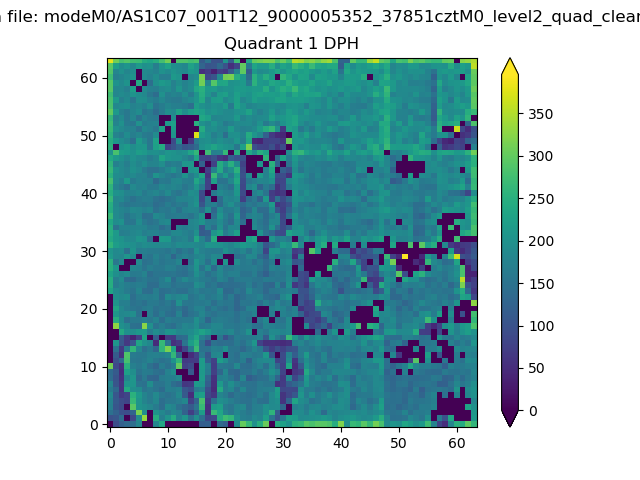 |
Quadrant B |
|---|---|---|---|
| Quadrant D | 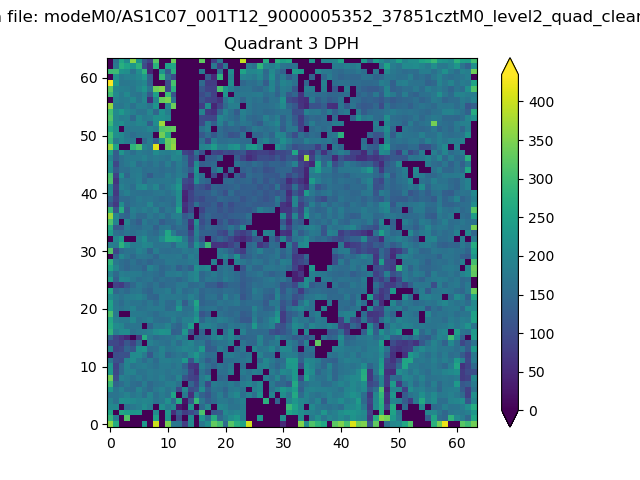 |
 |
Quadrant C |
| Plot type | Count rate plots | Images |
|---|---|---|
| Comparison with Poisson distribution Blue bars denote a histogram of data divided into 1 sec bins. Red curve is a Poisson curve with rate = median count rate of data. |
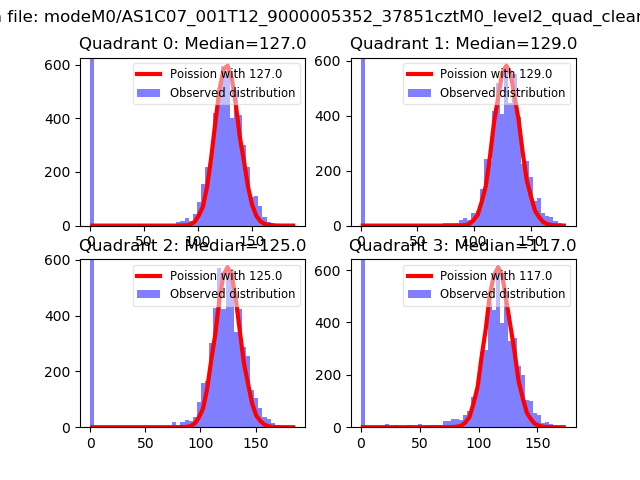 |
 |
| Quadrant-wise count rates Data is divided into 100 sec bins |
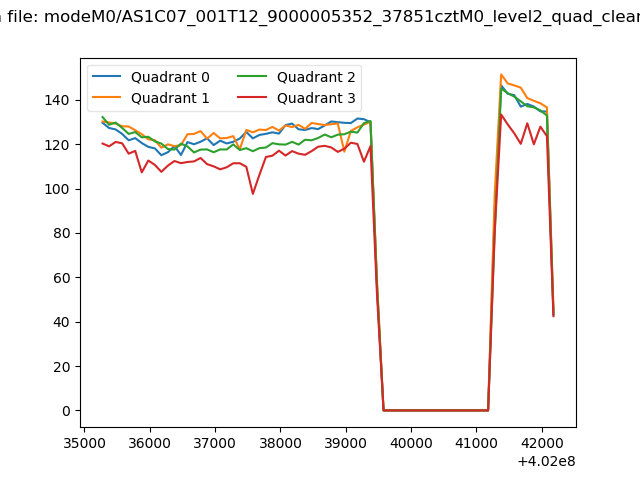 |
|
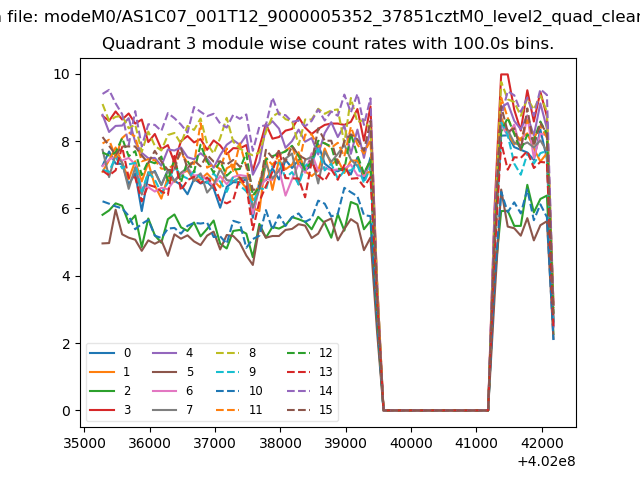
| Module-wise count rates for Quadrant A Data is divided into 100 sec bins |
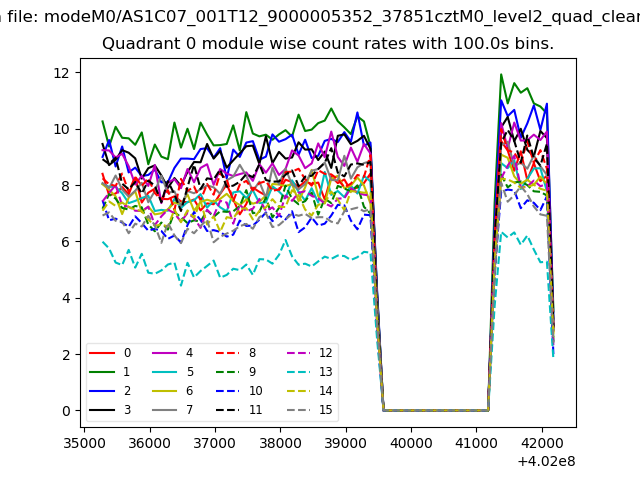 |
 |
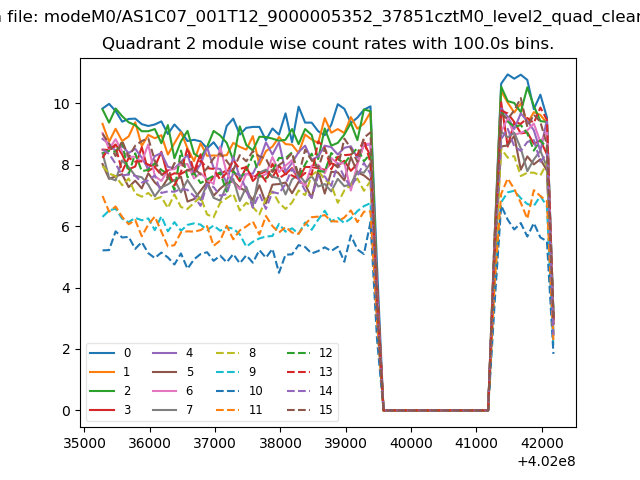
| Module-wise count rates for Quadrant B Data is divided into 100 sec bins |
 |
 |
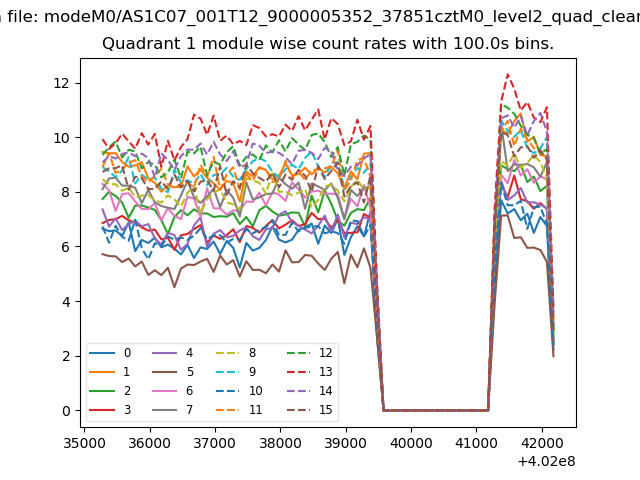
| Module-wise count rates for Quadrant C Data is divided into 100 sec bins |
 |
 |
| Module-wise count rates for Quadrant D Data is divided into 100 sec bins |
 |
 |
| Parameter | Plot |
|---|---|
| CZT HV Monitor | 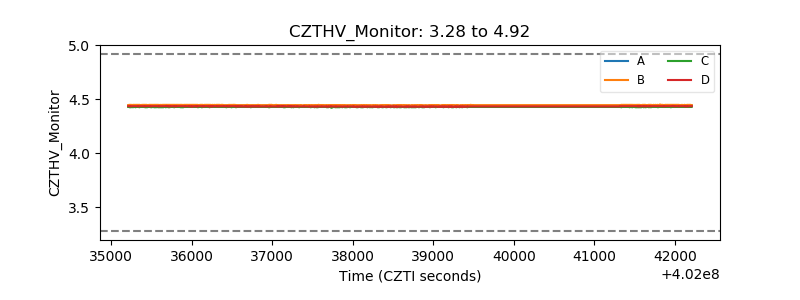 |
| D_VDD | 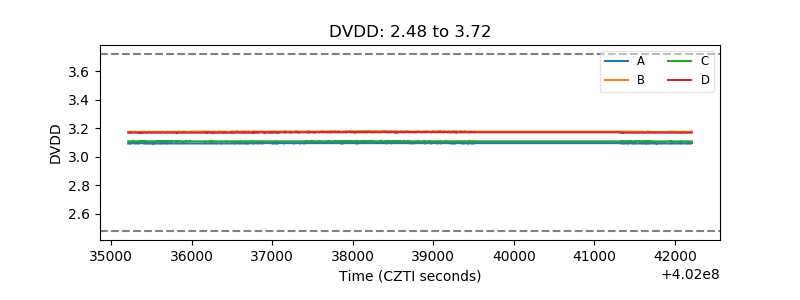 |
| Temperature 1 | 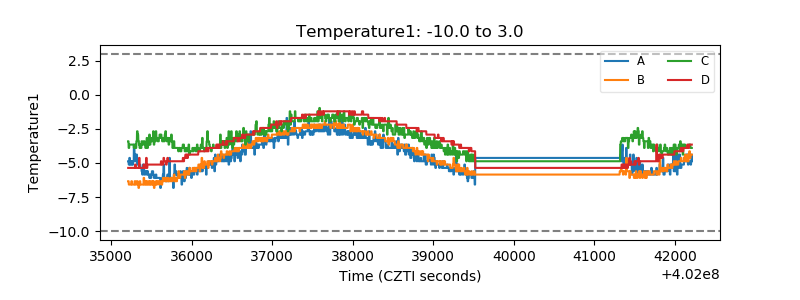 |
| Veto HV Monitor | 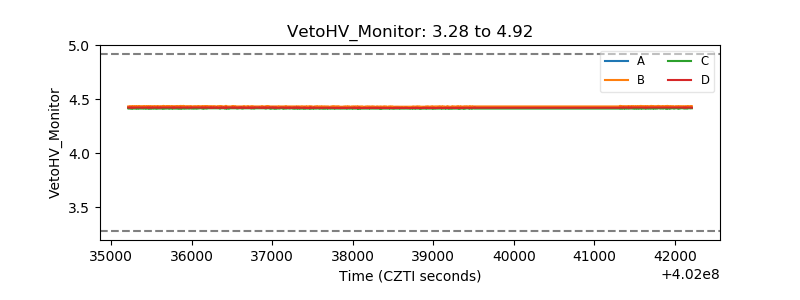 |
| Veto LLD | 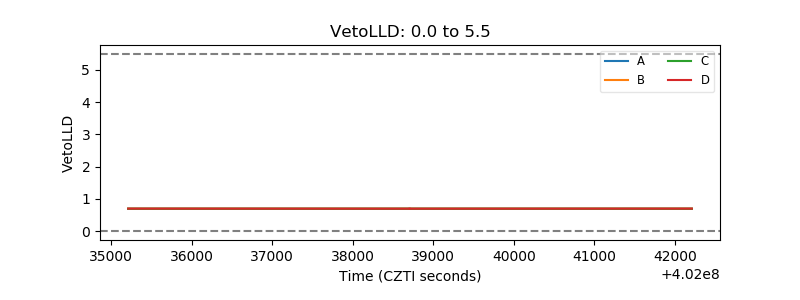 |
| Alpha Counter | 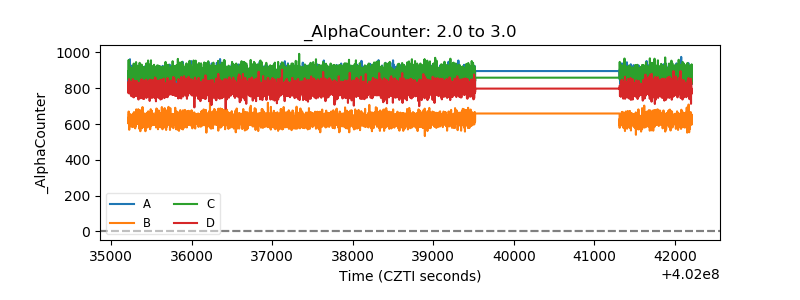 |
| _CPM_Rate | 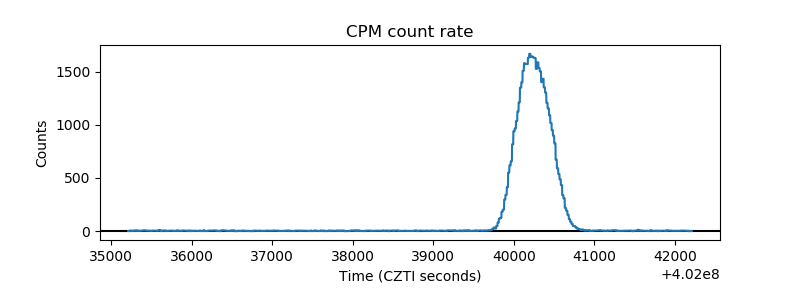 |
| CZT Counter | 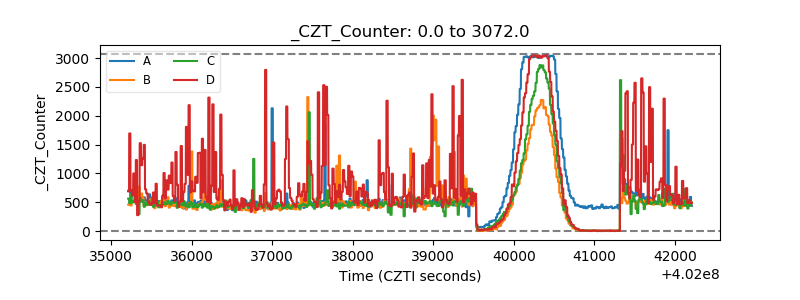 |
| +2.5 Volts monitor | 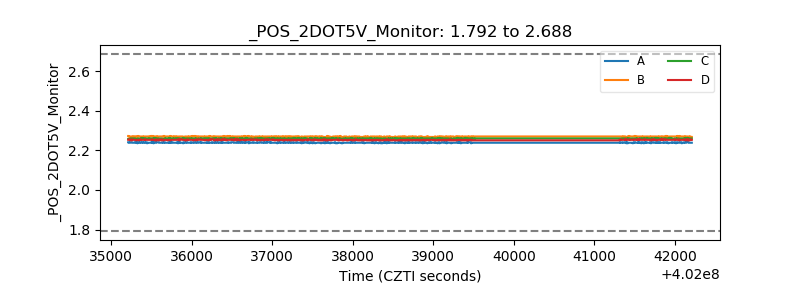 |
| +5 Volts monitor | 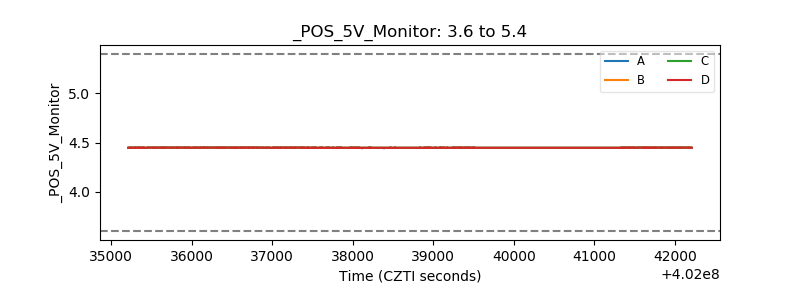 |
| _ROLL_ROT | 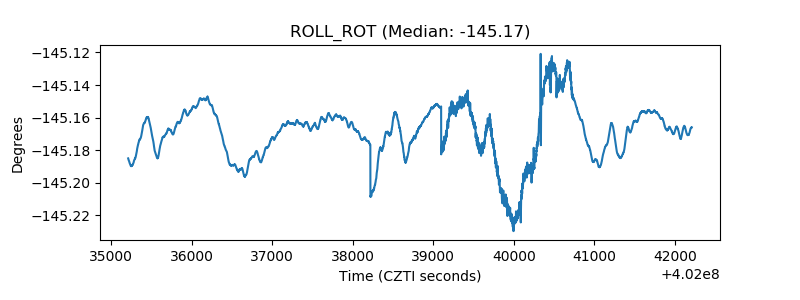 |
| _Roll_DEC | 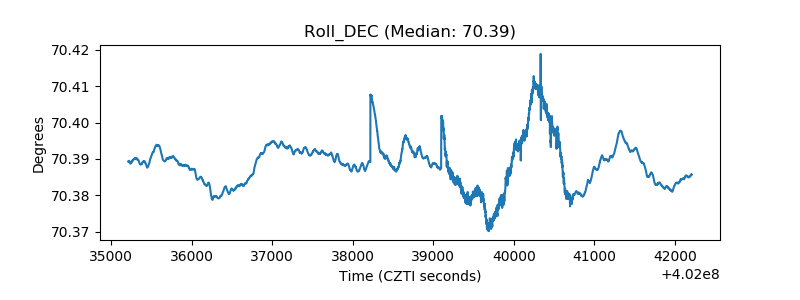 |
| _Roll_RA | 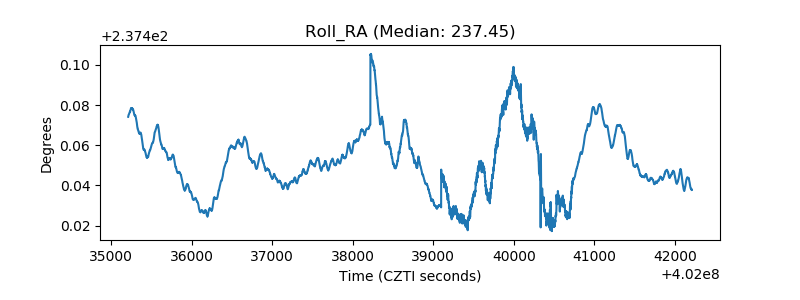 |
| Veto Counter | 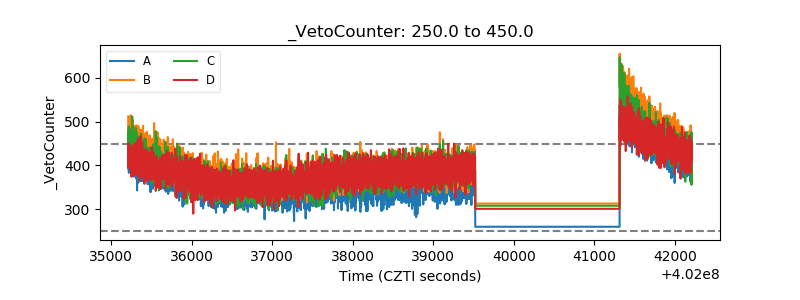 |