| Param | Original file | Final file |
|---|---|---|
| Filename | modeM0/AS1C07_001T12_9000005352_37852cztM0_level2.evt | modeM0/AS1C07_001T12_9000005352_37852cztM0_level2_quad_clean.evt |
| Size (bytes) | 412,620,480 | 101,710,080 |
| Size | 393.5 MB | 97.0 MB |
| Events in quadrant A | 3,041,967 | 696,741 |
| Events in quadrant B | 2,647,448 | 709,492 |
| Events in quadrant C | 2,672,846 | 674,405 |
| Events in quadrant D | 3,783,480 | 638,366 |
| Mode M9 | |||
|---|---|---|---|
| Quadrant | BADHDUFLAG | Total packets | Discarded packets |
| A | 0 | 22 | 0 |
| B | 0 | 22 | 0 |
| C | 0 | 22 | 0 |
| D | 0 | 23 | 0 |
| Mode M0 | |||
|---|---|---|---|
| Quadrant | BADHDUFLAG | Total packets | Discarded packets |
| A | 0 | 12106 | 3 |
| B | 0 | 11091 | 2 |
| C | 0 | 11071 | 2 |
| D | 0 | 14664 | 2 |
| Mode SS | |||
|---|---|---|---|
| Quadrant | BADHDUFLAG | Total packets | Discarded packets |
| A | 0 | 106 | 0 |
| B | 0 | 106 | 0 |
| C | 0 | 106 | 0 |
| D | 0 | 106 | 0 |
| Quadrant | Total seconds | Saturated seconds | Saturation percentage |
|---|---|---|---|
| A | 5155 | 96 | 1.862270% |
| B | 5155 | 57 | 1.105723% |
| C | 5155 | 44 | 0.853540% |
| D | 5155 | 228 | 4.422890% |
Noise dominated data is calculated using 1-second bins in cleaned event files. If a bin has >2000 counts, and if more than 50% of those come from <1% of pixels, then it is considered to be noise-dominated and hence unusable.
| Quadrant | # 1 sec bins | Bins with >0 counts | Bins with >2000 counts | High rate bins dominated by noise | Noise dominated (total time) | Noise dominated (detector-on time) | Marked lightcurve |
|---|---|---|---|---|---|---|---|
| A | 7097 | 5156 | 78 | 78 | 1.10% | 1.51% | 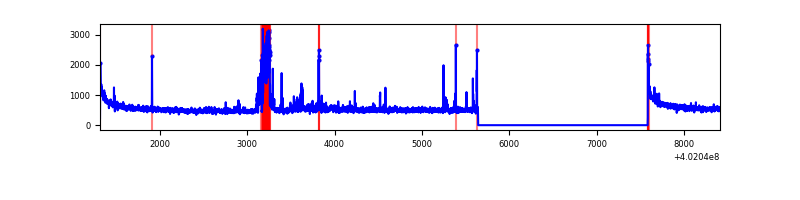 |
| B | 7097 | 5156 | 44 | 44 | 0.62% | 0.85% | 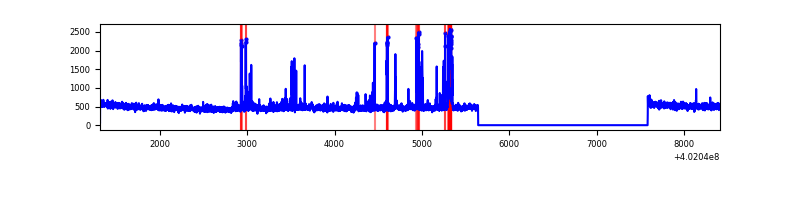 |
| C | 7097 | 5156 | 42 | 42 | 0.59% | 0.81% | 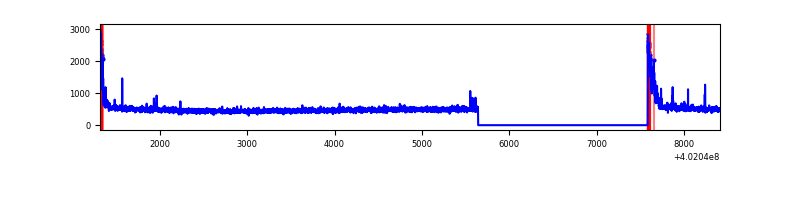 |
| D | 7097 | 5156 | 210 | 210 | 2.96% | 4.07% | 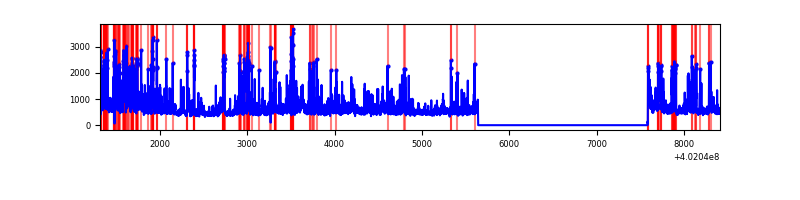 |
Top three noisy pixels from each quadrant. If the there are fewer than three noisy pixels in the level2.evt file, extra rows are filled as -1
| Pixel properties | Quadrant properties | ||||||
|---|---|---|---|---|---|---|---|
| Quadrant | DetID | PixID | Counts | Sigma | Mean | Median | Sigma |
| A | 9 | 143 | 341298 | 2794.5 | 606 | 596 | 121.9 |
| A | 10 | 83 | 337326 | 2761.92 | 606 | 596 | 121.9 |
| A | 13 | 6 | 13058 | 102.22 | 606 | 596 | 121.9 |
| B | 5 | 172 | 222877 | 1973.53 | 597 | 585 | 112.6 |
| B | 0 | 213 | 28060 | 243.93 | 597 | 585 | 112.6 |
| B | 0 | 230 | 25935 | 225.06 | 597 | 585 | 112.6 |
| C | 15 | 214 | 217041 | 1632.78 | 574 | 577 | 132.6 |
| C | 0 | 10 | 184642 | 1388.4 | 574 | 577 | 132.6 |
| C | 1 | 23 | 21160 | 155.26 | 574 | 577 | 132.6 |
| D | 2 | 249 | 660450 | 4664.16 | 576 | 559 | 141.5 |
| D | 1 | 52 | 263124 | 1855.83 | 576 | 559 | 141.5 |
| D | 1 | 47 | 136527 | 961.03 | 576 | 559 | 141.5 |
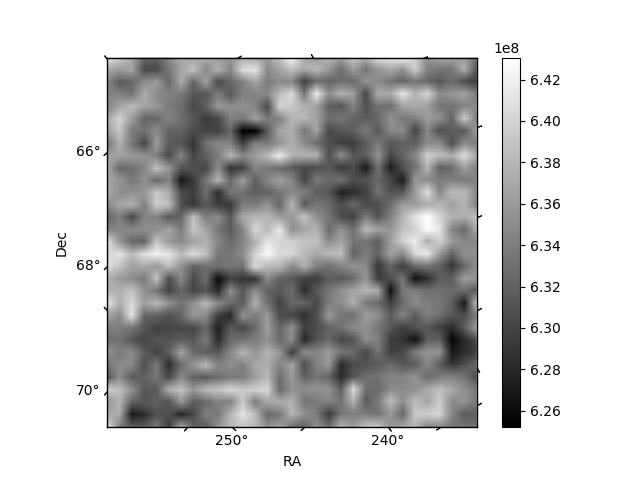
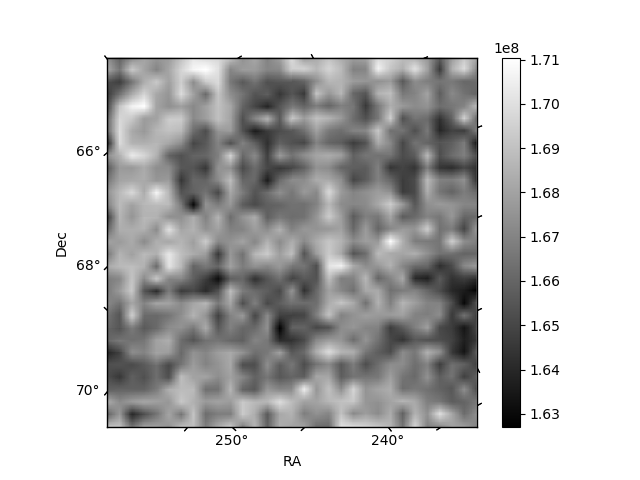
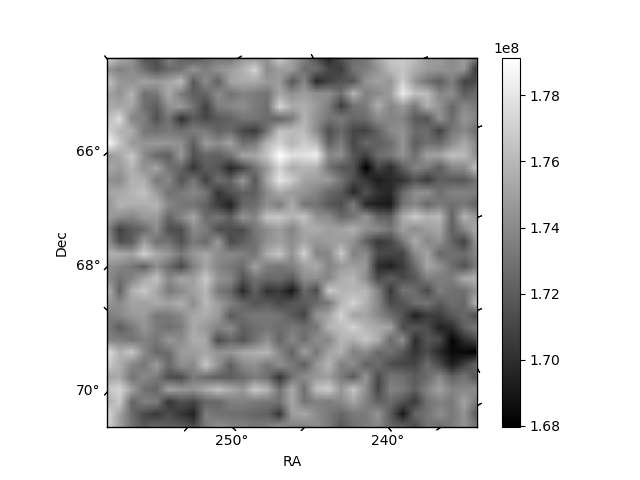
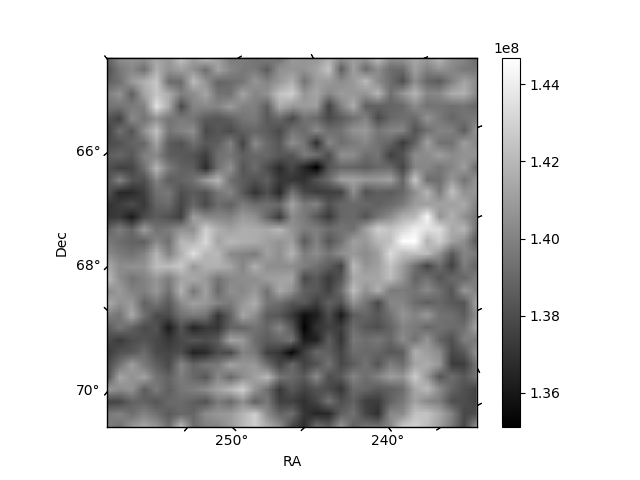
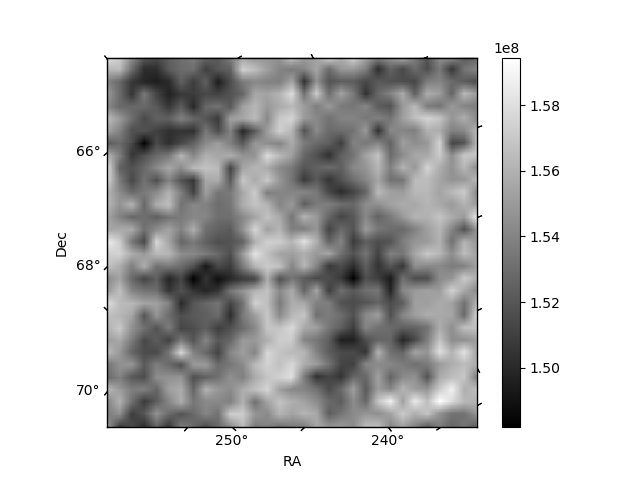
Histogram calculated using DETX and DETY for each event in the final _common_clean file
| Quadrant A | 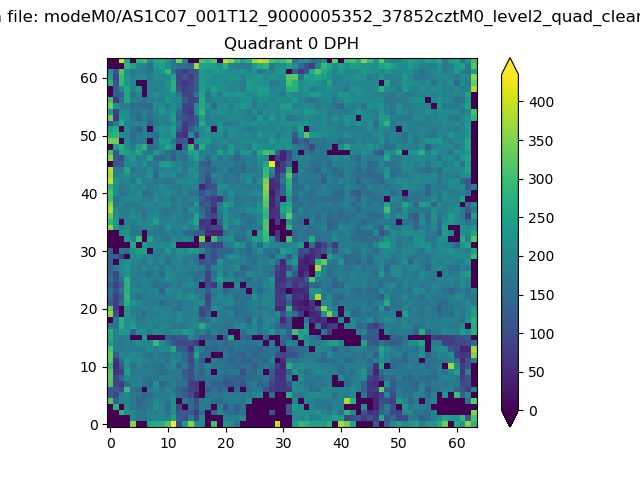 |
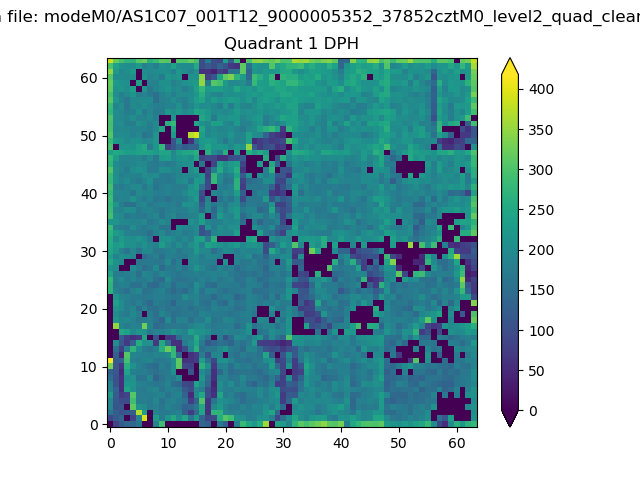 |
Quadrant B |
|---|---|---|---|
| Quadrant D | 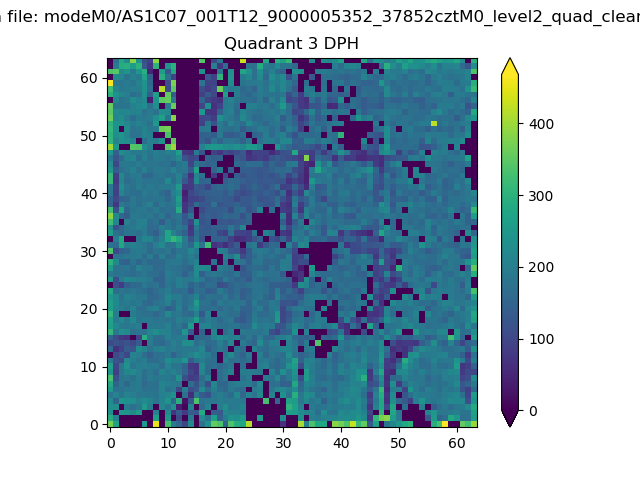 |
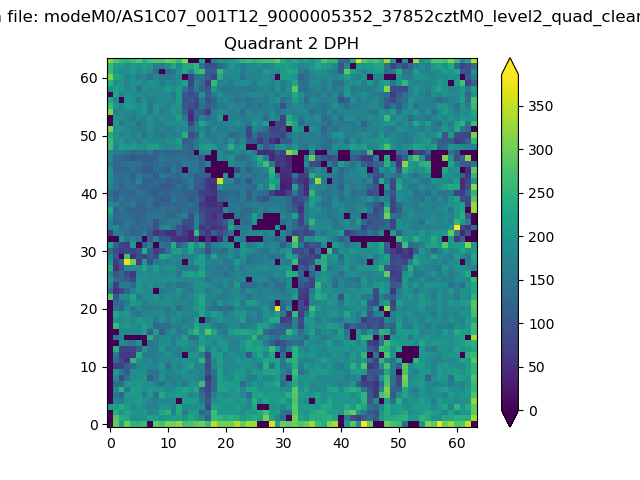 |
Quadrant C |
| Plot type | Count rate plots | Images |
|---|---|---|
| Comparison with Poisson distribution Blue bars denote a histogram of data divided into 1 sec bins. Red curve is a Poisson curve with rate = median count rate of data. |
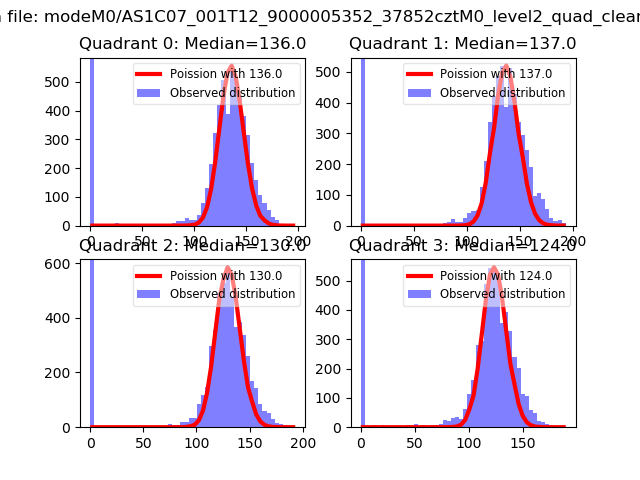 |
 |
| Quadrant-wise count rates Data is divided into 100 sec bins |
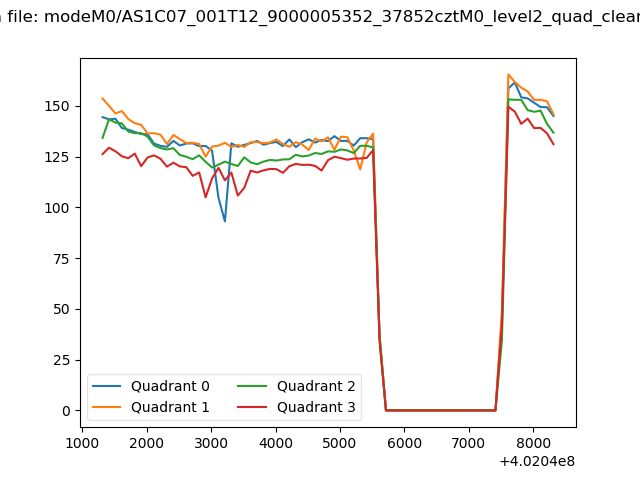 |
|
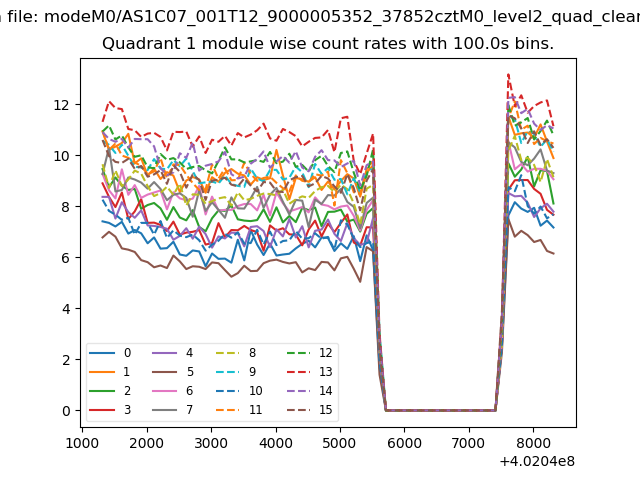
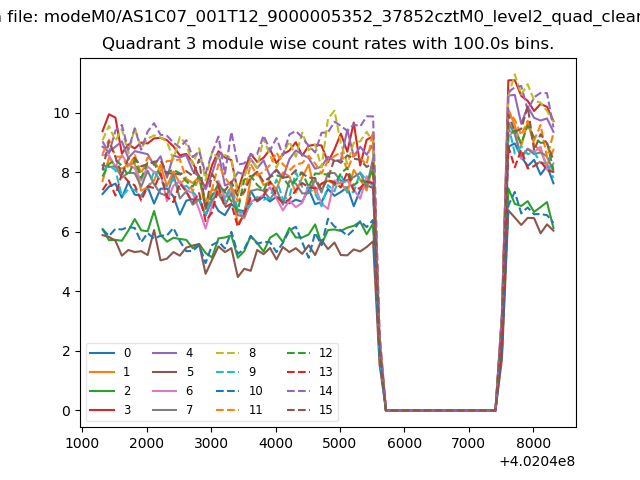
| Module-wise count rates for Quadrant A Data is divided into 100 sec bins |
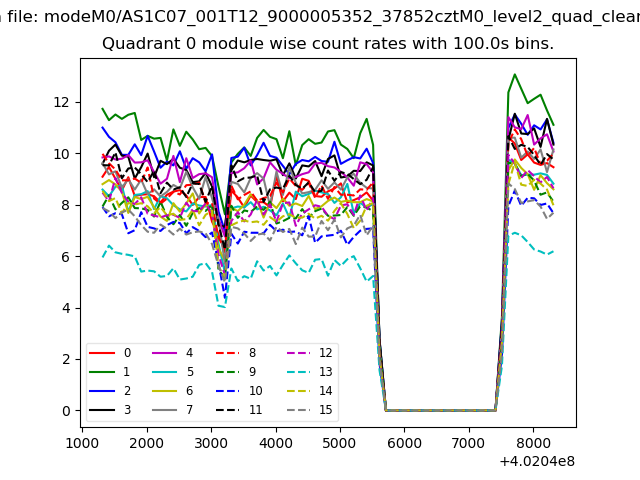 |
 |
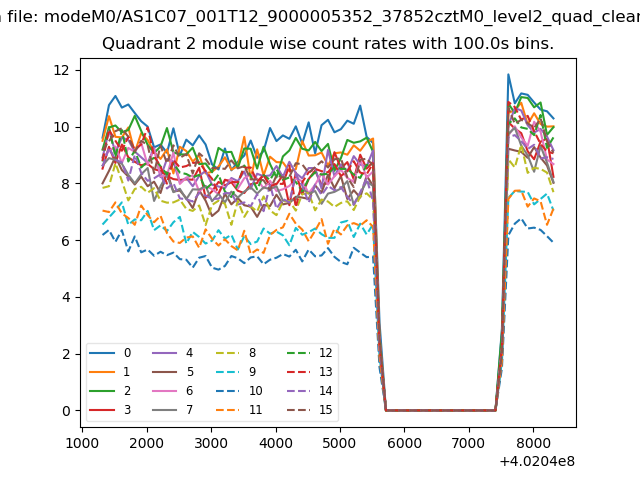
| Module-wise count rates for Quadrant B Data is divided into 100 sec bins |
 |
 |
| Module-wise count rates for Quadrant C Data is divided into 100 sec bins |
 |
 |
| Module-wise count rates for Quadrant D Data is divided into 100 sec bins |
 |
 |
| Parameter | Plot |
|---|---|
| CZT HV Monitor |  |
| D_VDD | 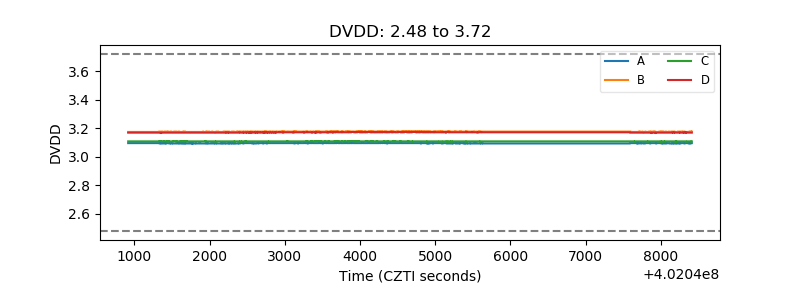 |
| Temperature 1 | 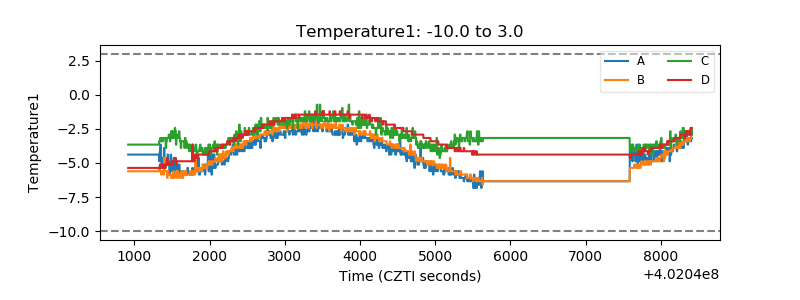 |
| Veto HV Monitor | 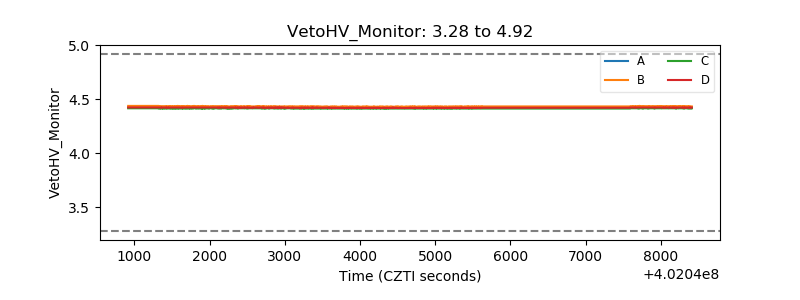 |
| Veto LLD | 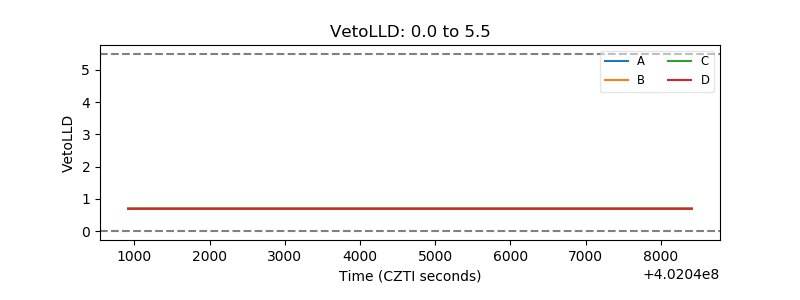 |
| Alpha Counter | 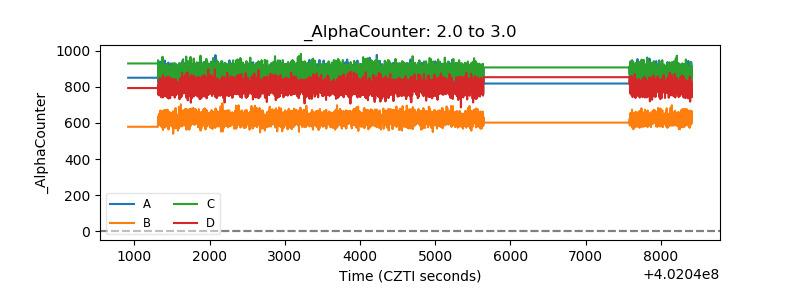 |
| _CPM_Rate | 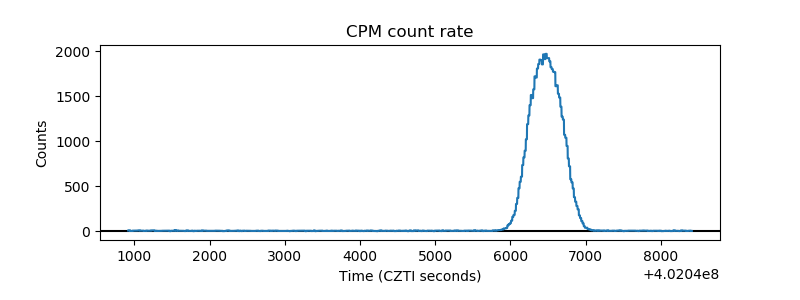 |
| CZT Counter | 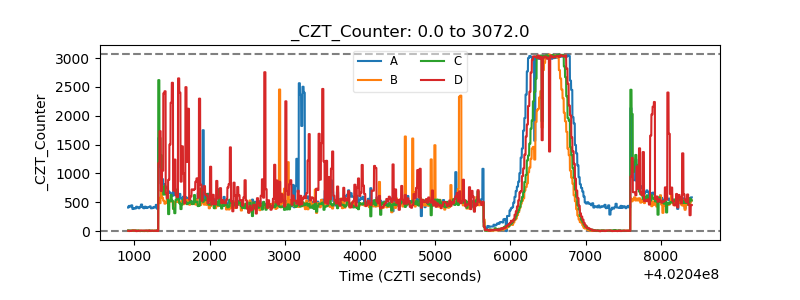 |
| +2.5 Volts monitor | 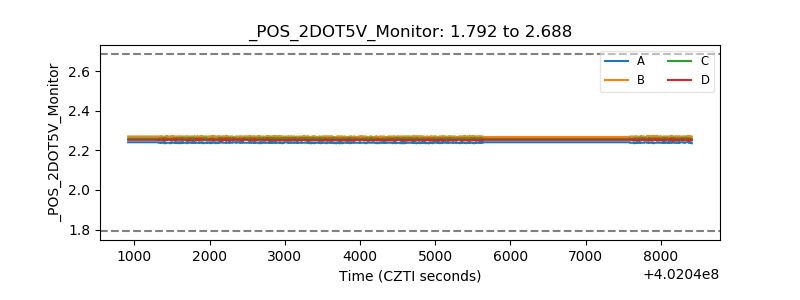 |
| +5 Volts monitor | 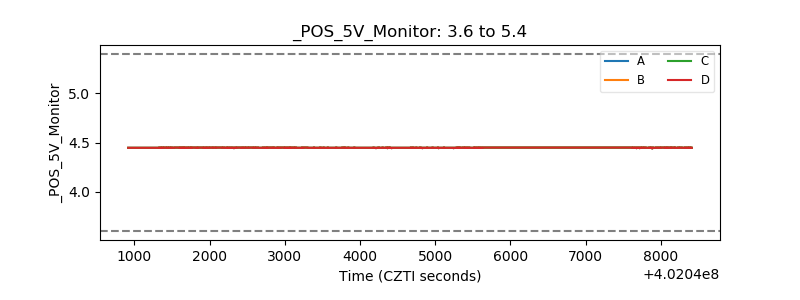 |
| _ROLL_ROT | 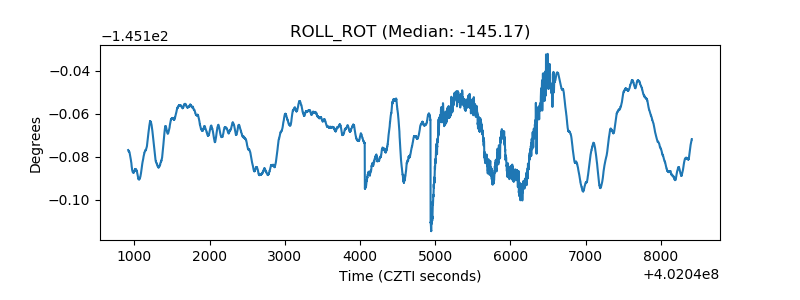 |
| _Roll_DEC | 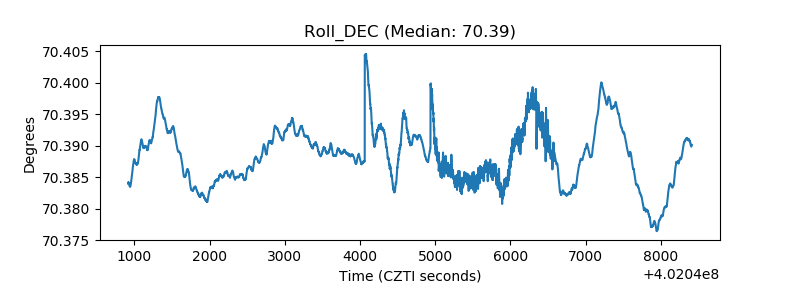 |
| _Roll_RA | 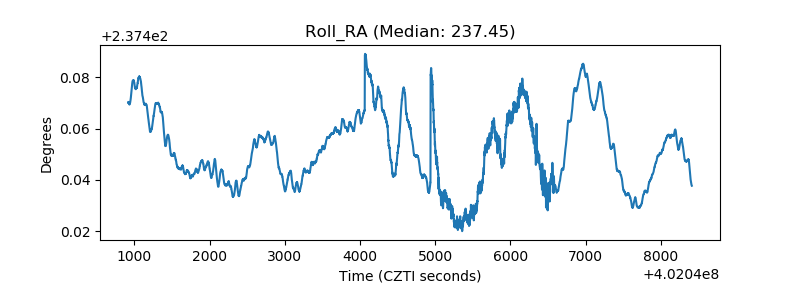 |
| Veto Counter | 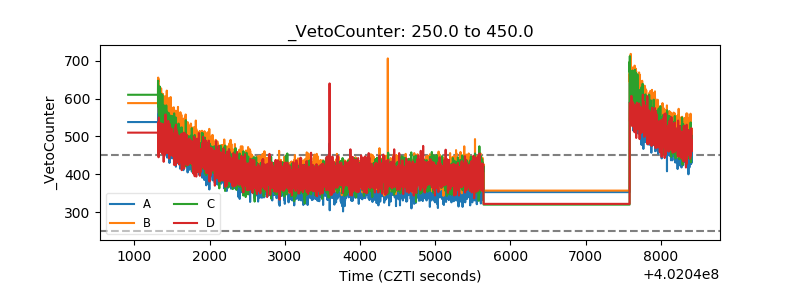 |