| Param | Original file | Final file |
|---|---|---|
| Filename | modeM0/AS1C07_001T12_9000005352_37853cztM0_level2.evt | modeM0/AS1C07_001T12_9000005352_37853cztM0_level2_quad_clean.evt |
| Size (bytes) | 430,280,640 | 95,970,240 |
| Size | 410.3 MB | 91.5 MB |
| Events in quadrant A | 2,743,208 | 670,148 |
| Events in quadrant B | 2,881,718 | 664,995 |
| Events in quadrant C | 2,636,423 | 632,275 |
| Events in quadrant D | 4,434,305 | 592,566 |
| Mode M9 | |||
|---|---|---|---|
| Quadrant | BADHDUFLAG | Total packets | Discarded packets |
| A | 0 | 20 | 0 |
| B | 0 | 20 | 0 |
| C | 0 | 20 | 0 |
| D | 0 | 20 | 0 |
| Mode M0 | |||
|---|---|---|---|
| Quadrant | BADHDUFLAG | Total packets | Discarded packets |
| A | 0 | 11022 | 2 |
| B | 0 | 11518 | 1 |
| C | 0 | 10634 | 1 |
| D | 0 | 16459 | 1 |
| Mode SS | |||
|---|---|---|---|
| Quadrant | BADHDUFLAG | Total packets | Discarded packets |
| A | 0 | 102 | 0 |
| B | 0 | 102 | 0 |
| C | 0 | 102 | 0 |
| D | 0 | 102 | 0 |
| Quadrant | Total seconds | Saturated seconds | Saturation percentage |
|---|---|---|---|
| A | 4935 | 24 | 0.486322% |
| B | 4935 | 133 | 2.695035% |
| C | 4935 | 28 | 0.567376% |
| D | 4935 | 407 | 8.247214% |
Noise dominated data is calculated using 1-second bins in cleaned event files. If a bin has >2000 counts, and if more than 50% of those come from <1% of pixels, then it is considered to be noise-dominated and hence unusable.
| Quadrant | # 1 sec bins | Bins with >0 counts | Bins with >2000 counts | High rate bins dominated by noise | Noise dominated (total time) | Noise dominated (detector-on time) | Marked lightcurve |
|---|---|---|---|---|---|---|---|
| A | 6968 | 4936 | 13 | 13 | 0.19% | 0.26% | 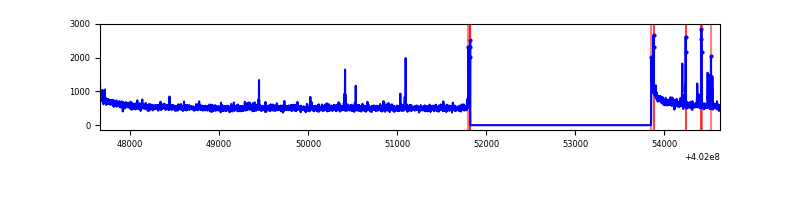 |
| B | 6968 | 4936 | 102 | 102 | 1.46% | 2.07% | 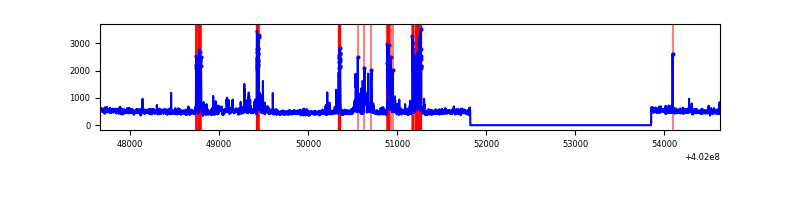 |
| C | 6968 | 4936 | 24 | 24 | 0.34% | 0.49% | 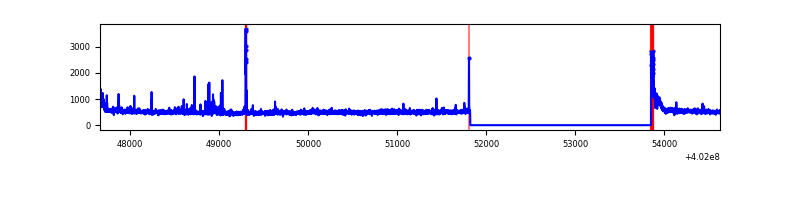 |
| D | 6968 | 4936 | 402 | 402 | 5.77% | 8.14% | 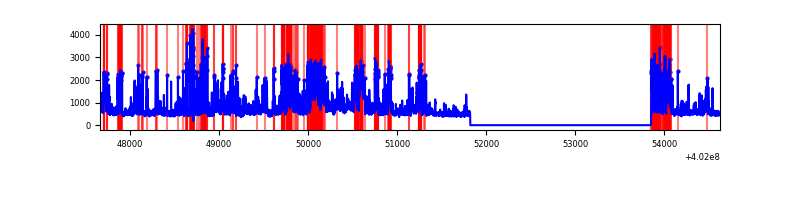 |
Top three noisy pixels from each quadrant. If the there are fewer than three noisy pixels in the level2.evt file, extra rows are filled as -1
| Pixel properties | Quadrant properties | ||||||
|---|---|---|---|---|---|---|---|
| Quadrant | DetID | PixID | Counts | Sigma | Mean | Median | Sigma |
| A | 10 | 83 | 302949 | 2548.9 | 600 | 590 | 118.6 |
| A | 9 | 143 | 87645 | 733.87 | 600 | 590 | 118.6 |
| A | 13 | 6 | 12964 | 104.31 | 600 | 590 | 118.6 |
| B | 5 | 172 | 465743 | 4241.5 | 581 | 569 | 109.7 |
| B | 0 | 213 | 41946 | 377.28 | 581 | 569 | 109.7 |
| B | 0 | 155 | 32531 | 291.43 | 581 | 569 | 109.7 |
| C | 15 | 214 | 209700 | 1614.14 | 563 | 566 | 129.6 |
| C | 0 | 10 | 119475 | 917.76 | 563 | 566 | 129.6 |
| C | 1 | 23 | 75028 | 574.71 | 563 | 566 | 129.6 |
| D | 2 | 249 | 968439 | 7216.42 | 561 | 546 | 134.1 |
| D | 12 | 233 | 460880 | 3432.16 | 561 | 546 | 134.1 |
| D | 1 | 52 | 460146 | 3426.69 | 561 | 546 | 134.1 |
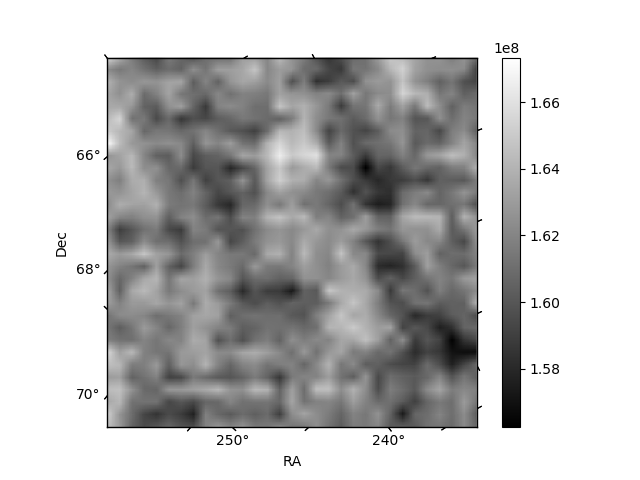
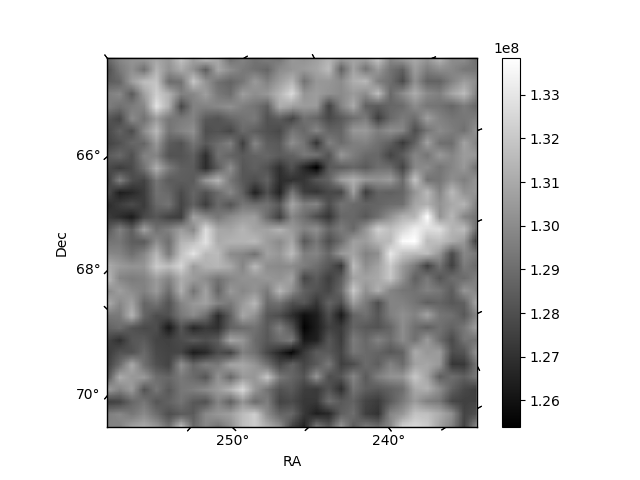
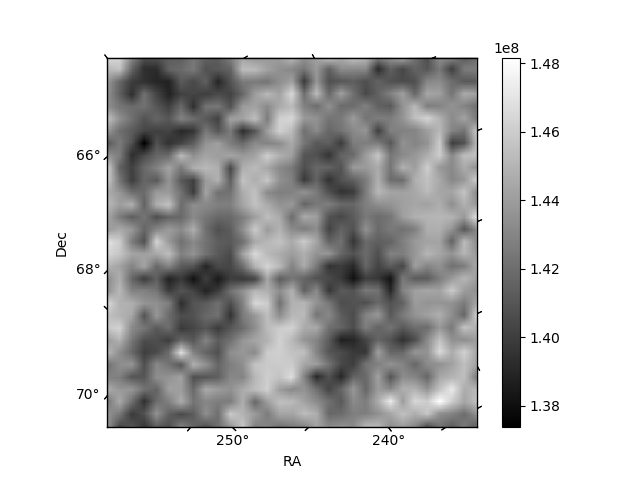
Histogram calculated using DETX and DETY for each event in the final _common_clean file
| Quadrant A | 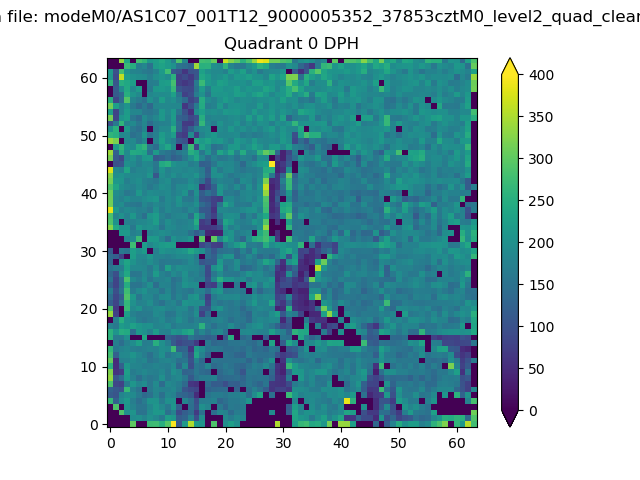 |
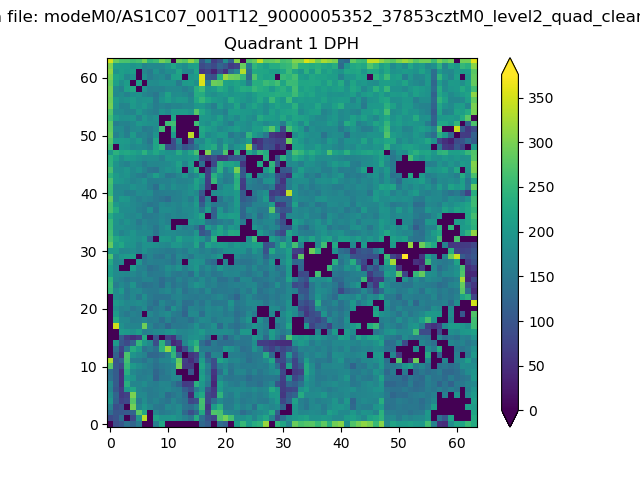 |
Quadrant B |
|---|---|---|---|
| Quadrant D | 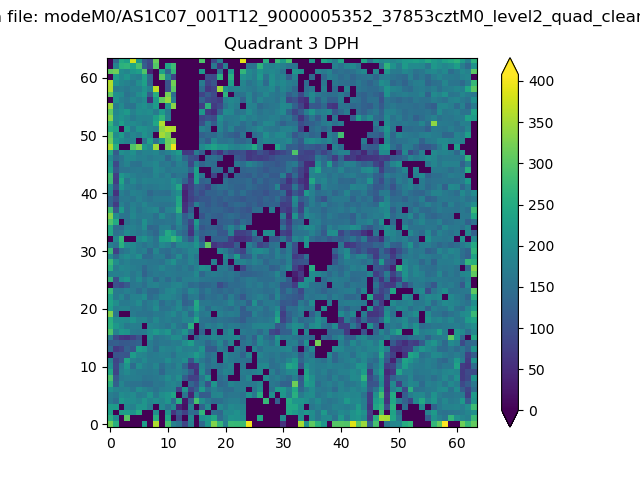 |
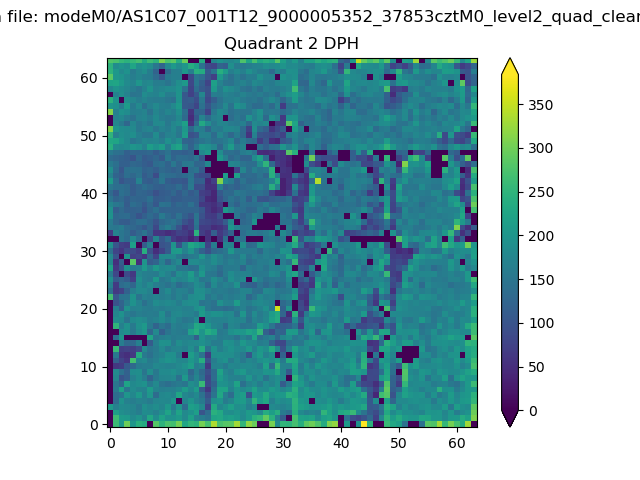 |
Quadrant C |
| Plot type | Count rate plots | Images |
|---|---|---|
| Comparison with Poisson distribution Blue bars denote a histogram of data divided into 1 sec bins. Red curve is a Poisson curve with rate = median count rate of data. |
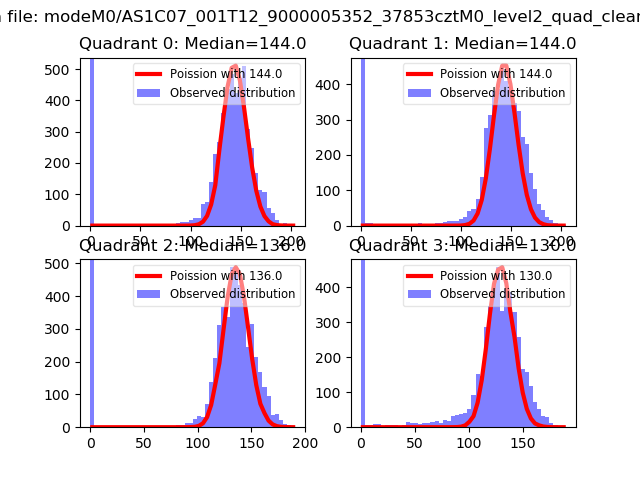 |
 |
| Quadrant-wise count rates Data is divided into 100 sec bins |
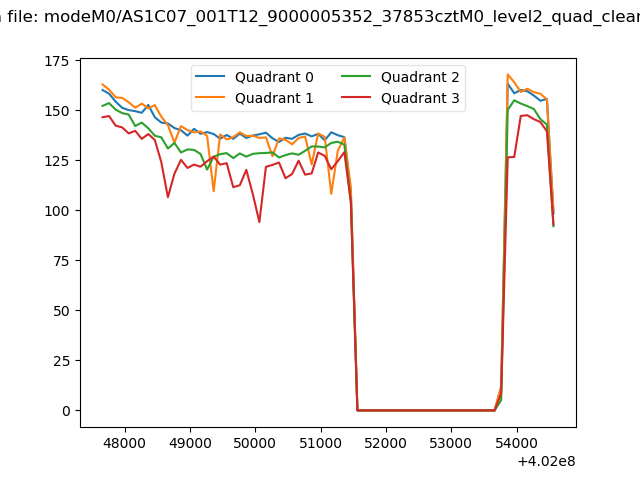 |
|
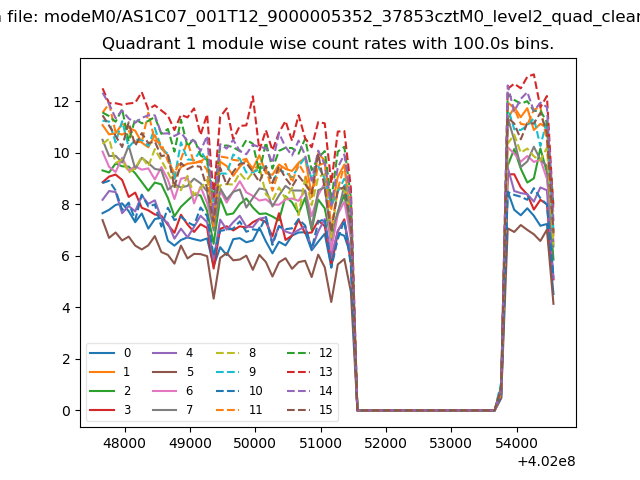
| Module-wise count rates for Quadrant A Data is divided into 100 sec bins |
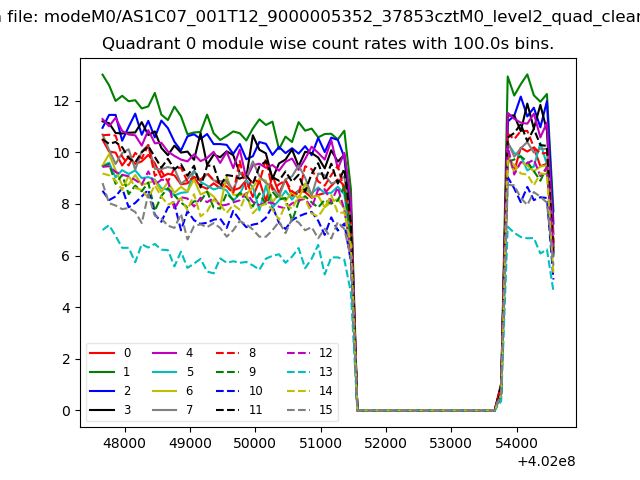 |
 |
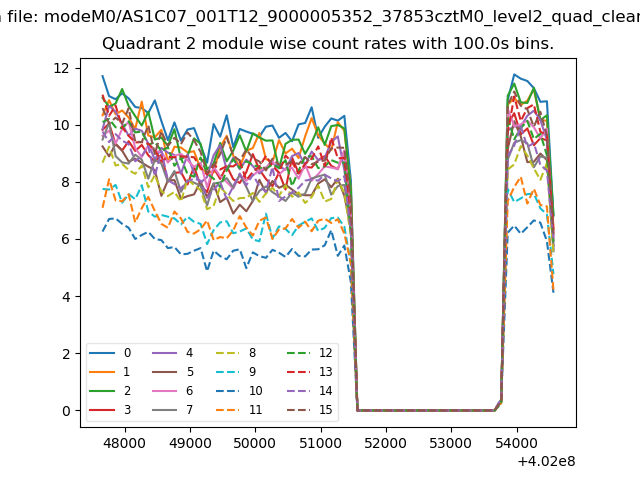
| Module-wise count rates for Quadrant B Data is divided into 100 sec bins |
 |
 |
| Module-wise count rates for Quadrant C Data is divided into 100 sec bins |
 |
 |
| Module-wise count rates for Quadrant D Data is divided into 100 sec bins |
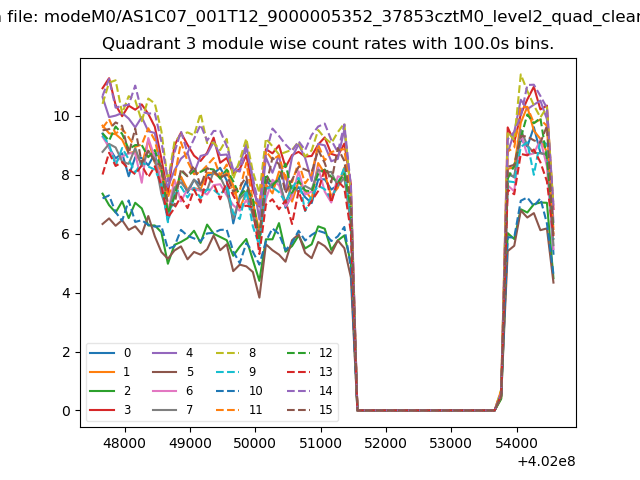 |
 |
| Parameter | Plot |
|---|---|
| CZT HV Monitor | 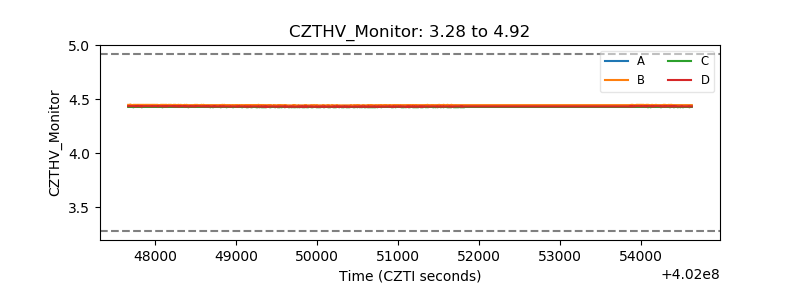 |
| D_VDD | 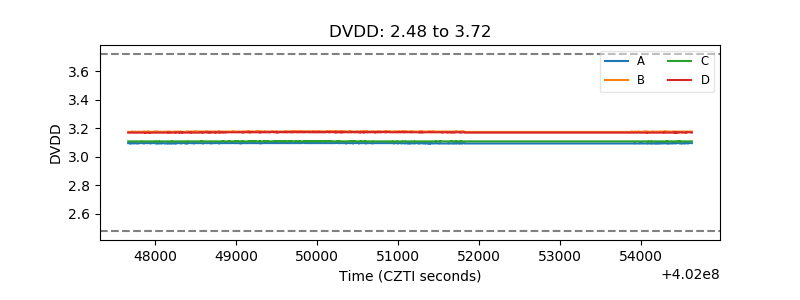 |
| Temperature 1 | 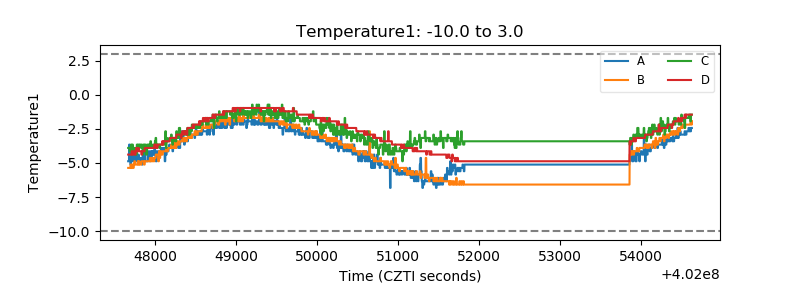 |
| Veto HV Monitor | 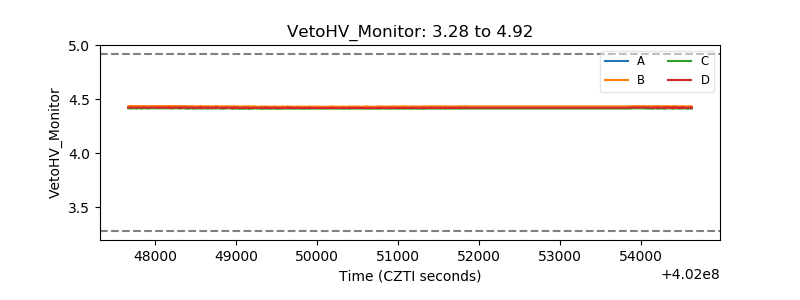 |
| Veto LLD | 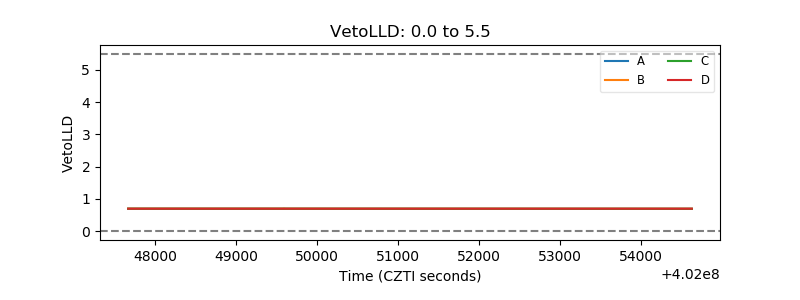 |
| Alpha Counter | 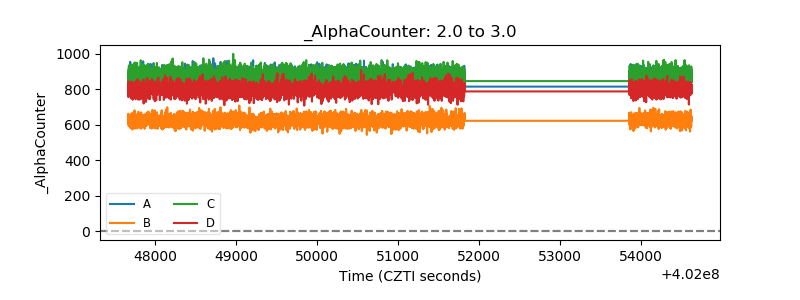 |
| _CPM_Rate | 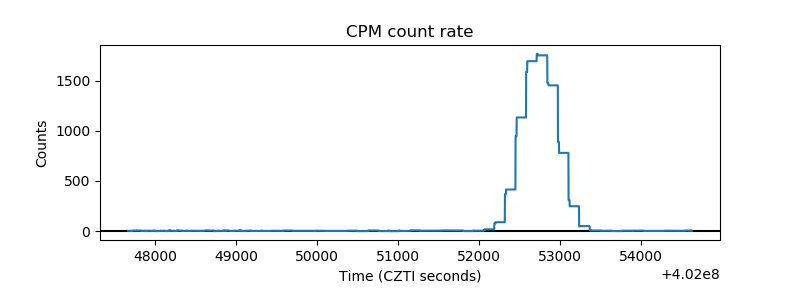 |
| CZT Counter | 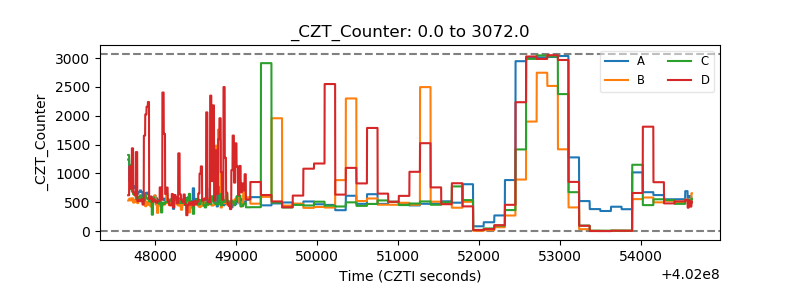 |
| +2.5 Volts monitor | 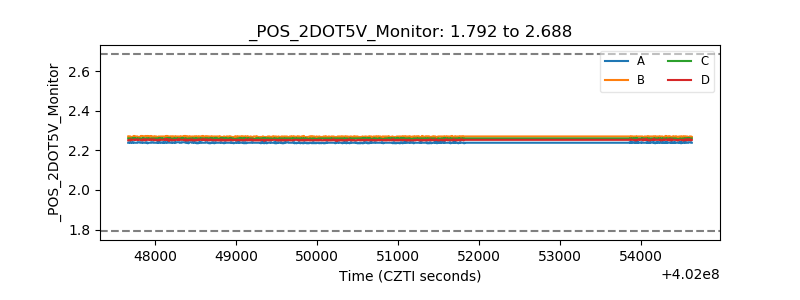 |
| +5 Volts monitor | 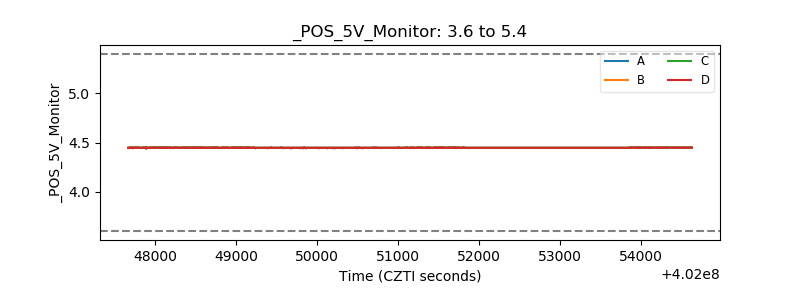 |
| _ROLL_ROT | 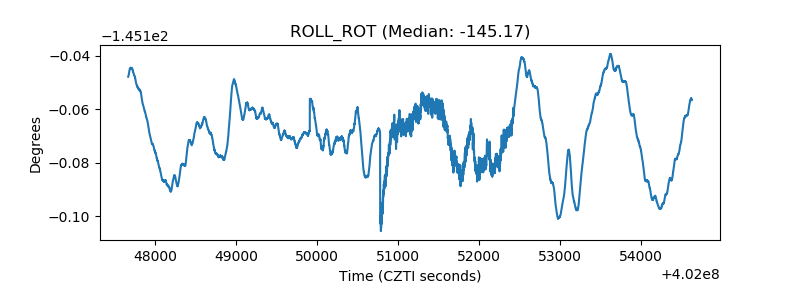 |
| _Roll_DEC | 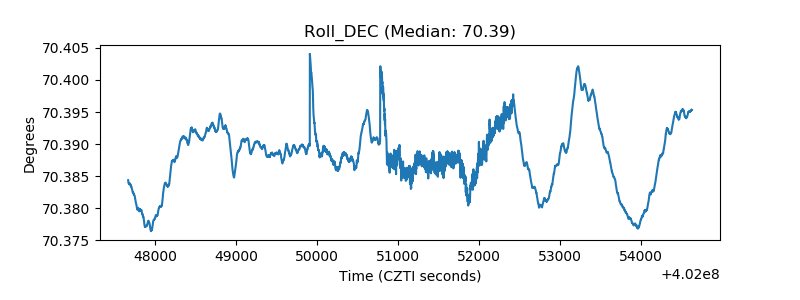 |
| _Roll_RA | 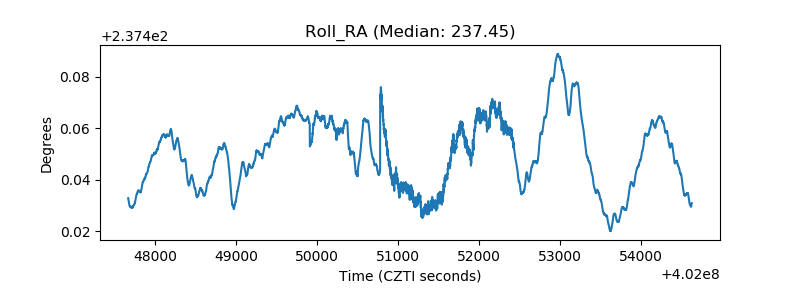 |
| Veto Counter | 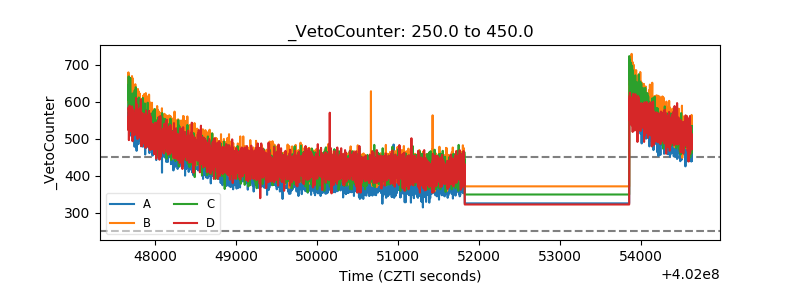 |