| Param | Original file | Final file |
|---|---|---|
| Filename | modeM0/AS1C07_001T12_9000005352_37854cztM0_level2.evt | modeM0/AS1C07_001T12_9000005352_37854cztM0_level2_quad_clean.evt |
| Size (bytes) | 485,864,640 | 90,025,920 |
| Size | 463.4 MB | 85.9 MB |
| Events in quadrant A | 2,812,826 | 631,011 |
| Events in quadrant B | 3,043,076 | 624,257 |
| Events in quadrant C | 2,661,445 | 593,492 |
| Events in quadrant D | 5,861,204 | 529,811 |
| Mode M9 | |||
|---|---|---|---|
| Quadrant | BADHDUFLAG | Total packets | Discarded packets |
| A | 0 | 23 | 0 |
| B | 0 | 23 | 0 |
| C | 0 | 23 | 0 |
| D | 0 | 24 | 0 |
| Mode M0 | |||
|---|---|---|---|
| Quadrant | BADHDUFLAG | Total packets | Discarded packets |
| A | 0 | 11284 | 3 |
| B | 0 | 12078 | 2 |
| C | 0 | 10640 | 2 |
| D | 0 | 20755 | 2 |
| Mode SS | |||
|---|---|---|---|
| Quadrant | BADHDUFLAG | Total packets | Discarded packets |
| A | 0 | 100 | 0 |
| B | 0 | 100 | 0 |
| C | 0 | 100 | 0 |
| D | 0 | 100 | 0 |
| Quadrant | Total seconds | Saturated seconds | Saturation percentage |
|---|---|---|---|
| A | 4957 | 23 | 0.463990% |
| B | 4957 | 130 | 2.622554% |
| C | 4957 | 37 | 0.746419% |
| D | 4957 | 1017 | 20.516441% |
Noise dominated data is calculated using 1-second bins in cleaned event files. If a bin has >2000 counts, and if more than 50% of those come from <1% of pixels, then it is considered to be noise-dominated and hence unusable.
| Quadrant | # 1 sec bins | Bins with >0 counts | Bins with >2000 counts | High rate bins dominated by noise | Noise dominated (total time) | Noise dominated (detector-on time) | Marked lightcurve |
|---|---|---|---|---|---|---|---|
| A | 7080 | 4958 | 12 | 12 | 0.17% | 0.24% | 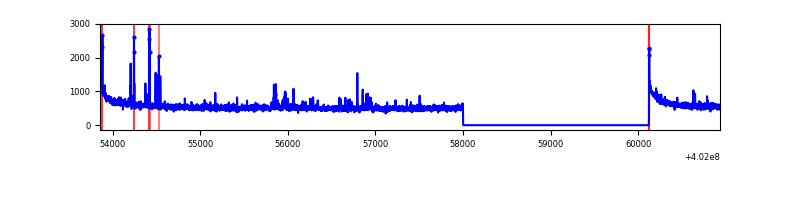 |
| B | 7080 | 4958 | 111 | 111 | 1.57% | 2.24% | 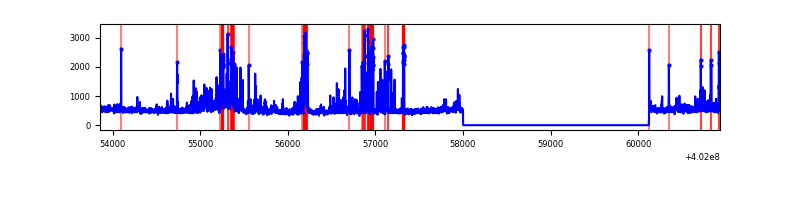 |
| C | 7080 | 4958 | 35 | 35 | 0.49% | 0.71% | 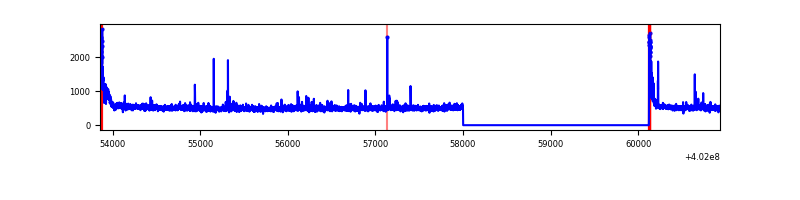 |
| D | 7080 | 4958 | 915 | 915 | 12.92% | 18.46% | 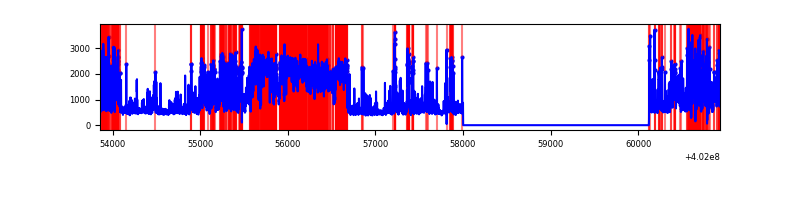 |
Top three noisy pixels from each quadrant. If the there are fewer than three noisy pixels in the level2.evt file, extra rows are filled as -1
| Pixel properties | Quadrant properties | ||||||
|---|---|---|---|---|---|---|---|
| Quadrant | DetID | PixID | Counts | Sigma | Mean | Median | Sigma |
| A | 10 | 83 | 338061 | 2812.08 | 602 | 593 | 120.0 |
| A | 12 | 16 | 58920 | 486.03 | 602 | 593 | 120.0 |
| A | 9 | 143 | 45051 | 370.46 | 602 | 593 | 120.0 |
| B | 5 | 172 | 420565 | 3893.56 | 581 | 569 | 107.9 |
| B | 0 | 213 | 117862 | 1087.36 | 581 | 569 | 107.9 |
| B | 0 | 229 | 89960 | 828.7 | 581 | 569 | 107.9 |
| C | 15 | 214 | 223646 | 1716.59 | 568 | 572 | 130.0 |
| C | 0 | 10 | 153510 | 1176.89 | 568 | 572 | 130.0 |
| C | 14 | 254 | 29052 | 219.16 | 568 | 572 | 130.0 |
| D | 1 | 52 | 1319395 | 9832.61 | 547 | 531 | 134.1 |
| D | 13 | 249 | 1055433 | 7864.68 | 547 | 531 | 134.1 |
| D | 12 | 233 | 546522 | 4070.56 | 547 | 531 | 134.1 |
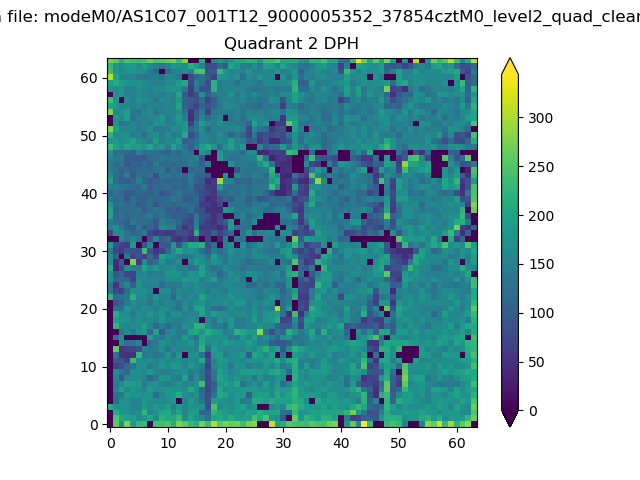
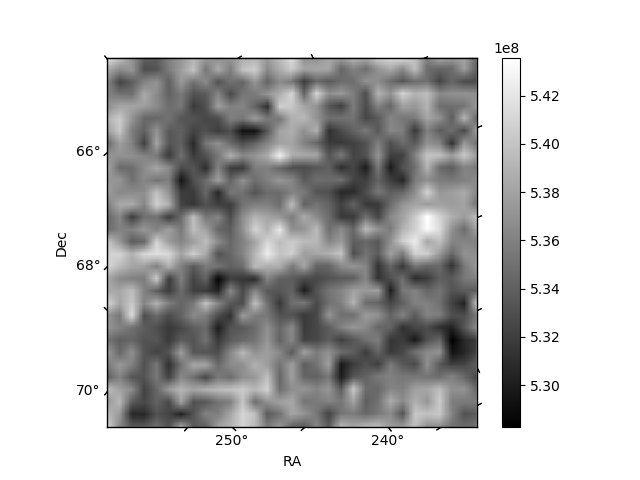
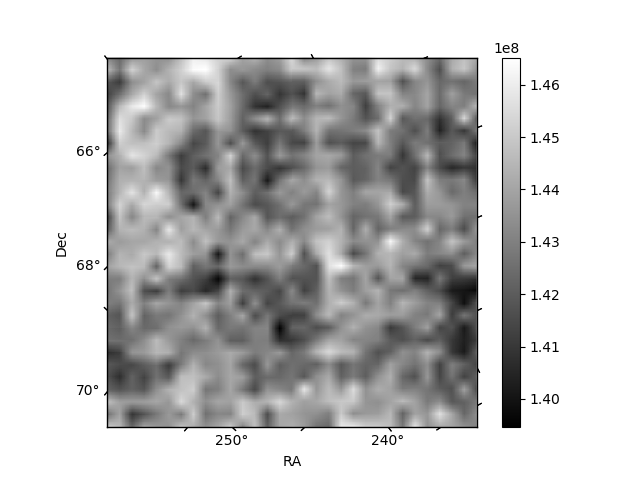
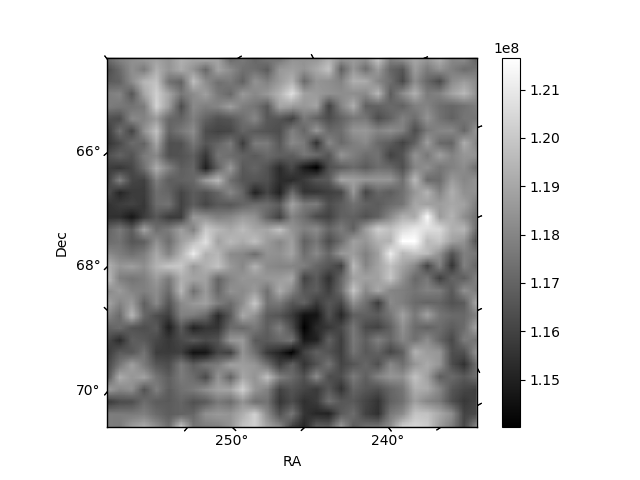
Histogram calculated using DETX and DETY for each event in the final _common_clean file
| Quadrant A | 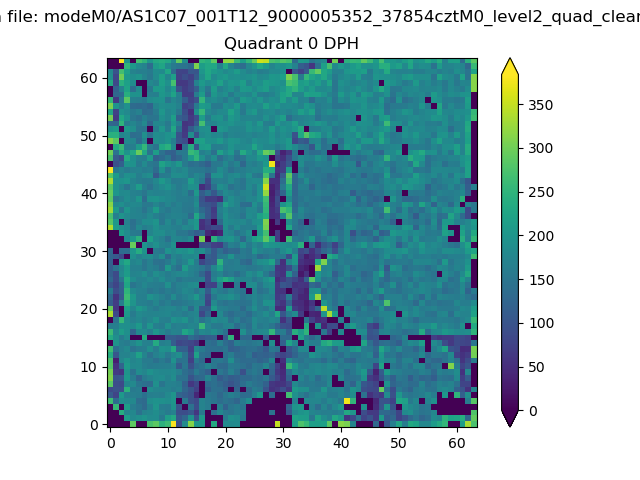 |
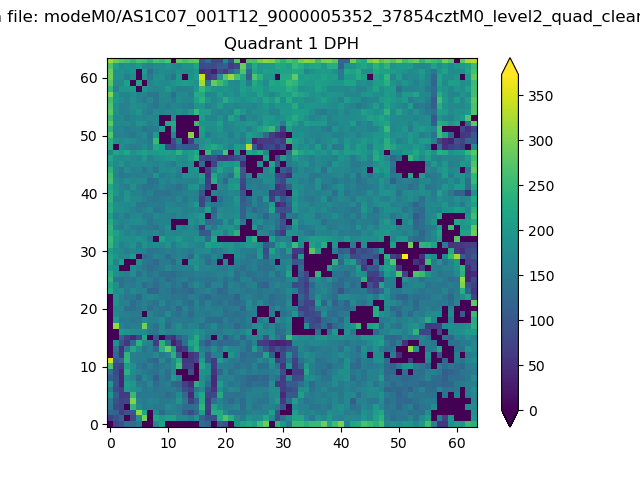 |
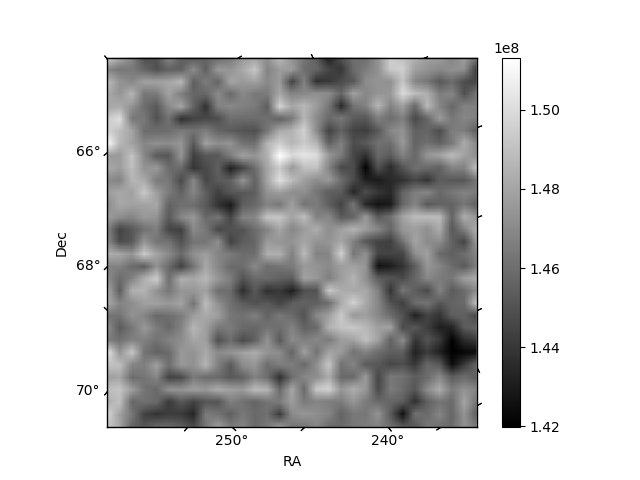
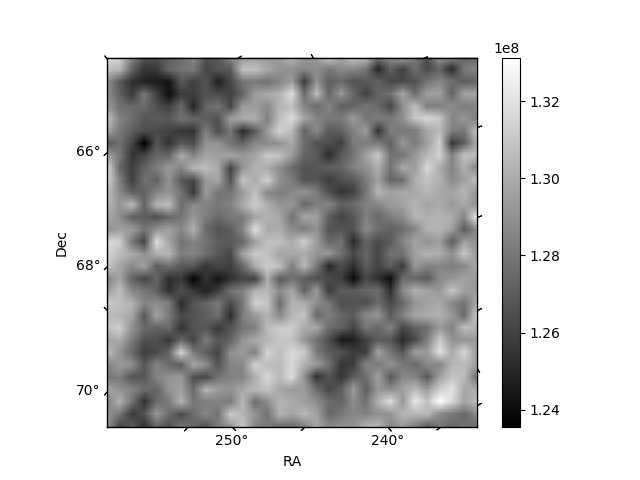
Quadrant B |
|---|---|---|---|
| Quadrant D | 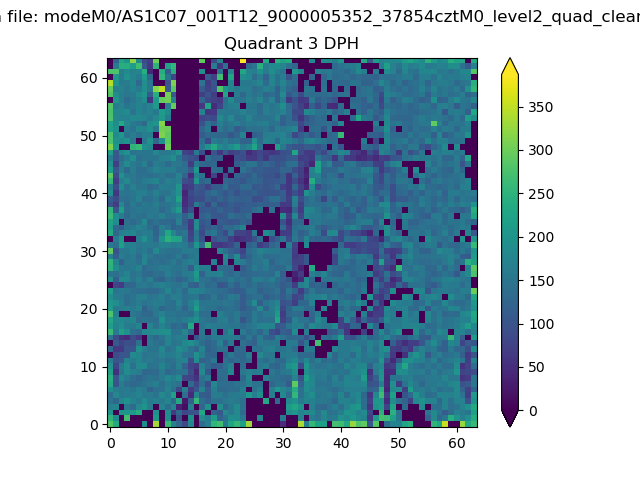 |
 |
Quadrant C |
| Plot type | Count rate plots | Images |
|---|---|---|
| Comparison with Poisson distribution Blue bars denote a histogram of data divided into 1 sec bins. Red curve is a Poisson curve with rate = median count rate of data. |
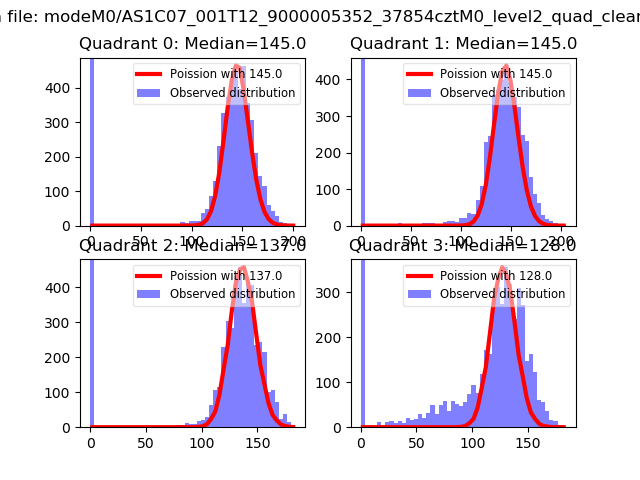 |
 |
| Quadrant-wise count rates Data is divided into 100 sec bins |
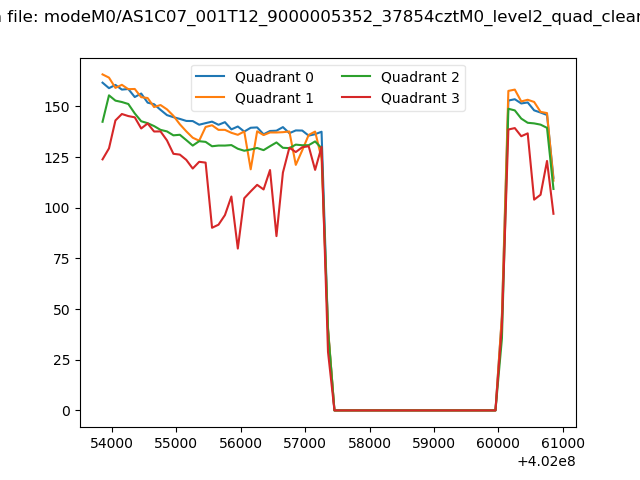 |
|
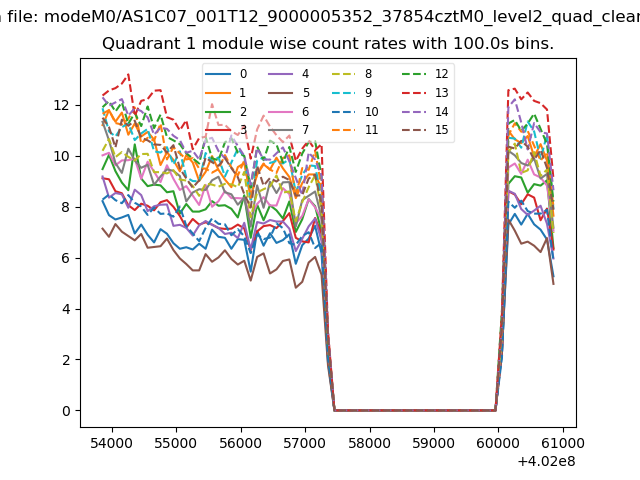
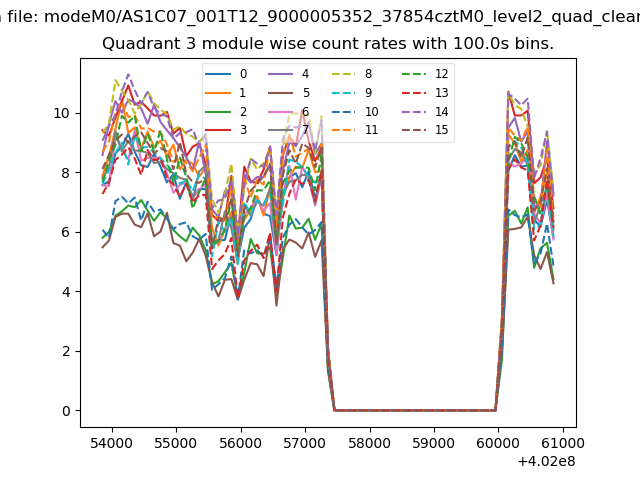
| Module-wise count rates for Quadrant A Data is divided into 100 sec bins |
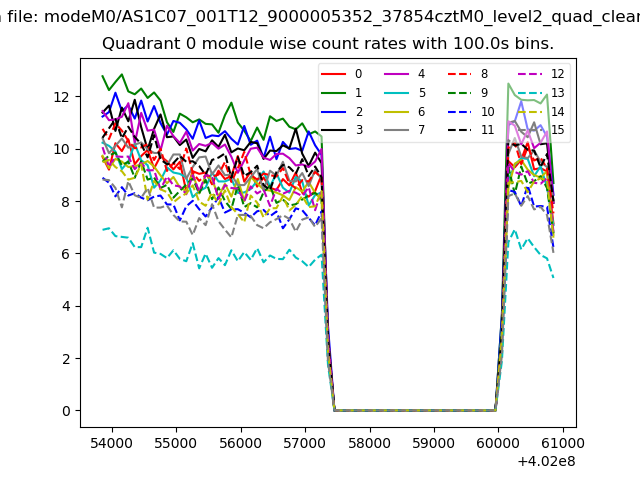 |
 |
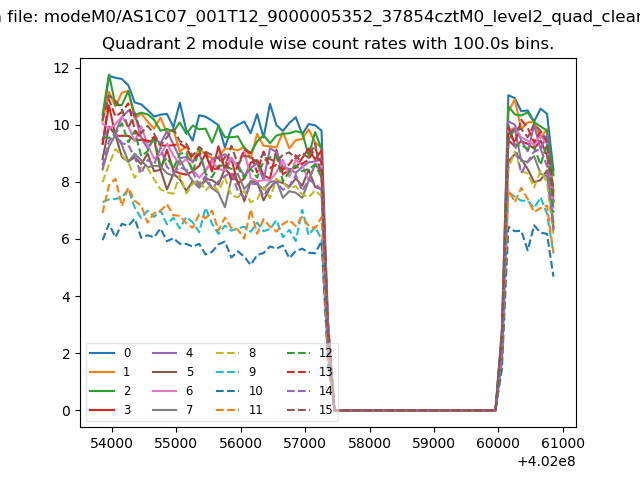
| Module-wise count rates for Quadrant B Data is divided into 100 sec bins |
 |
 |
| Module-wise count rates for Quadrant C Data is divided into 100 sec bins |
 |
 |
| Module-wise count rates for Quadrant D Data is divided into 100 sec bins |
 |
 |
| Parameter | Plot |
|---|---|
| CZT HV Monitor | 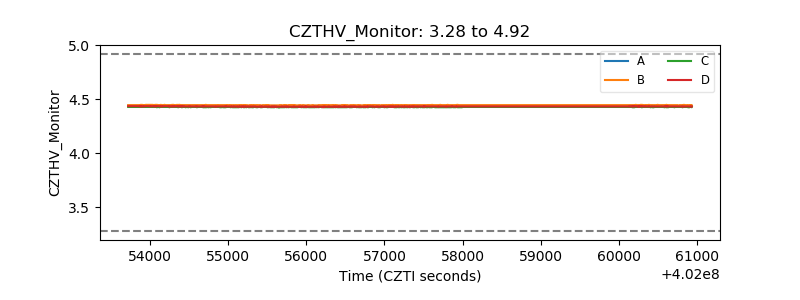 |
| D_VDD | 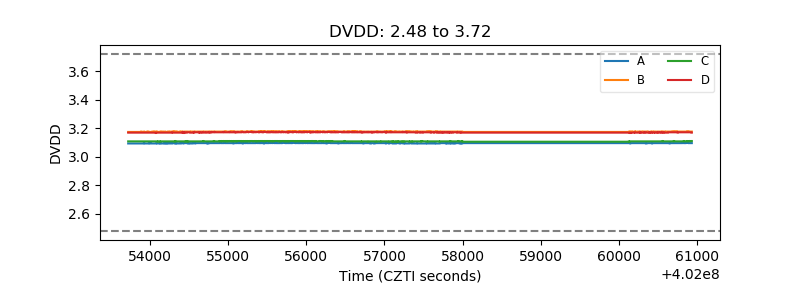 |
| Temperature 1 | 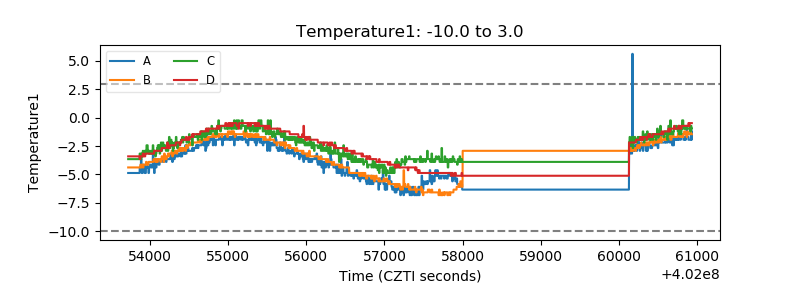 |
| Veto HV Monitor | 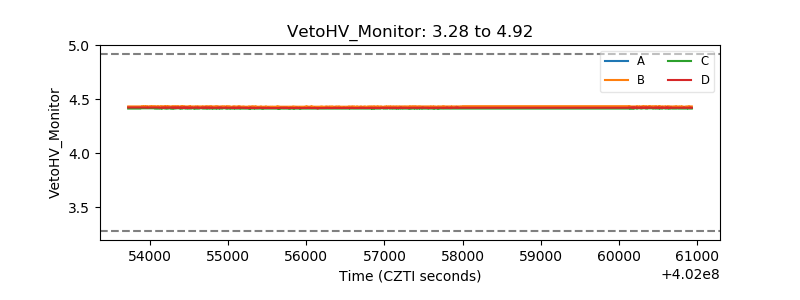 |
| Veto LLD | 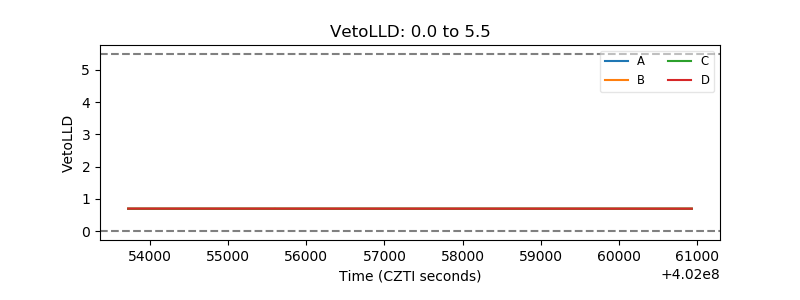 |
| Alpha Counter | 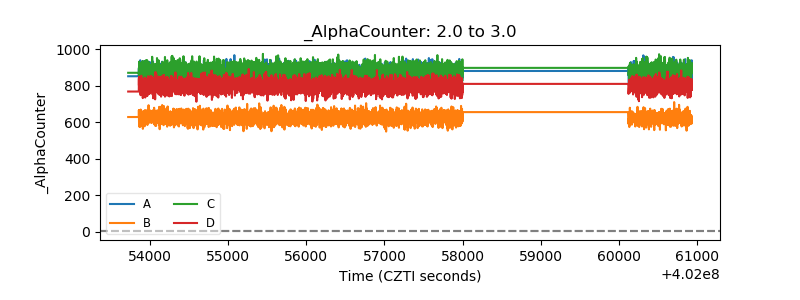 |
| _CPM_Rate | 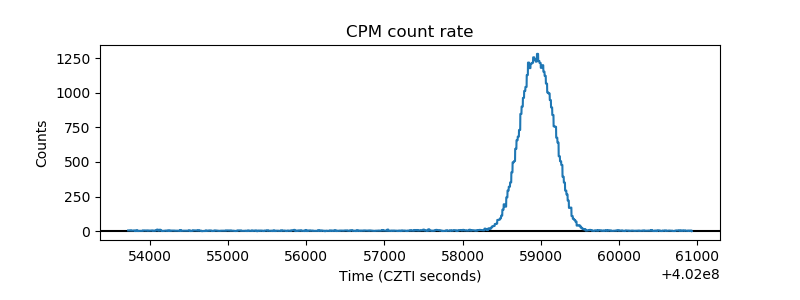 |
| CZT Counter | 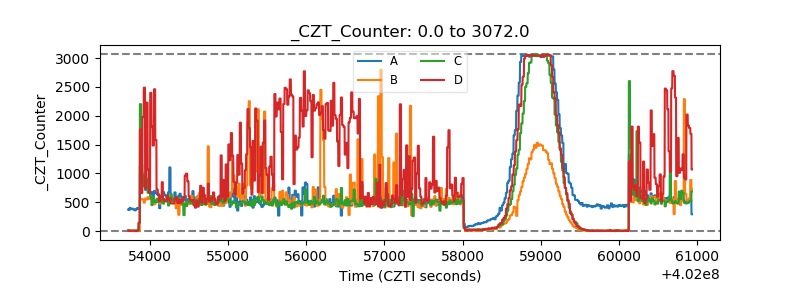 |
| +2.5 Volts monitor | 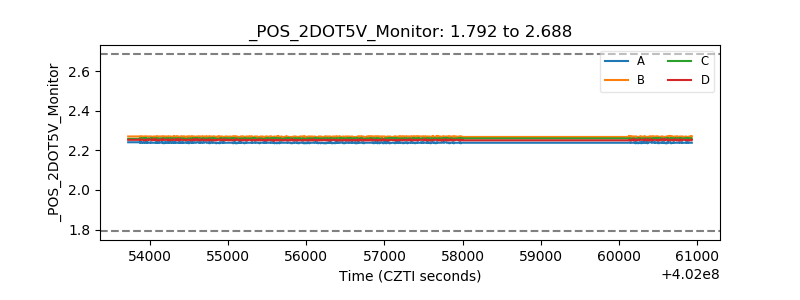 |
| +5 Volts monitor | 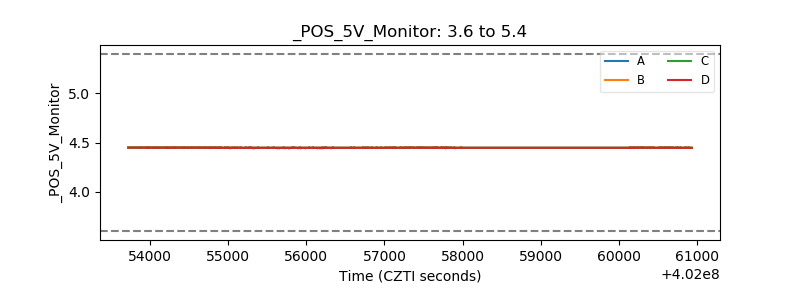 |
| _ROLL_ROT | 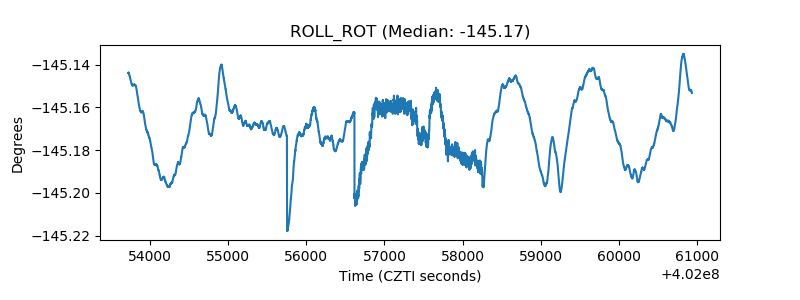 |
| _Roll_DEC | 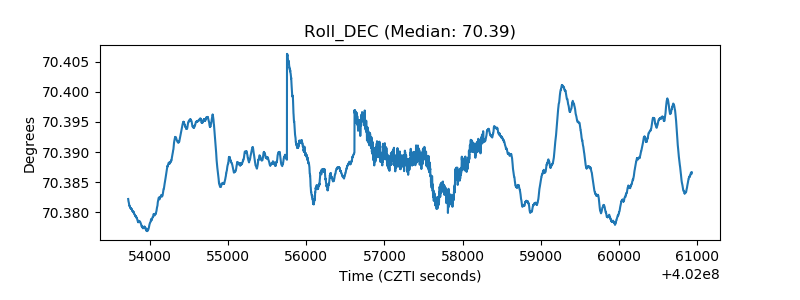 |
| _Roll_RA | 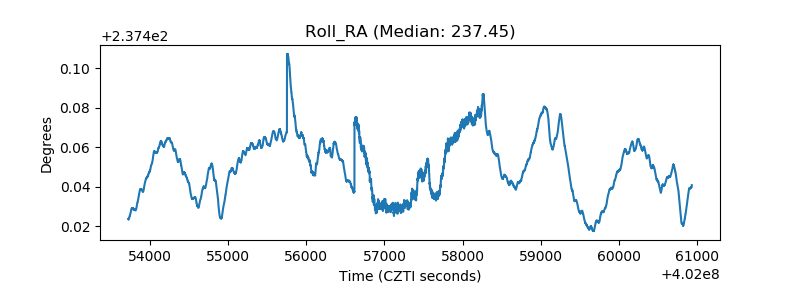 |
| Veto Counter | 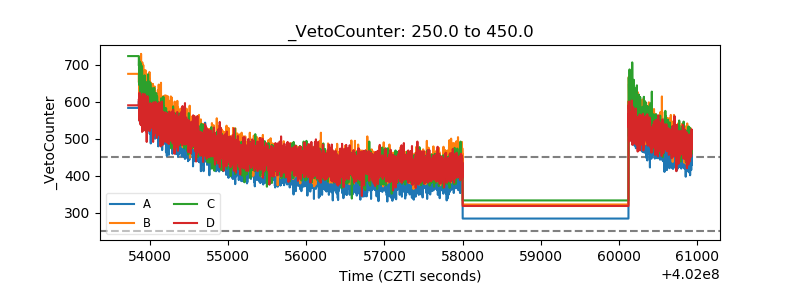 |