| Param | Original file | Final file |
|---|---|---|
| Filename | modeM0/AS1C07_001T12_9000005352_37855cztM0_level2.evt | modeM0/AS1C07_001T12_9000005352_37855cztM0_level2_quad_clean.evt |
| Size (bytes) | 466,122,240 | 79,738,560 |
| Size | 444.5 MB | 76.0 MB |
| Events in quadrant A | 2,738,519 | 546,316 |
| Events in quadrant B | 3,507,811 | 528,951 |
| Events in quadrant C | 2,576,311 | 515,649 |
| Events in quadrant D | 4,958,736 | 476,735 |
| Mode M9 | |||
|---|---|---|---|
| Quadrant | BADHDUFLAG | Total packets | Discarded packets |
| A | 0 | 25 | 0 |
| B | 0 | 25 | 0 |
| C | 0 | 25 | 0 |
| D | 0 | 26 | 0 |
| Mode M0 | |||
|---|---|---|---|
| Quadrant | BADHDUFLAG | Total packets | Discarded packets |
| A | 0 | 11056 | 3 |
| B | 0 | 13595 | 2 |
| C | 0 | 10474 | 2 |
| D | 0 | 18079 | 2 |
| Mode SS | |||
|---|---|---|---|
| Quadrant | BADHDUFLAG | Total packets | Discarded packets |
| A | 0 | 100 | 0 |
| B | 0 | 100 | 0 |
| C | 0 | 100 | 0 |
| D | 0 | 100 | 0 |
| Quadrant | Total seconds | Saturated seconds | Saturation percentage |
|---|---|---|---|
| A | 4948 | 9 | 0.181892% |
| B | 4948 | 242 | 4.890865% |
| C | 4948 | 33 | 0.666936% |
| D | 4948 | 453 | 9.155214% |
Noise dominated data is calculated using 1-second bins in cleaned event files. If a bin has >2000 counts, and if more than 50% of those come from <1% of pixels, then it is considered to be noise-dominated and hence unusable.
| Quadrant | # 1 sec bins | Bins with >0 counts | Bins with >2000 counts | High rate bins dominated by noise | Noise dominated (total time) | Noise dominated (detector-on time) | Marked lightcurve |
|---|---|---|---|---|---|---|---|
| A | 7070 | 4949 | 7 | 7 | 0.10% | 0.14% | 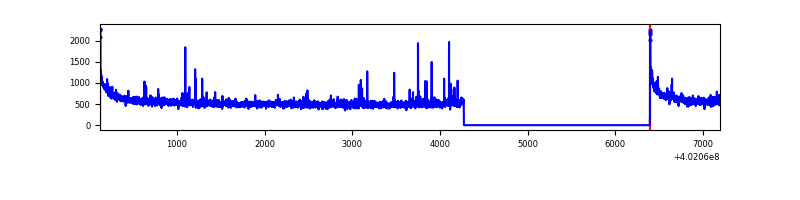 |
| B | 7070 | 4949 | 214 | 214 | 3.03% | 4.32% | 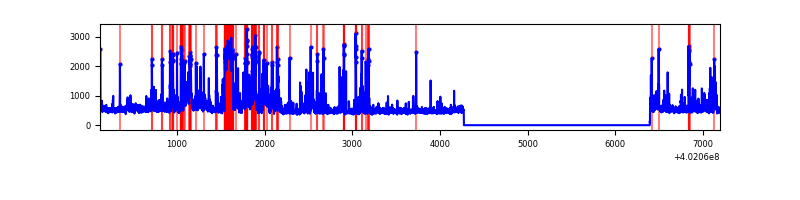 |
| C | 7070 | 4949 | 26 | 26 | 0.37% | 0.53% | 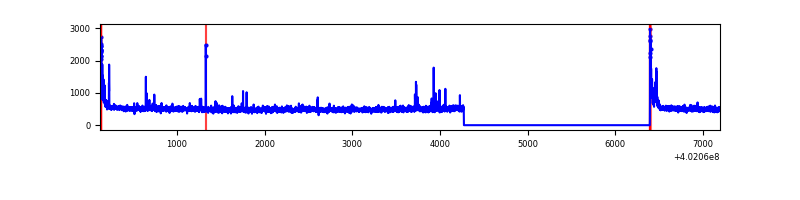 |
| D | 7070 | 4949 | 410 | 410 | 5.80% | 8.28% | 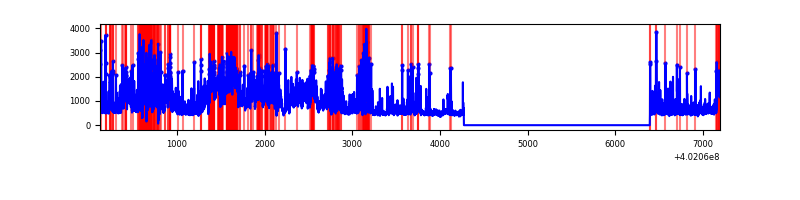 |
Top three noisy pixels from each quadrant. If the there are fewer than three noisy pixels in the level2.evt file, extra rows are filled as -1
| Pixel properties | Quadrant properties | ||||||
|---|---|---|---|---|---|---|---|
| Quadrant | DetID | PixID | Counts | Sigma | Mean | Median | Sigma |
| A | 10 | 83 | 352964 | 3017.64 | 583 | 573 | 116.8 |
| A | 15 | 222 | 53117 | 449.95 | 583 | 573 | 116.8 |
| A | 9 | 143 | 35361 | 297.9 | 583 | 573 | 116.8 |
| B | 5 | 172 | 863340 | 8225.19 | 563 | 549 | 104.9 |
| B | 0 | 229 | 197487 | 1877.46 | 563 | 549 | 104.9 |
| B | 0 | 213 | 80854 | 765.57 | 563 | 549 | 104.9 |
| C | 15 | 214 | 227701 | 1772.74 | 556 | 560 | 128.1 |
| C | 0 | 10 | 128164 | 995.9 | 556 | 560 | 128.1 |
| C | 14 | 254 | 31360 | 240.38 | 556 | 560 | 128.1 |
| D | 1 | 52 | 1049914 | 7952.36 | 551 | 537 | 132.0 |
| D | 13 | 249 | 695946 | 5269.93 | 551 | 537 | 132.0 |
| D | 2 | 250 | 276859 | 2094.02 | 551 | 537 | 132.0 |
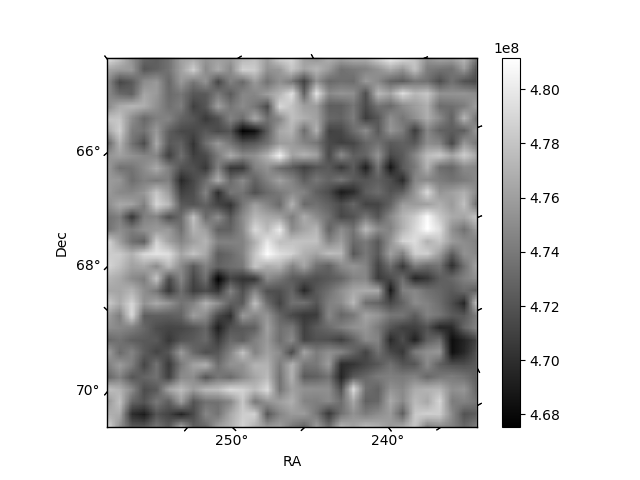
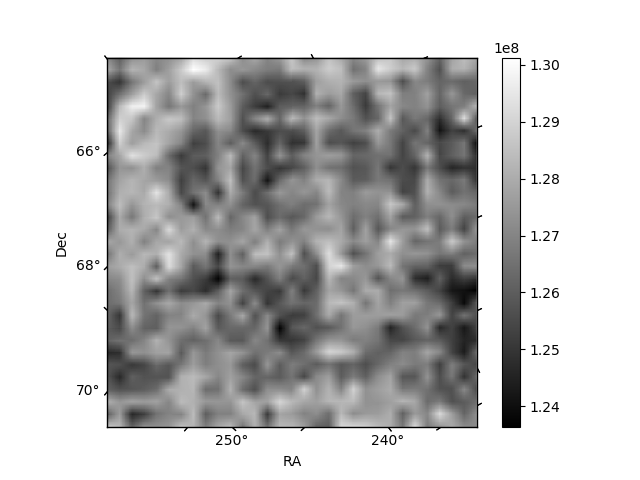
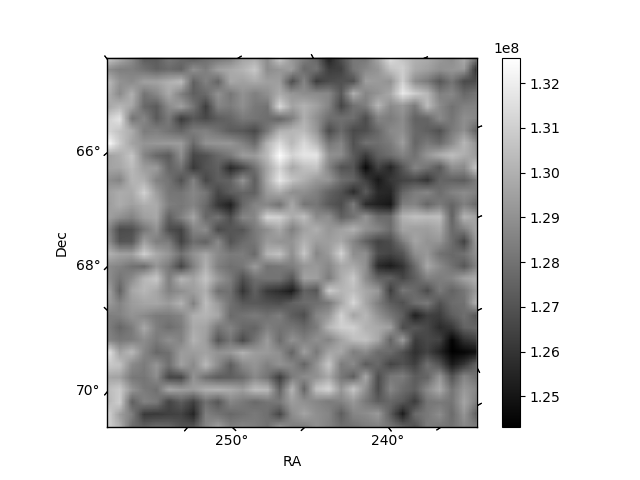
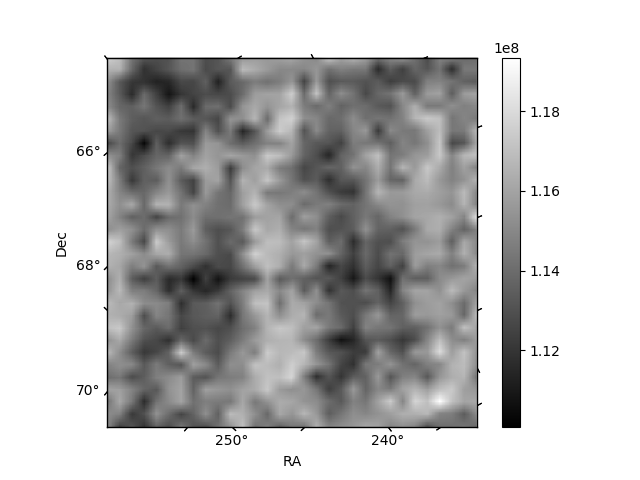
Histogram calculated using DETX and DETY for each event in the final _common_clean file
| Quadrant A | 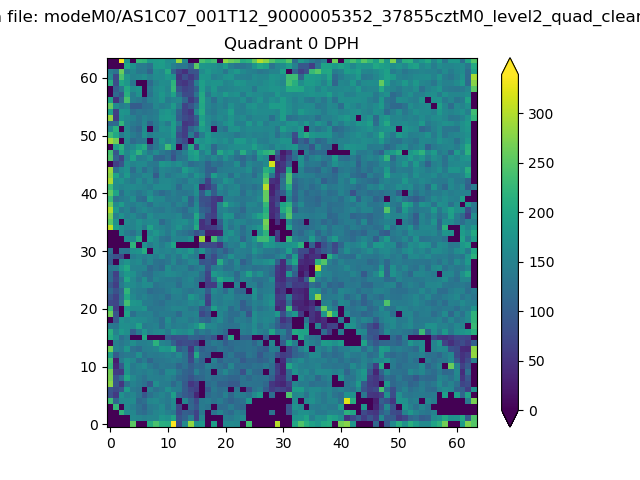 |
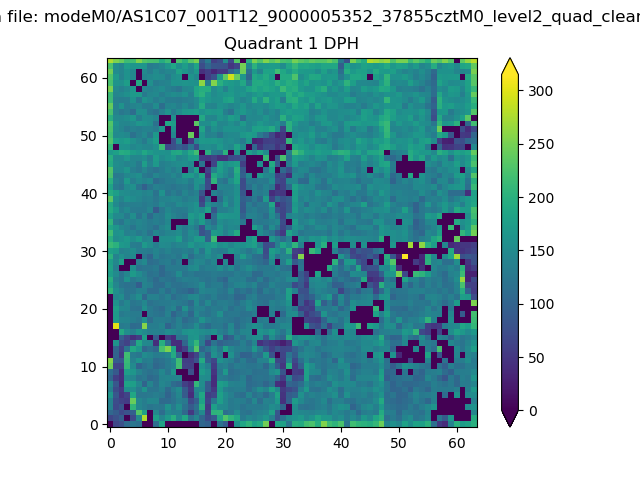 |
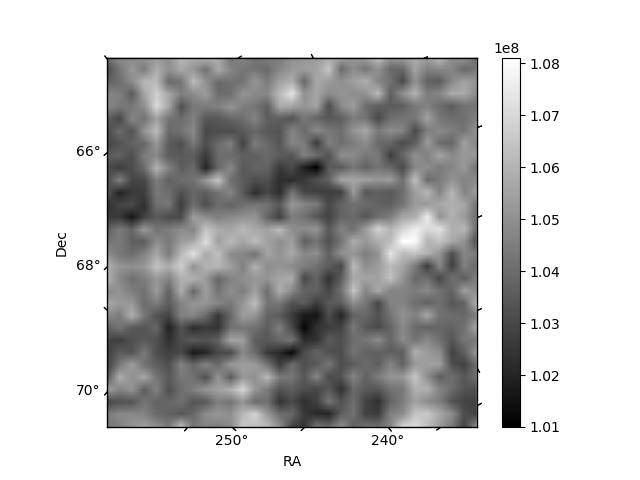
Quadrant B |
|---|---|---|---|
| Quadrant D | 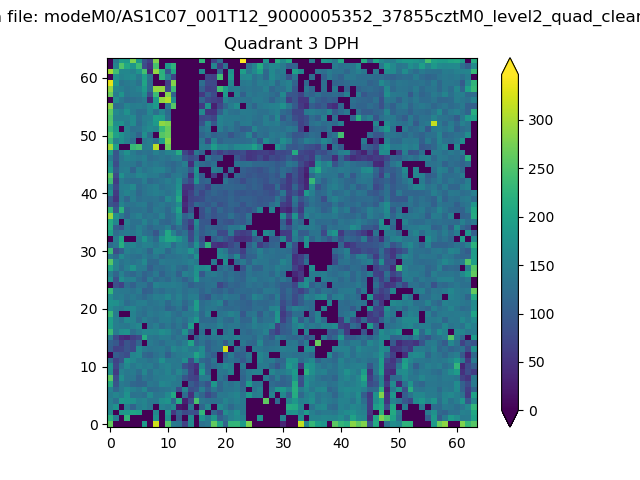 |
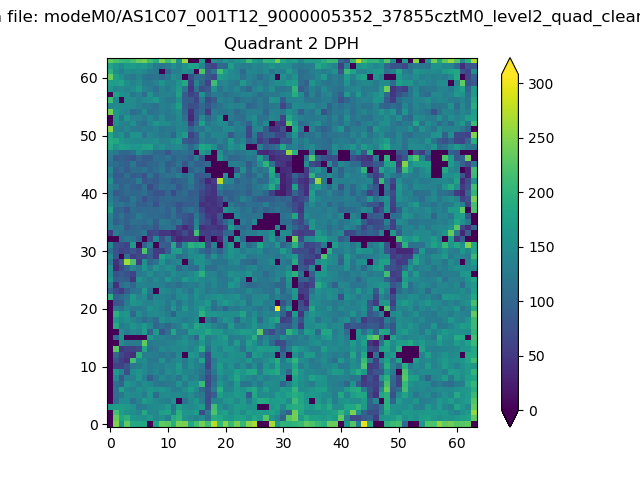 |
Quadrant C |
| Plot type | Count rate plots | Images |
|---|---|---|
| Comparison with Poisson distribution Blue bars denote a histogram of data divided into 1 sec bins. Red curve is a Poisson curve with rate = median count rate of data. |
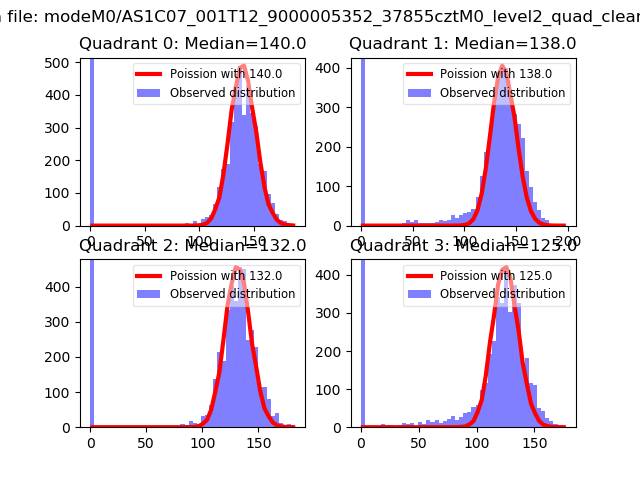 |
 |
| Quadrant-wise count rates Data is divided into 100 sec bins |
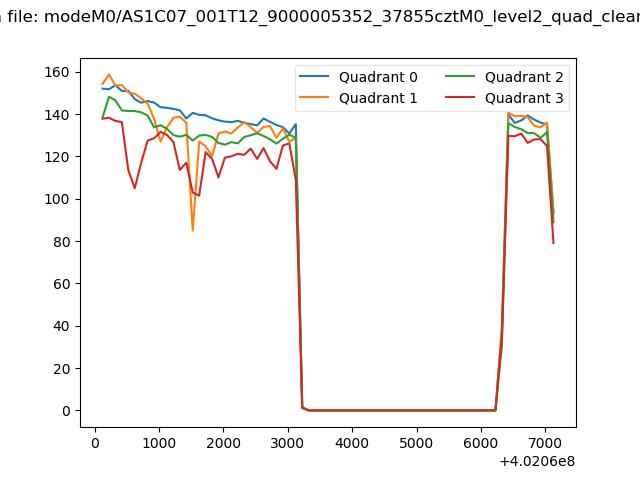 |
|
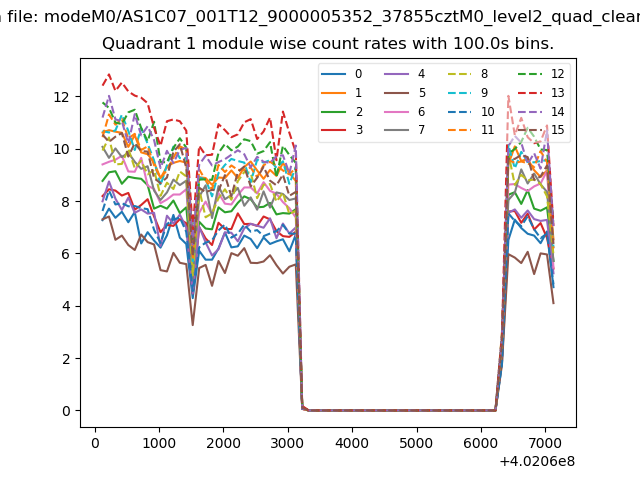
| Module-wise count rates for Quadrant A Data is divided into 100 sec bins |
 |
 |
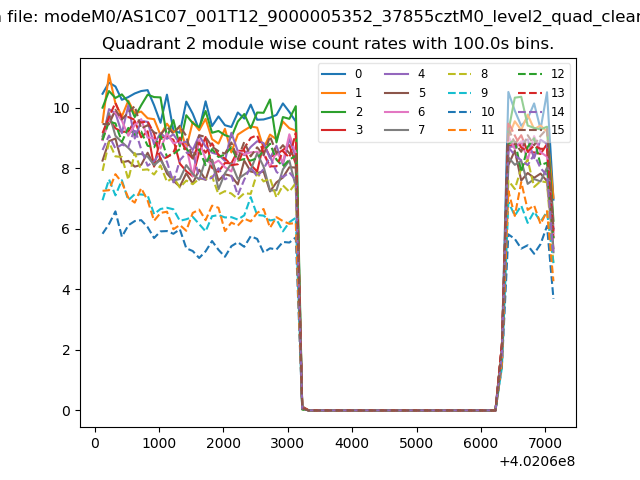
| Module-wise count rates for Quadrant B Data is divided into 100 sec bins |
 |
 |
| Module-wise count rates for Quadrant C Data is divided into 100 sec bins |
 |
 |
| Module-wise count rates for Quadrant D Data is divided into 100 sec bins |
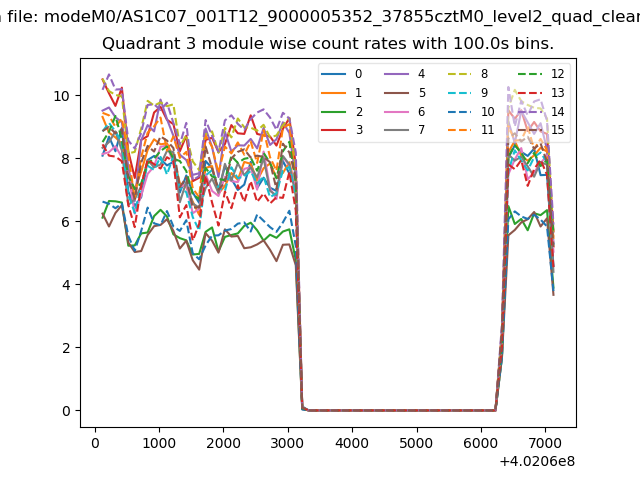 |
 |
| Parameter | Plot |
|---|---|
| CZT HV Monitor | 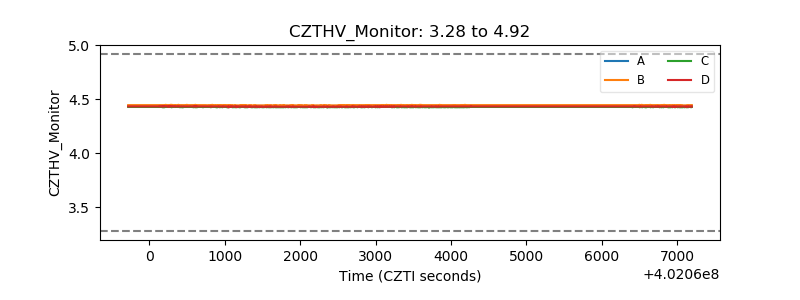 |
| D_VDD | 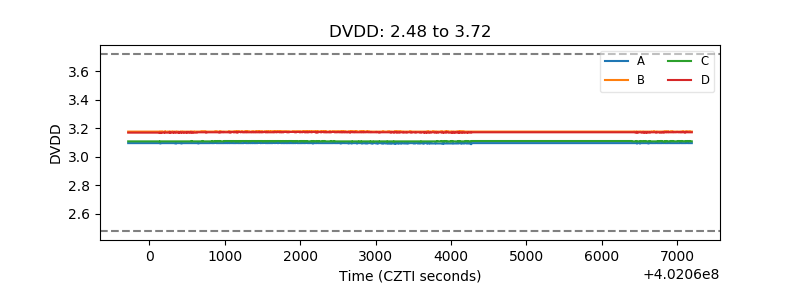 |
| Temperature 1 | 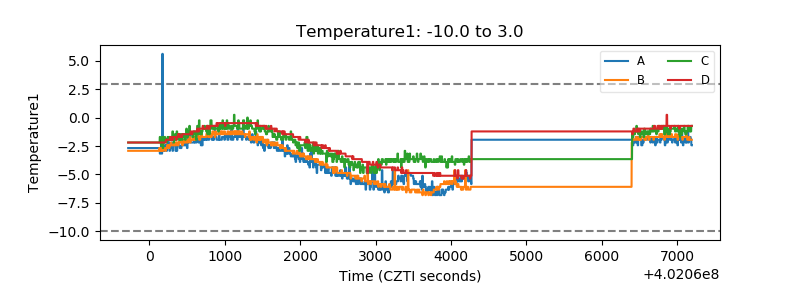 |
| Veto HV Monitor | 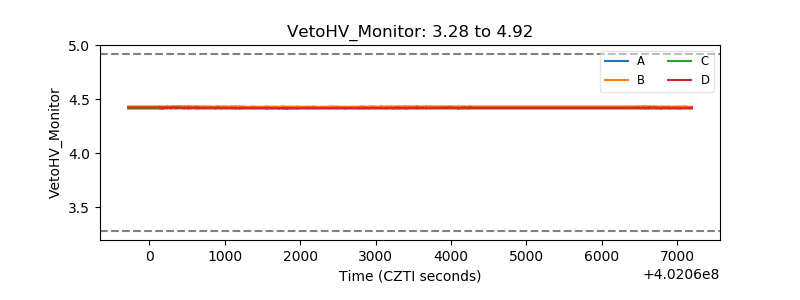 |
| Veto LLD | 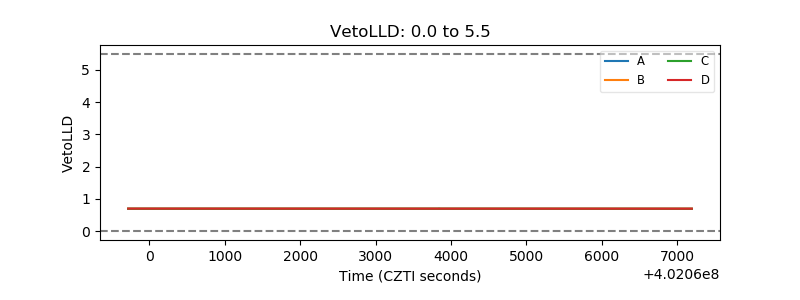 |
| Alpha Counter | 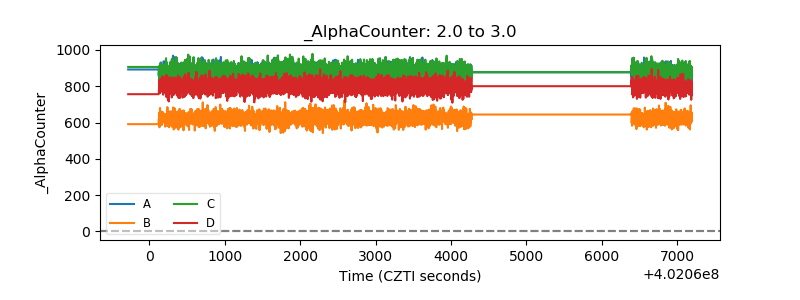 |
| _CPM_Rate | 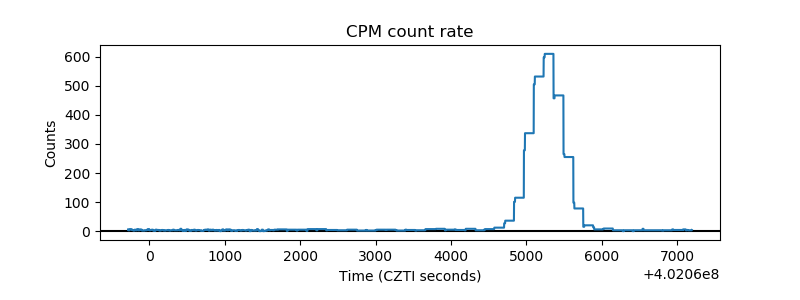 |
| CZT Counter | 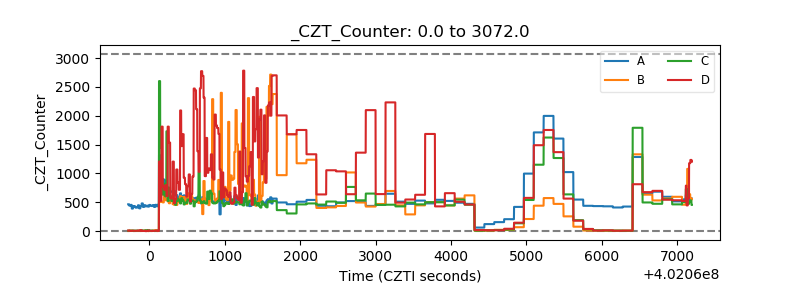 |
| +2.5 Volts monitor | 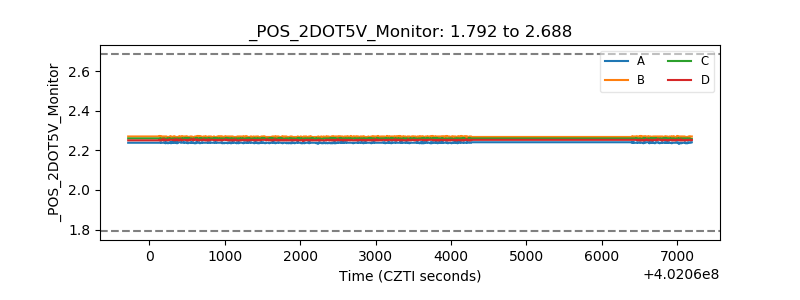 |
| +5 Volts monitor | 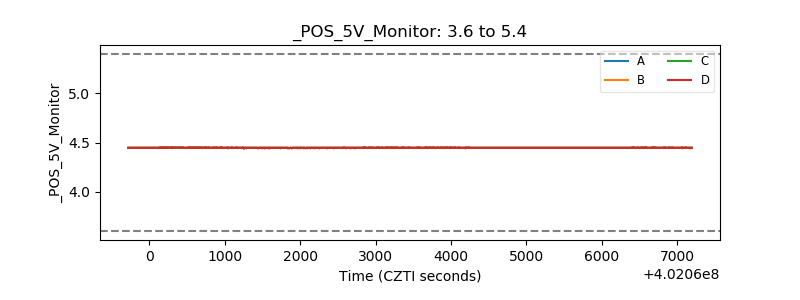 |
| _ROLL_ROT | 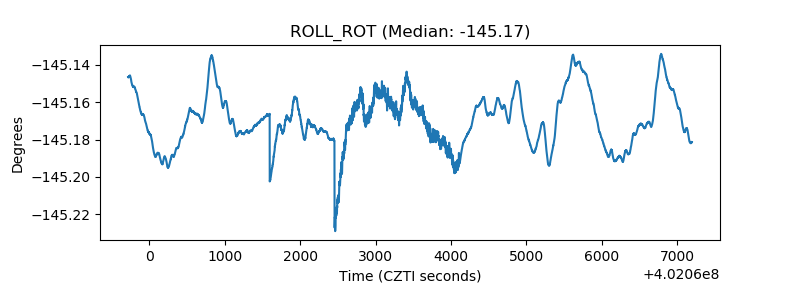 |
| _Roll_DEC | 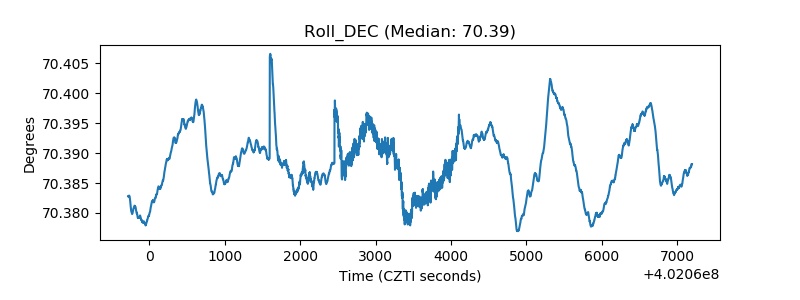 |
| _Roll_RA | 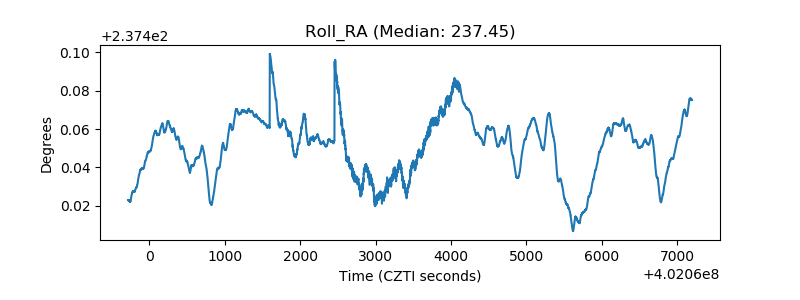 |
| Veto Counter | 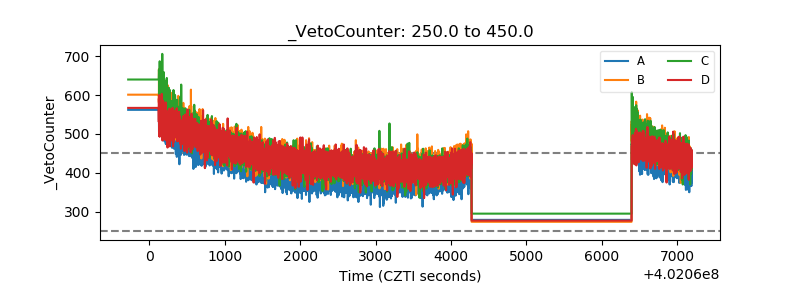 |