| Param | Original file | Final file |
|---|---|---|
| Filename | modeM0/AS1C07_001T12_9000005352_37856cztM0_level2.evt | modeM0/AS1C07_001T12_9000005352_37856cztM0_level2_quad_clean.evt |
| Size (bytes) | 423,792,000 | 77,866,560 |
| Size | 404.2 MB | 74.3 MB |
| Events in quadrant A | 2,766,474 | 518,718 |
| Events in quadrant B | 2,866,479 | 513,652 |
| Events in quadrant C | 2,710,760 | 495,809 |
| Events in quadrant D | 4,135,905 | 463,714 |
| Mode M9 | |||
|---|---|---|---|
| Quadrant | BADHDUFLAG | Total packets | Discarded packets |
| A | 0 | 27 | 0 |
| B | 0 | 27 | 0 |
| C | 0 | 27 | 0 |
| D | 0 | 28 | 0 |
| Mode M0 | |||
|---|---|---|---|
| Quadrant | BADHDUFLAG | Total packets | Discarded packets |
| A | 0 | 11381 | 3 |
| B | 0 | 11947 | 2 |
| C | 0 | 11173 | 2 |
| D | 0 | 15797 | 2 |
| Mode SS | |||
|---|---|---|---|
| Quadrant | BADHDUFLAG | Total packets | Discarded packets |
| A | 0 | 108 | 0 |
| B | 0 | 108 | 0 |
| C | 0 | 108 | 0 |
| D | 0 | 108 | 0 |
| Quadrant | Total seconds | Saturated seconds | Saturation percentage |
|---|---|---|---|
| A | 5217 | 13 | 0.249185% |
| B | 5217 | 76 | 1.456776% |
| C | 5217 | 31 | 0.594211% |
| D | 5217 | 437 | 8.376462% |
Noise dominated data is calculated using 1-second bins in cleaned event files. If a bin has >2000 counts, and if more than 50% of those come from <1% of pixels, then it is considered to be noise-dominated and hence unusable.
| Quadrant | # 1 sec bins | Bins with >0 counts | Bins with >2000 counts | High rate bins dominated by noise | Noise dominated (total time) | Noise dominated (detector-on time) | Marked lightcurve |
|---|---|---|---|---|---|---|---|
| A | 7250 | 5218 | 8 | 8 | 0.11% | 0.15% | 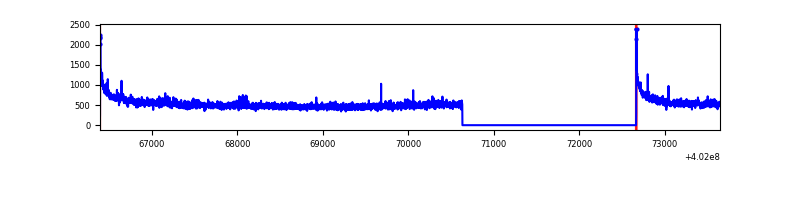 |
| B | 7250 | 5218 | 46 | 46 | 0.63% | 0.88% | 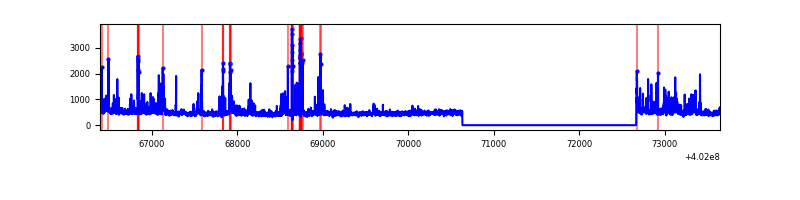 |
| C | 7250 | 5218 | 28 | 28 | 0.39% | 0.54% | 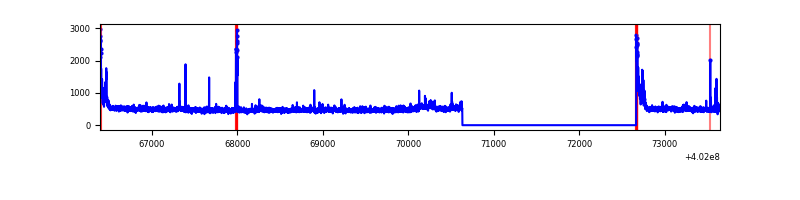 |
| D | 7250 | 5218 | 328 | 328 | 4.52% | 6.29% | 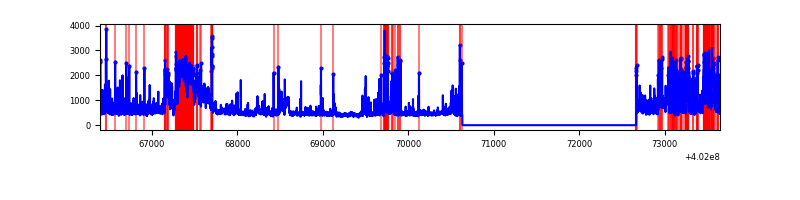 |
Top three noisy pixels from each quadrant. If the there are fewer than three noisy pixels in the level2.evt file, extra rows are filled as -1
| Pixel properties | Quadrant properties | ||||||
|---|---|---|---|---|---|---|---|
| Quadrant | DetID | PixID | Counts | Sigma | Mean | Median | Sigma |
| A | 10 | 83 | 361590 | 3033.2 | 587 | 576 | 119.0 |
| A | 15 | 222 | 103221 | 862.41 | 587 | 576 | 119.0 |
| A | 9 | 143 | 12231 | 97.92 | 587 | 576 | 119.0 |
| B | 5 | 172 | 239965 | 2196.42 | 578 | 564 | 109.0 |
| B | 0 | 229 | 211218 | 1932.68 | 578 | 564 | 109.0 |
| B | 0 | 230 | 57576 | 523.07 | 578 | 564 | 109.0 |
| C | 15 | 214 | 231270 | 1744.28 | 569 | 572 | 132.3 |
| C | 0 | 10 | 144333 | 1086.96 | 569 | 572 | 132.3 |
| C | 14 | 67 | 42704 | 318.55 | 569 | 572 | 132.3 |
| D | 2 | 249 | 714532 | 5287.7 | 558 | 543 | 135.0 |
| D | 13 | 249 | 685157 | 5070.15 | 558 | 543 | 135.0 |
| D | 10 | 199 | 206495 | 1525.25 | 558 | 543 | 135.0 |
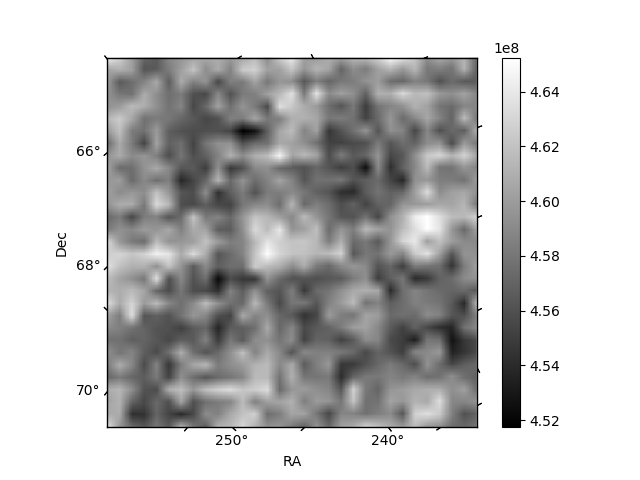
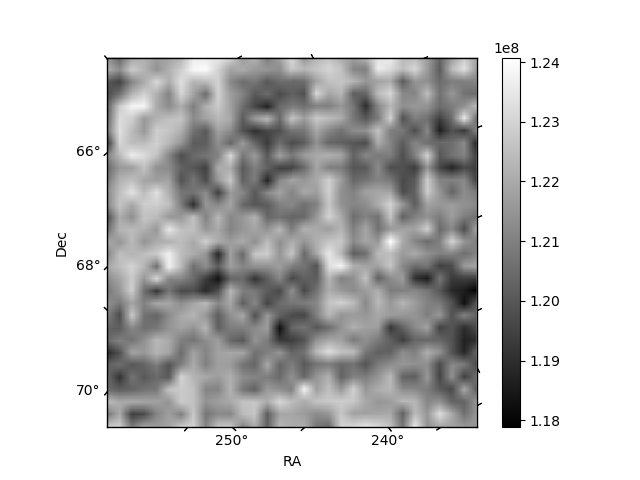
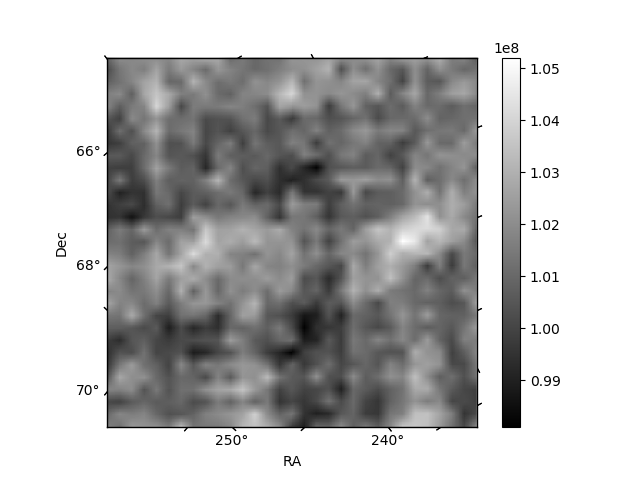
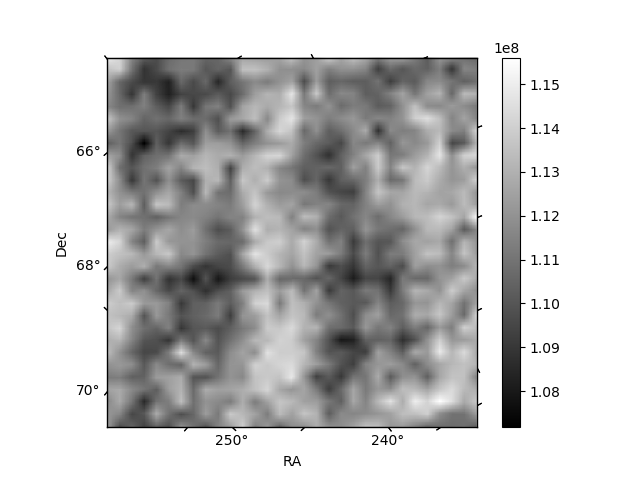
Histogram calculated using DETX and DETY for each event in the final _common_clean file
| Quadrant A | 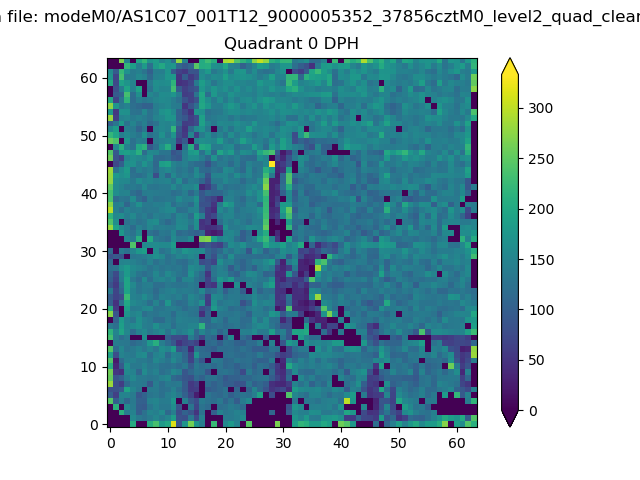 |
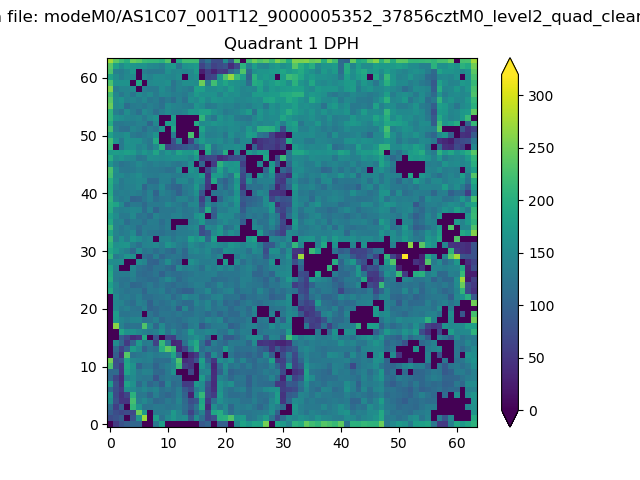 |
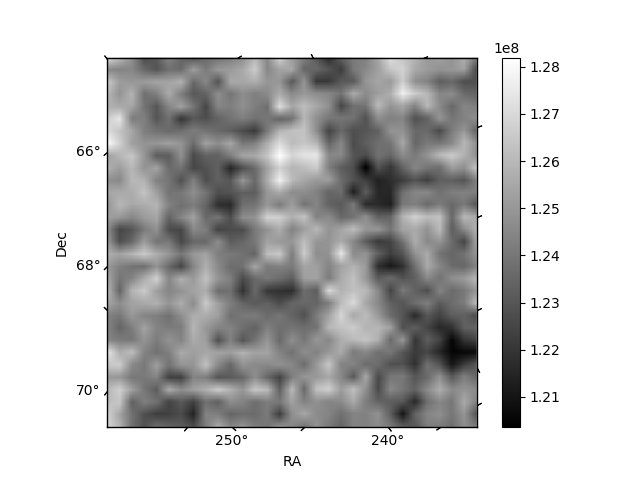
Quadrant B |
|---|---|---|---|
| Quadrant D | 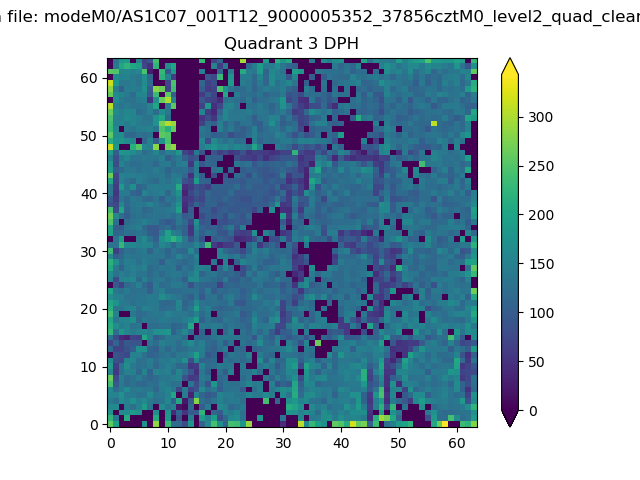 |
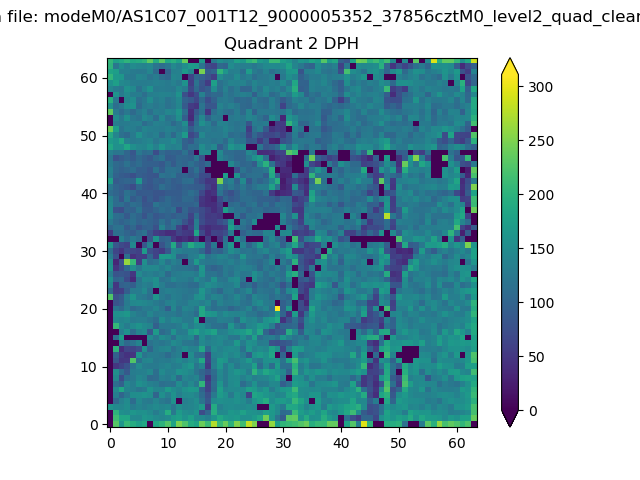 |
Quadrant C |
| Plot type | Count rate plots | Images |
|---|---|---|
| Comparison with Poisson distribution Blue bars denote a histogram of data divided into 1 sec bins. Red curve is a Poisson curve with rate = median count rate of data. |
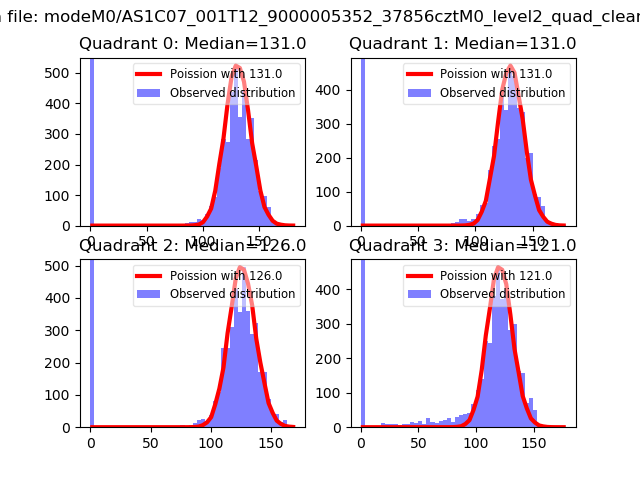 |
 |
| Quadrant-wise count rates Data is divided into 100 sec bins |
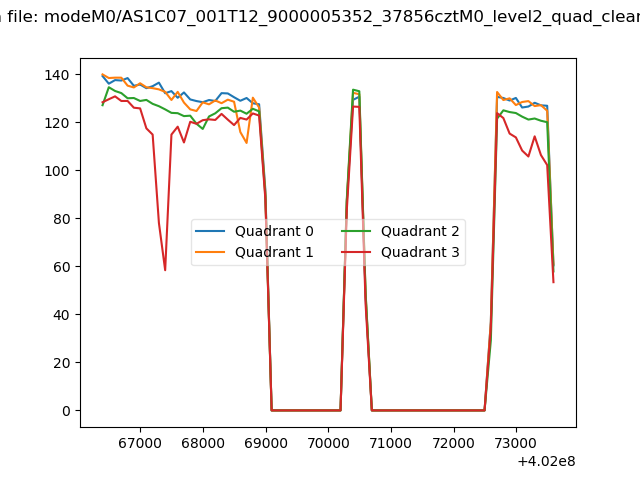 |
|
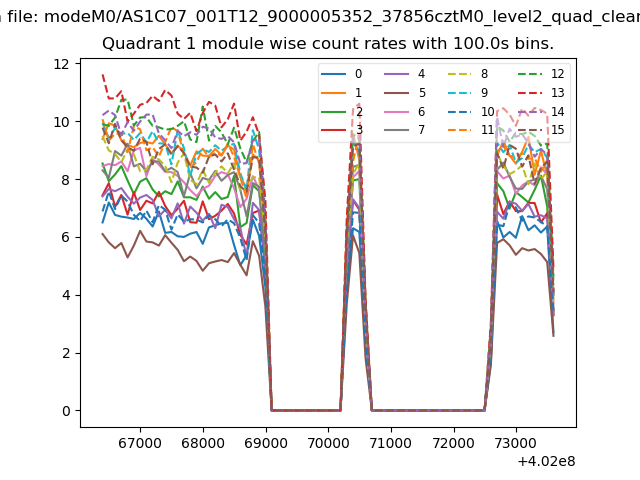
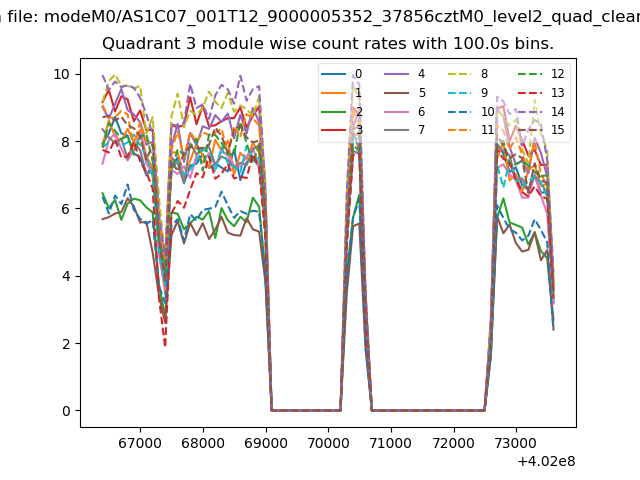
| Module-wise count rates for Quadrant A Data is divided into 100 sec bins |
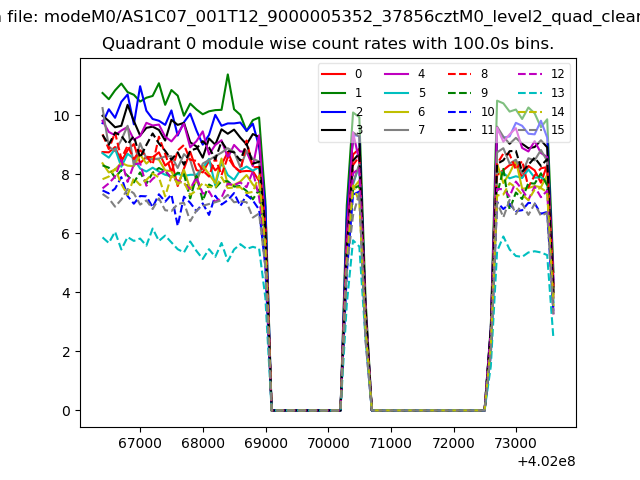 |
 |
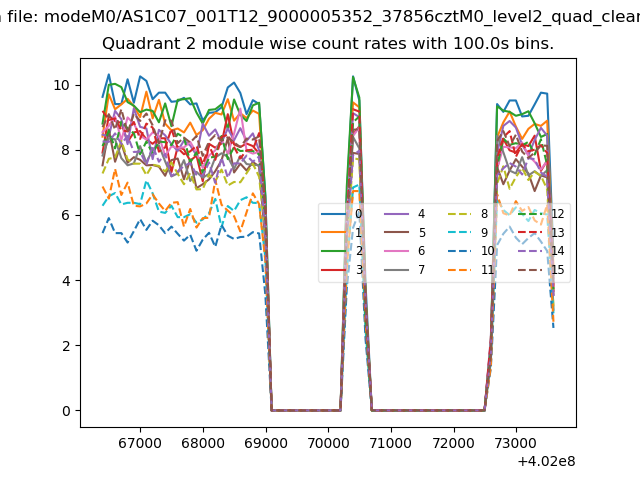
| Module-wise count rates for Quadrant B Data is divided into 100 sec bins |
 |
 |
| Module-wise count rates for Quadrant C Data is divided into 100 sec bins |
 |
 |
| Module-wise count rates for Quadrant D Data is divided into 100 sec bins |
 |
 |
| Parameter | Plot |
|---|---|
| CZT HV Monitor | 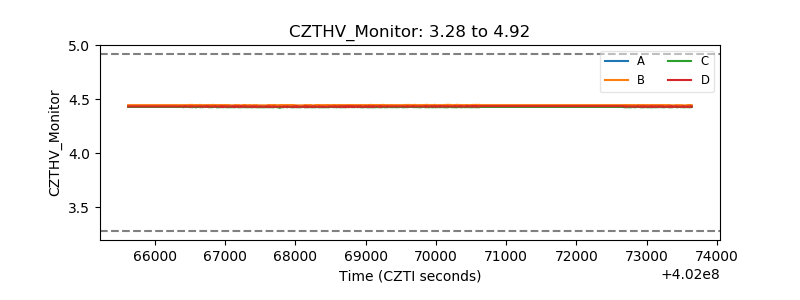 |
| D_VDD | 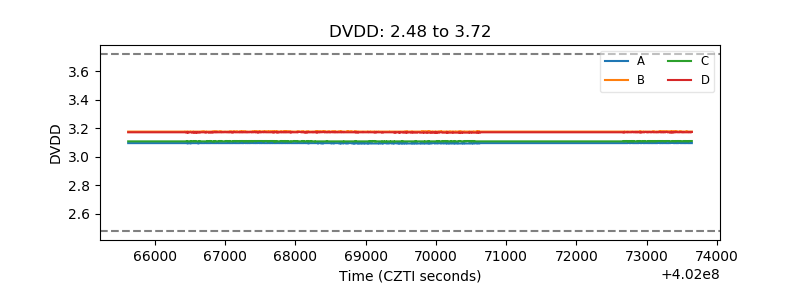 |
| Temperature 1 | 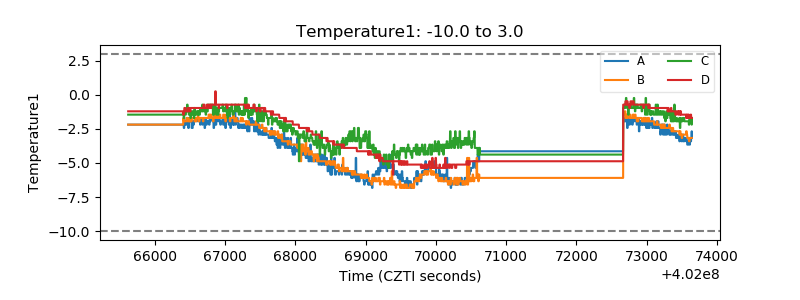 |
| Veto HV Monitor | 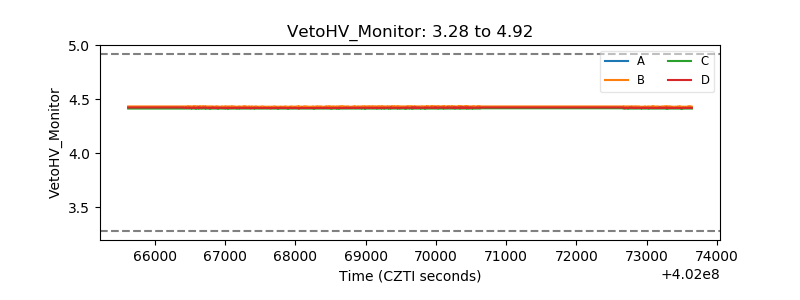 |
| Veto LLD | 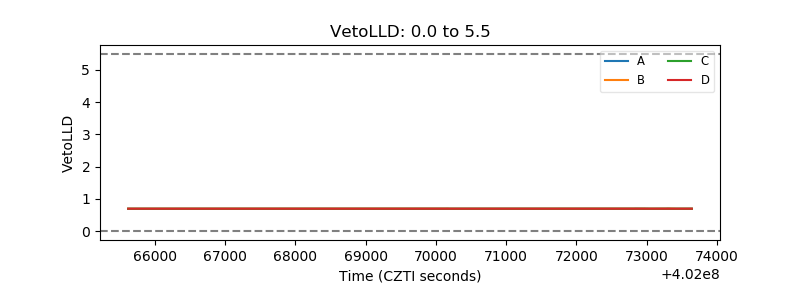 |
| Alpha Counter | 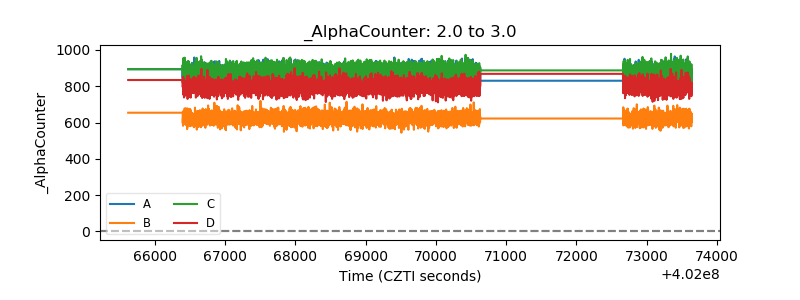 |
| _CPM_Rate | 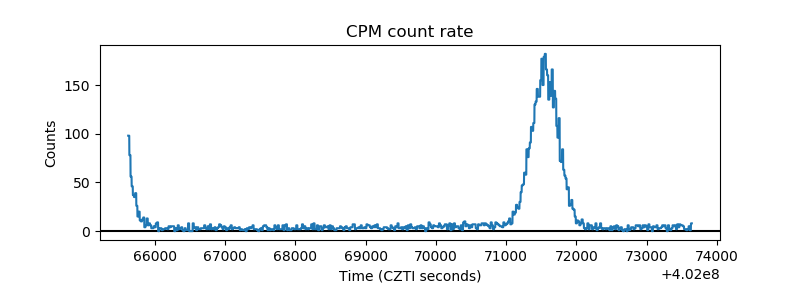 |
| CZT Counter | 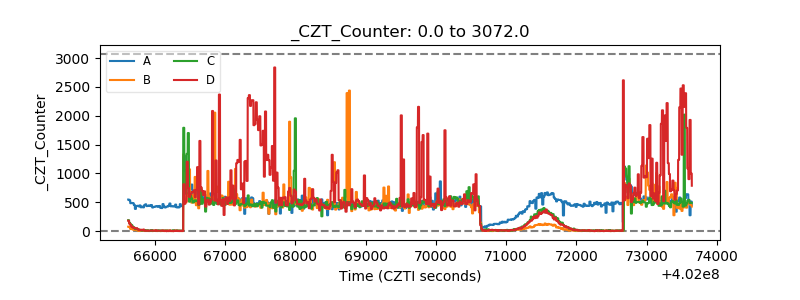 |
| +2.5 Volts monitor | 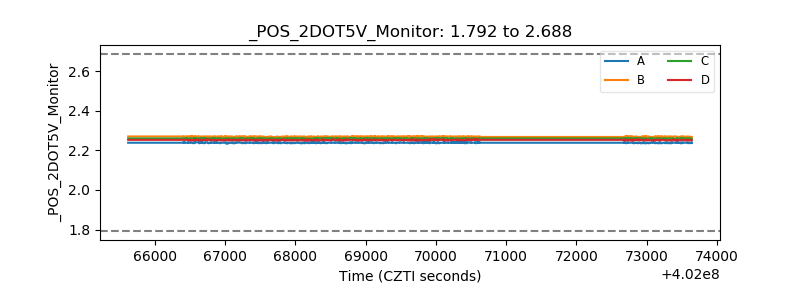 |
| +5 Volts monitor | 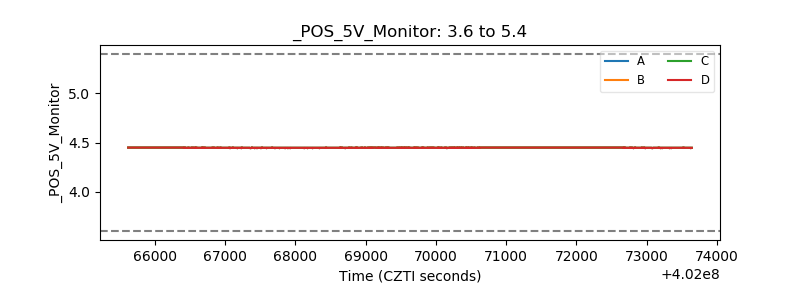 |
| _ROLL_ROT | 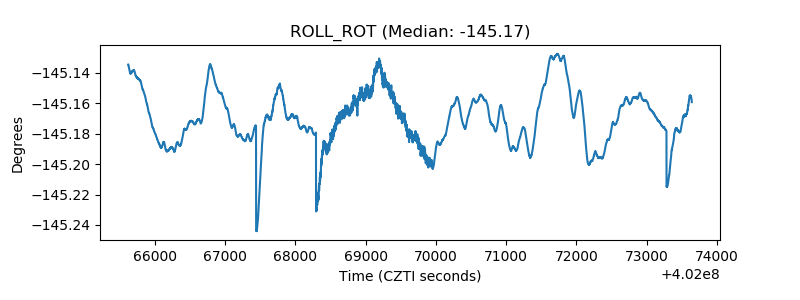 |
| _Roll_DEC | 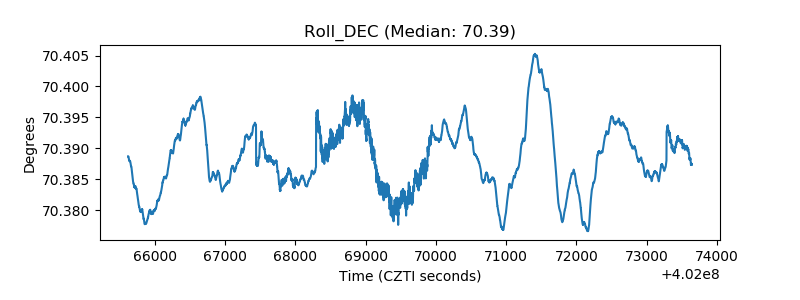 |
| _Roll_RA | 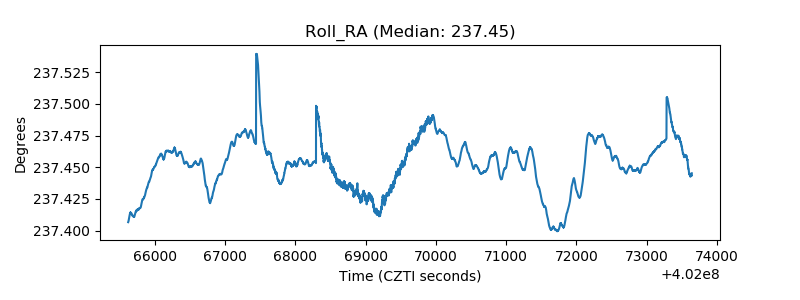 |
| Veto Counter | 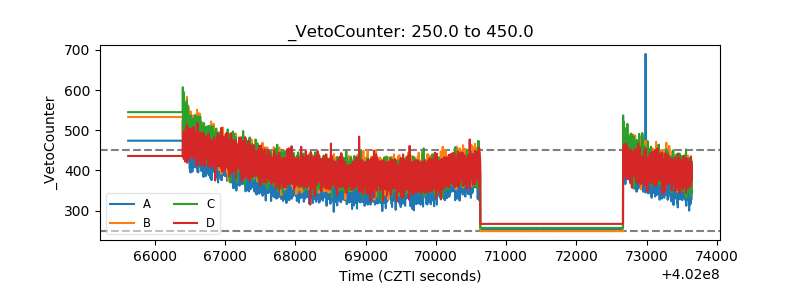 |