| Param | Original file | Final file |
|---|---|---|
| Filename | modeM0/AS1C07_001T12_9000005352_37857cztM0_level2.evt | modeM0/AS1C07_001T12_9000005352_37857cztM0_level2_quad_clean.evt |
| Size (bytes) | 454,521,600 | 80,035,200 |
| Size | 433.5 MB | 76.3 MB |
| Events in quadrant A | 2,786,575 | 528,906 |
| Events in quadrant B | 3,087,147 | 525,145 |
| Events in quadrant C | 2,825,196 | 512,609 |
| Events in quadrant D | 4,693,689 | 472,760 |
| Mode M9 | |||
|---|---|---|---|
| Quadrant | BADHDUFLAG | Total packets | Discarded packets |
| A | 0 | 18 | 0 |
| B | 0 | 18 | 0 |
| C | 0 | 18 | 0 |
| D | 0 | 18 | 0 |
| Mode M0 | |||
|---|---|---|---|
| Quadrant | BADHDUFLAG | Total packets | Discarded packets |
| A | 0 | 11732 | 3 |
| B | 0 | 12878 | 2 |
| C | 0 | 11706 | 2 |
| D | 0 | 17690 | 2 |
| Mode SS | |||
|---|---|---|---|
| Quadrant | BADHDUFLAG | Total packets | Discarded packets |
| A | 0 | 110 | 0 |
| B | 0 | 110 | 0 |
| C | 0 | 110 | 0 |
| D | 0 | 110 | 0 |
| Quadrant | Total seconds | Saturated seconds | Saturation percentage |
|---|---|---|---|
| A | 5491 | 15 | 0.273174% |
| B | 5491 | 121 | 2.203606% |
| C | 5491 | 51 | 0.928793% |
| D | 5491 | 529 | 9.633946% |
Noise dominated data is calculated using 1-second bins in cleaned event files. If a bin has >2000 counts, and if more than 50% of those come from <1% of pixels, then it is considered to be noise-dominated and hence unusable.
| Quadrant | # 1 sec bins | Bins with >0 counts | Bins with >2000 counts | High rate bins dominated by noise | Noise dominated (total time) | Noise dominated (detector-on time) | Marked lightcurve |
|---|---|---|---|---|---|---|---|
| A | 7224 | 5492 | 6 | 6 | 0.08% | 0.11% | 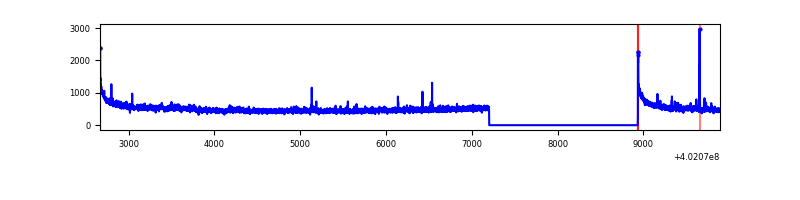 |
| B | 7224 | 5492 | 75 | 75 | 1.04% | 1.37% | 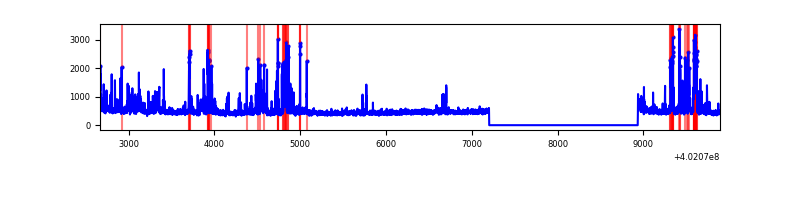 |
| C | 7224 | 5492 | 49 | 49 | 0.68% | 0.89% | 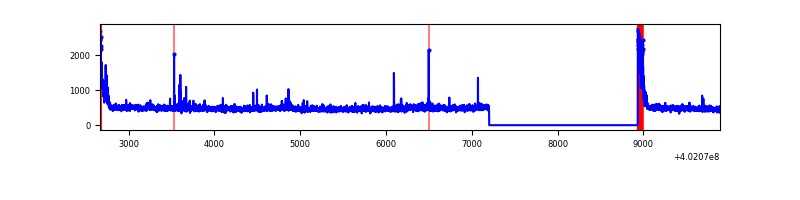 |
| D | 7224 | 5492 | 438 | 438 | 6.06% | 7.98% | 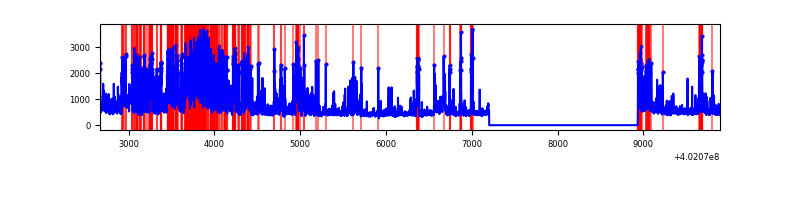 |
Top three noisy pixels from each quadrant. If the there are fewer than three noisy pixels in the level2.evt file, extra rows are filled as -1
| Pixel properties | Quadrant properties | ||||||
|---|---|---|---|---|---|---|---|
| Quadrant | DetID | PixID | Counts | Sigma | Mean | Median | Sigma |
| A | 10 | 83 | 366671 | 3059.7 | 602 | 590 | 119.6 |
| A | 15 | 222 | 39071 | 321.62 | 602 | 590 | 119.6 |
| A | 13 | 6 | 19747 | 160.11 | 602 | 590 | 119.6 |
| B | 5 | 172 | 368636 | 3256.33 | 595 | 580 | 113.0 |
| B | 0 | 229 | 170430 | 1502.72 | 595 | 580 | 113.0 |
| B | 4 | 171 | 41305 | 360.31 | 595 | 580 | 113.0 |
| C | 15 | 214 | 230493 | 1689.8 | 585 | 587 | 136.1 |
| C | 0 | 10 | 196710 | 1441.49 | 585 | 587 | 136.1 |
| C | 14 | 67 | 63411 | 461.75 | 585 | 587 | 136.1 |
| D | 2 | 249 | 1949770 | 14033.91 | 570 | 553 | 138.9 |
| D | 1 | 52 | 154577 | 1108.94 | 570 | 553 | 138.9 |
| D | 2 | 250 | 125467 | 899.35 | 570 | 553 | 138.9 |
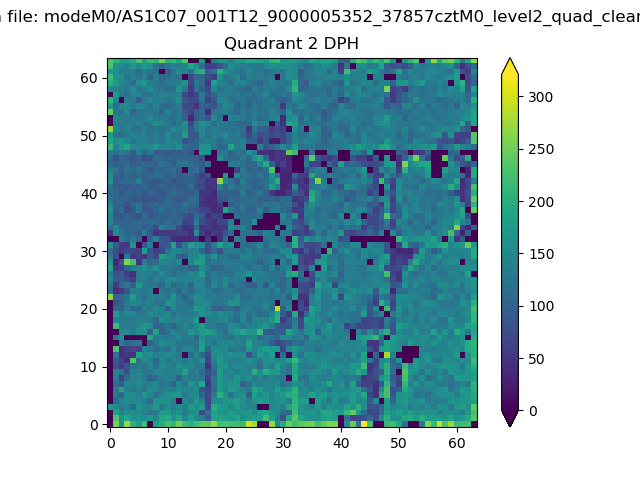
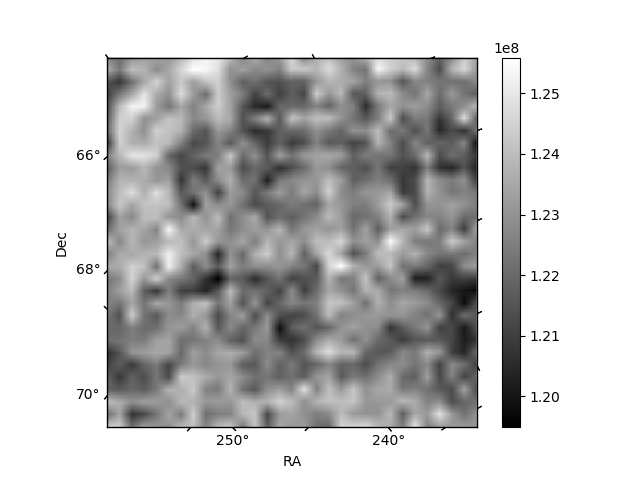
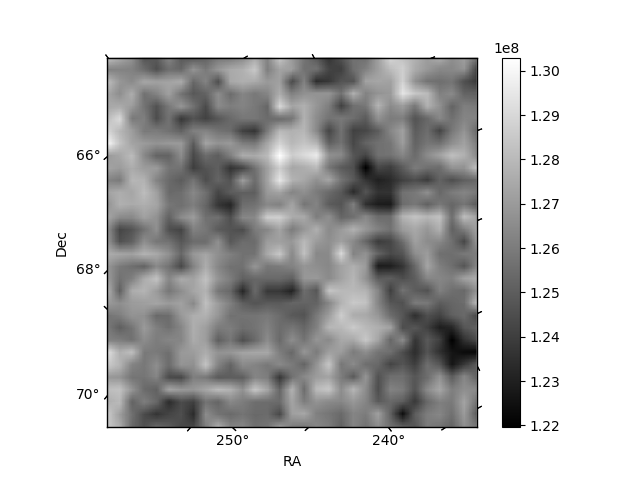
Histogram calculated using DETX and DETY for each event in the final _common_clean file
| Quadrant A | 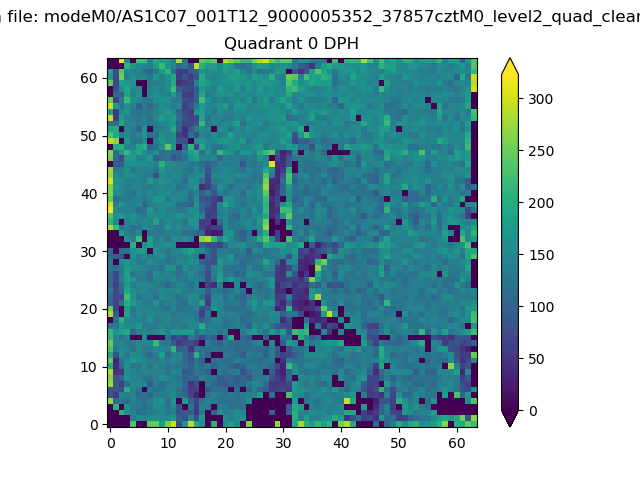 |
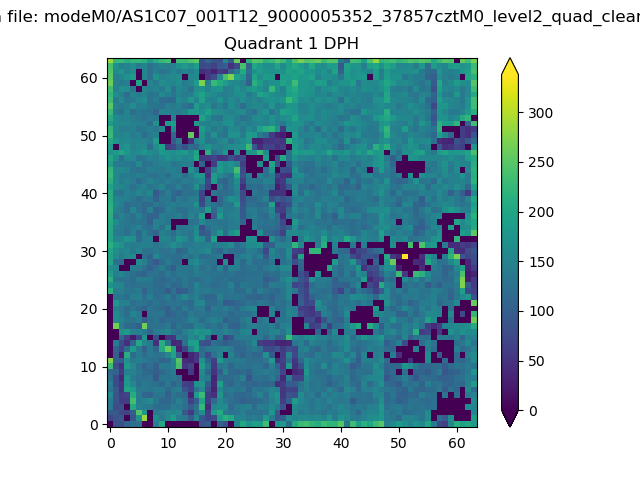 |
Quadrant B |
|---|---|---|---|
| Quadrant D | 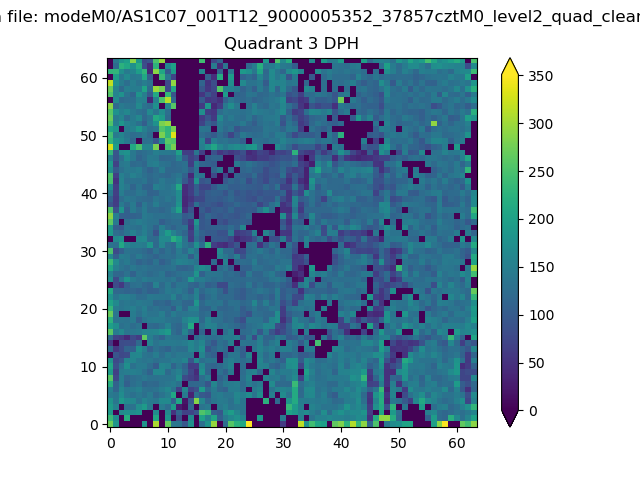 |
 |
Quadrant C |
| Plot type | Count rate plots | Images |
|---|---|---|
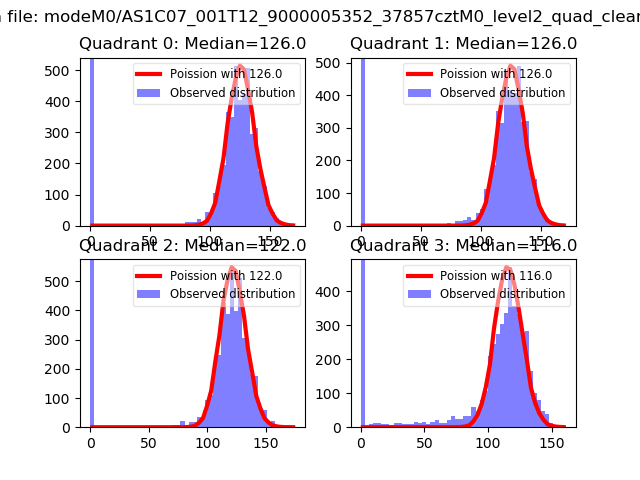
| Comparison with Poisson distribution Blue bars denote a histogram of data divided into 1 sec bins. Red curve is a Poisson curve with rate = median count rate of data. |
 |
 |
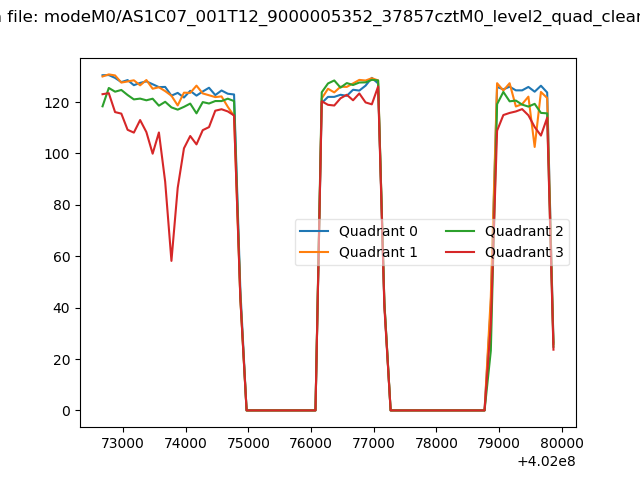
| Quadrant-wise count rates Data is divided into 100 sec bins |
 |
|
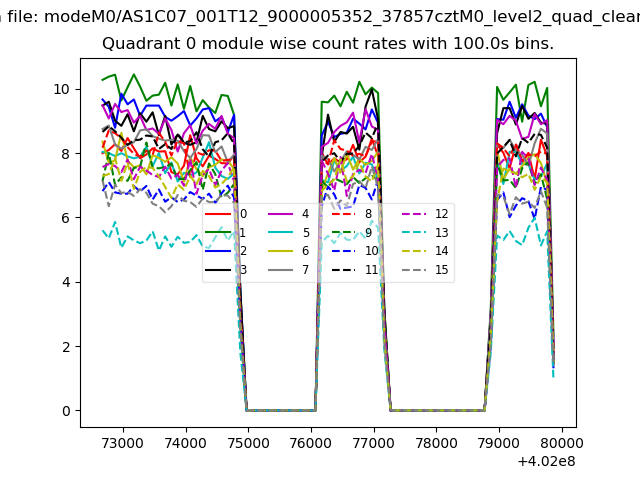
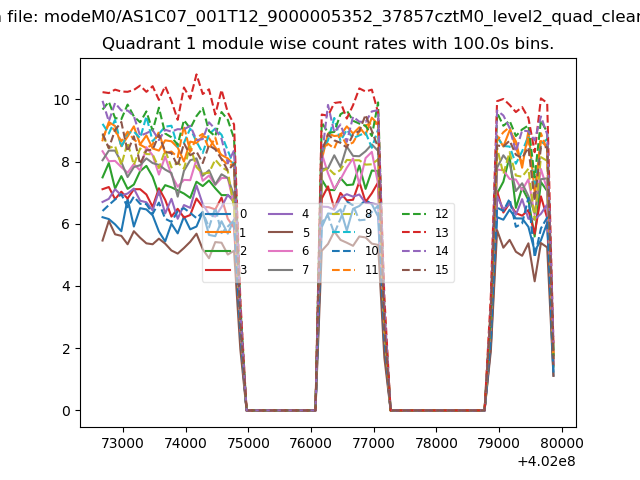
| Module-wise count rates for Quadrant A Data is divided into 100 sec bins |
 |
 |
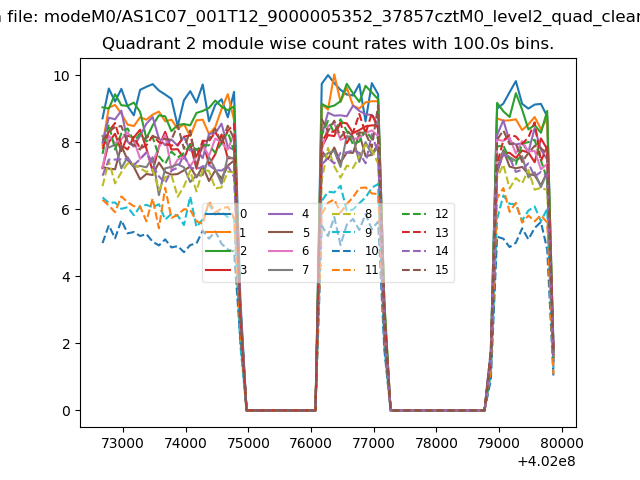
| Module-wise count rates for Quadrant B Data is divided into 100 sec bins |
 |
 |
| Module-wise count rates for Quadrant C Data is divided into 100 sec bins |
 |
 |
| Module-wise count rates for Quadrant D Data is divided into 100 sec bins |
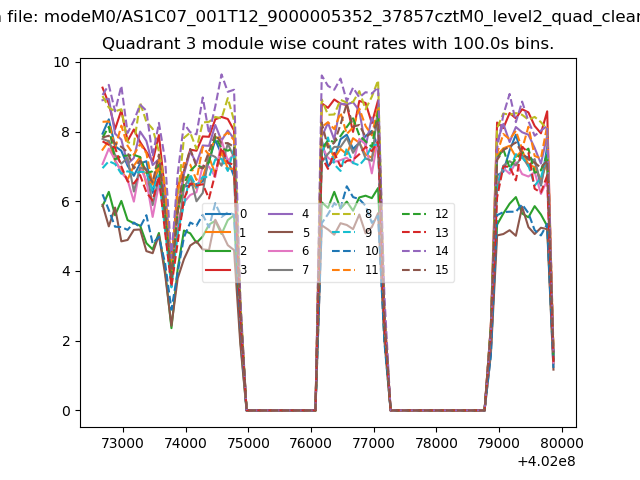 |
 |
| Parameter | Plot |
|---|---|
| CZT HV Monitor | 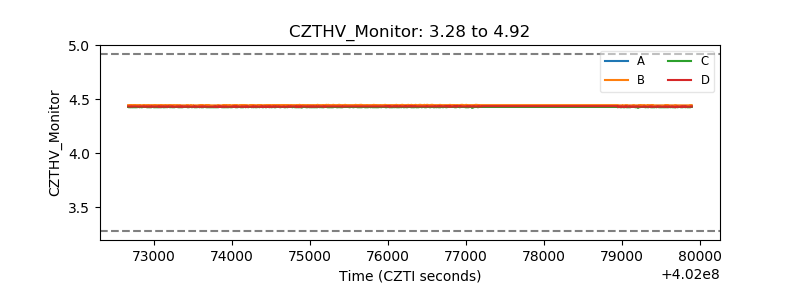 |
| D_VDD | 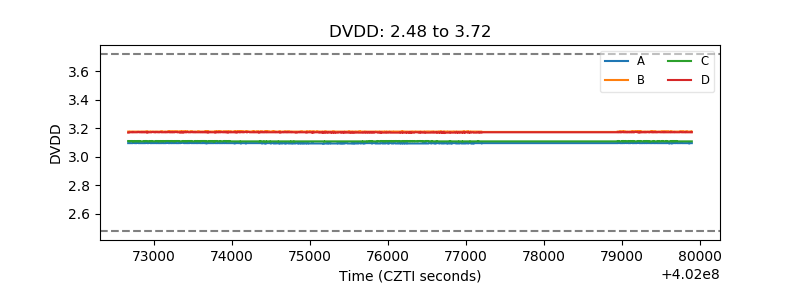 |
| Temperature 1 | 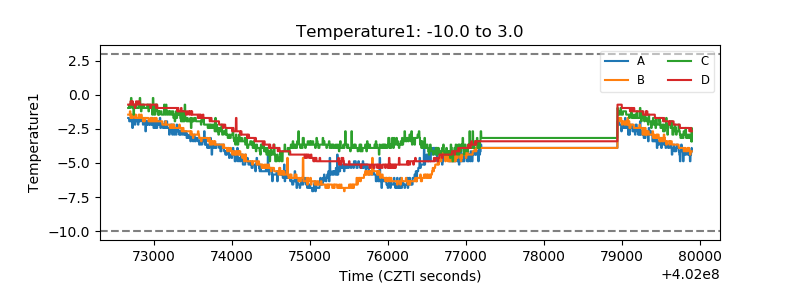 |
| Veto HV Monitor | 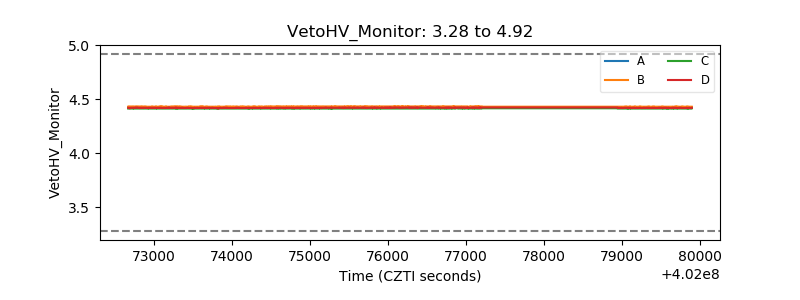 |
| Veto LLD | 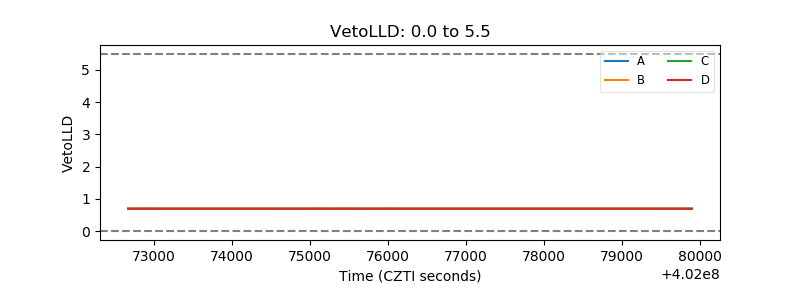 |
| Alpha Counter | 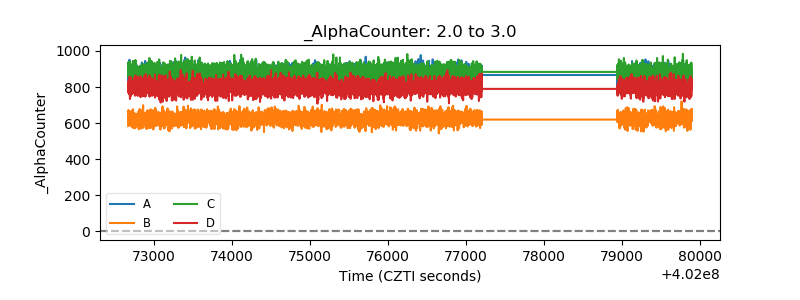 |
| _CPM_Rate | 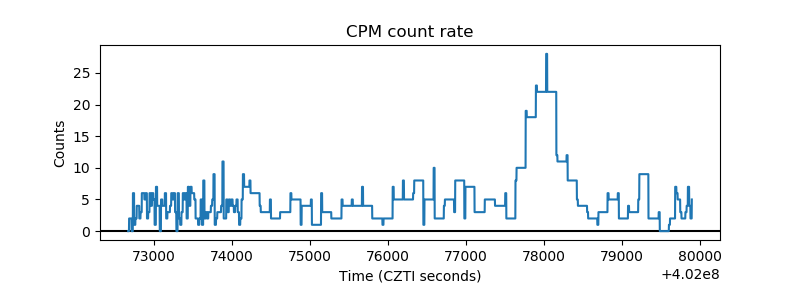 |
| CZT Counter | 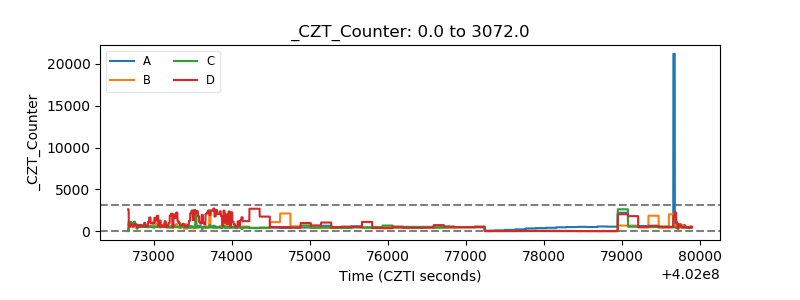 |
| +2.5 Volts monitor | 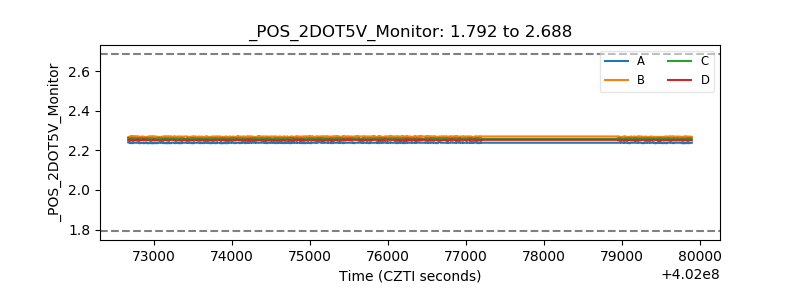 |
| +5 Volts monitor | 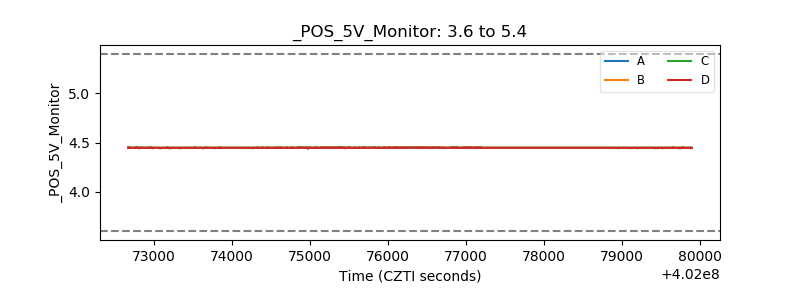 |
| _ROLL_ROT | 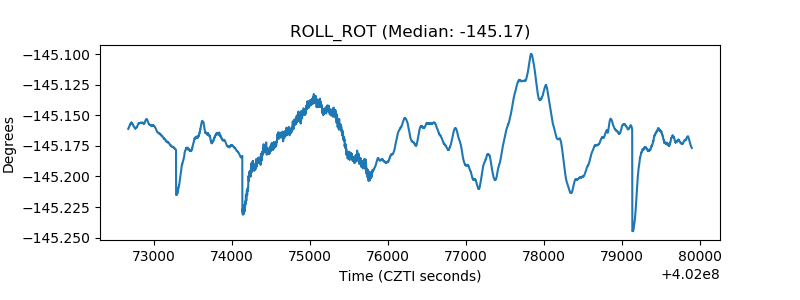 |
| _Roll_DEC | 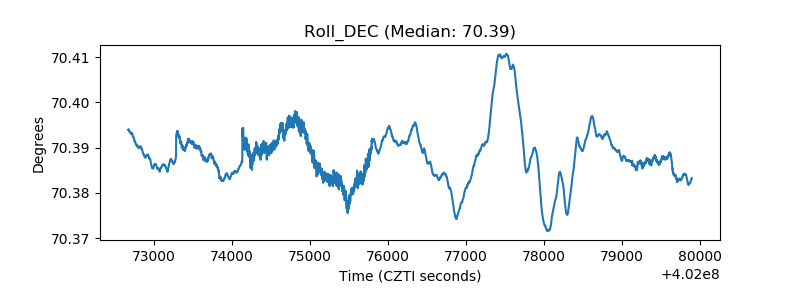 |
| _Roll_RA | 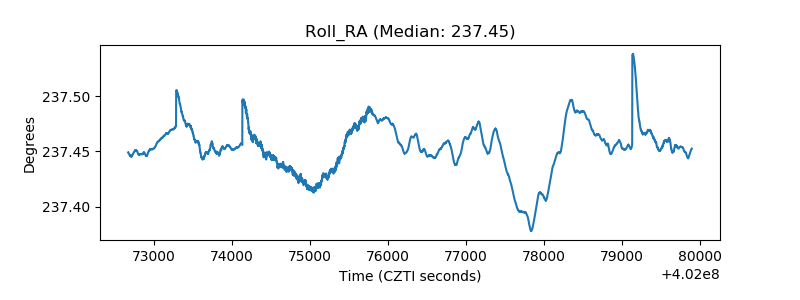 |
| Veto Counter | 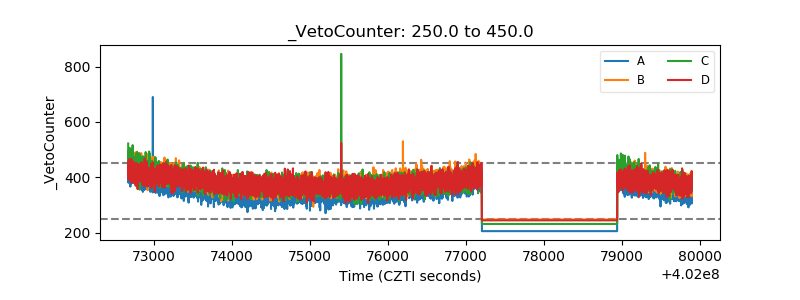 |