| Param | Original file | Final file |
|---|---|---|
| Filename | modeM0/AS1C07_001T12_9000005352_37858cztM0_level2.evt | modeM0/AS1C07_001T12_9000005352_37858cztM0_level2_quad_clean.evt |
| Size (bytes) | 477,501,120 | 81,316,800 |
| Size | 455.4 MB | 77.5 MB |
| Events in quadrant A | 4,552,403 | 475,592 |
| Events in quadrant B | 3,153,906 | 543,872 |
| Events in quadrant C | 2,891,140 | 533,030 |
| Events in quadrant D | 3,475,944 | 510,375 |
| Mode M9 | |||
|---|---|---|---|
| Quadrant | BADHDUFLAG | Total packets | Discarded packets |
| A | 0 | 18 | 0 |
| B | 0 | 18 | 0 |
| C | 0 | 18 | 0 |
| D | 0 | 19 | 0 |
| Mode M0 | |||
|---|---|---|---|
| Quadrant | BADHDUFLAG | Total packets | Discarded packets |
| A | 0 | 17328 | 3 |
| B | 0 | 13263 | 2 |
| C | 0 | 12062 | 2 |
| D | 0 | 14337 | 2 |
| Mode SS | |||
|---|---|---|---|
| Quadrant | BADHDUFLAG | Total packets | Discarded packets |
| A | 0 | 116 | 0 |
| B | 0 | 116 | 0 |
| C | 0 | 116 | 0 |
| D | 0 | 116 | 0 |
| Quadrant | Total seconds | Saturated seconds | Saturation percentage |
|---|---|---|---|
| A | 5707 | 789 | 13.825127% |
| B | 5707 | 148 | 2.593306% |
| C | 5707 | 55 | 0.963729% |
| D | 5707 | 167 | 2.926231% |
Noise dominated data is calculated using 1-second bins in cleaned event files. If a bin has >2000 counts, and if more than 50% of those come from <1% of pixels, then it is considered to be noise-dominated and hence unusable.
| Quadrant | # 1 sec bins | Bins with >0 counts | Bins with >2000 counts | High rate bins dominated by noise | Noise dominated (total time) | Noise dominated (detector-on time) | Marked lightcurve |
|---|---|---|---|---|---|---|---|
| A | 7140 | 5708 | 704 | 704 | 9.86% | 12.33% | 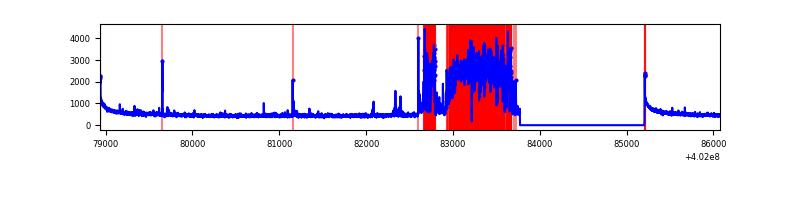 |
| B | 7140 | 5708 | 106 | 106 | 1.48% | 1.86% | 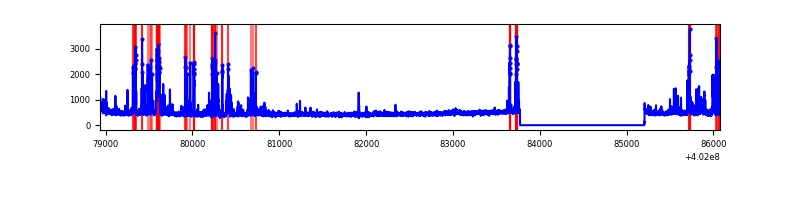 |
| C | 7140 | 5708 | 52 | 52 | 0.73% | 0.91% | 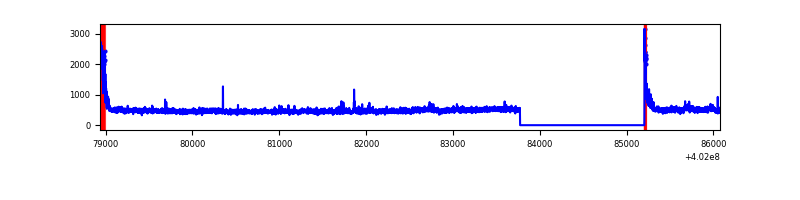 |
| D | 7140 | 5708 | 124 | 124 | 1.74% | 2.17% | 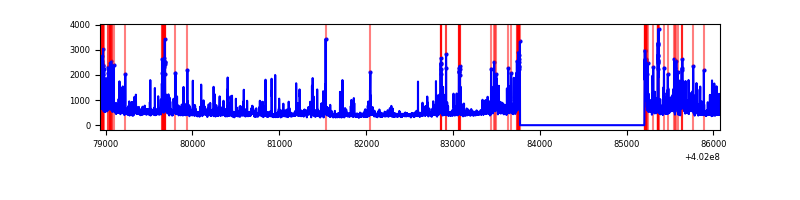 |
Top three noisy pixels from each quadrant. If the there are fewer than three noisy pixels in the level2.evt file, extra rows are filled as -1
| Pixel properties | Quadrant properties | ||||||
|---|---|---|---|---|---|---|---|
| Quadrant | DetID | PixID | Counts | Sigma | Mean | Median | Sigma |
| A | 9 | 143 | 1978271 | 17351.65 | 564 | 553 | 114.0 |
| A | 10 | 83 | 353244 | 3094.36 | 564 | 553 | 114.0 |
| A | 13 | 6 | 21349 | 182.46 | 564 | 553 | 114.0 |
| B | 5 | 172 | 523265 | 4433.63 | 618 | 602 | 117.9 |
| B | 0 | 189 | 38997 | 325.7 | 618 | 602 | 117.9 |
| B | 4 | 81 | 36848 | 307.47 | 618 | 602 | 117.9 |
| C | 15 | 214 | 237966 | 1669.42 | 608 | 613 | 142.2 |
| C | 0 | 10 | 187360 | 1313.48 | 608 | 613 | 142.2 |
| C | 14 | 67 | 64749 | 451.1 | 608 | 613 | 142.2 |
| D | 1 | 52 | 275980 | 1879.18 | 606 | 589 | 146.5 |
| D | 2 | 249 | 268265 | 1826.54 | 606 | 589 | 146.5 |
| D | 2 | 250 | 183520 | 1248.26 | 606 | 589 | 146.5 |
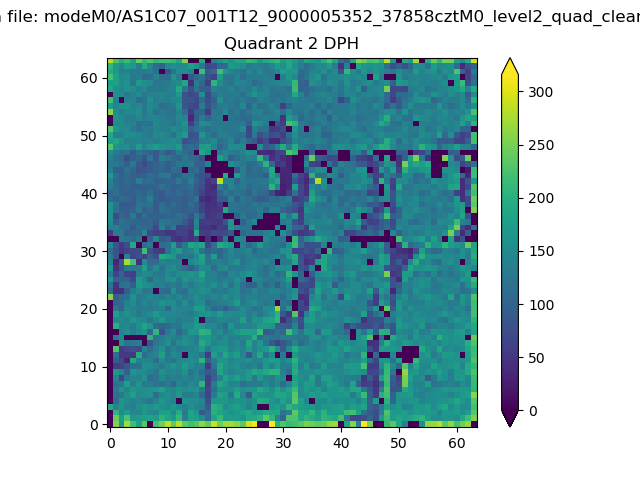
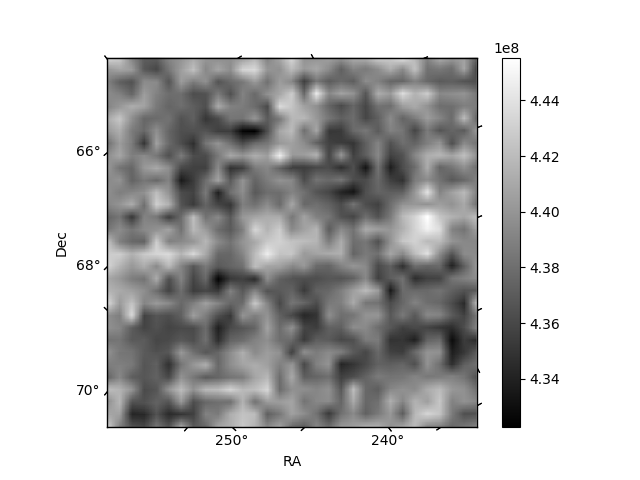
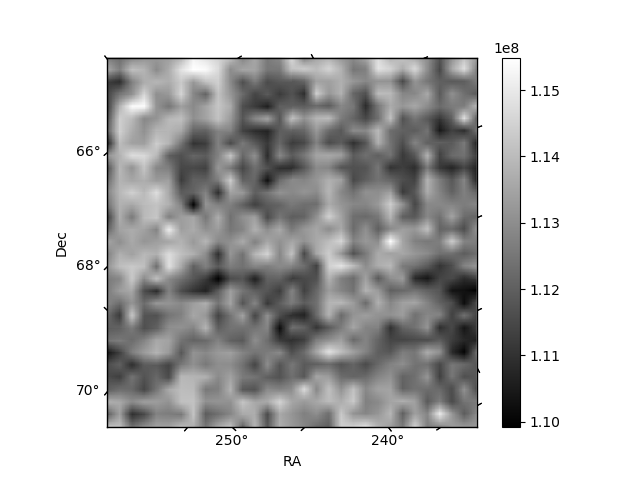
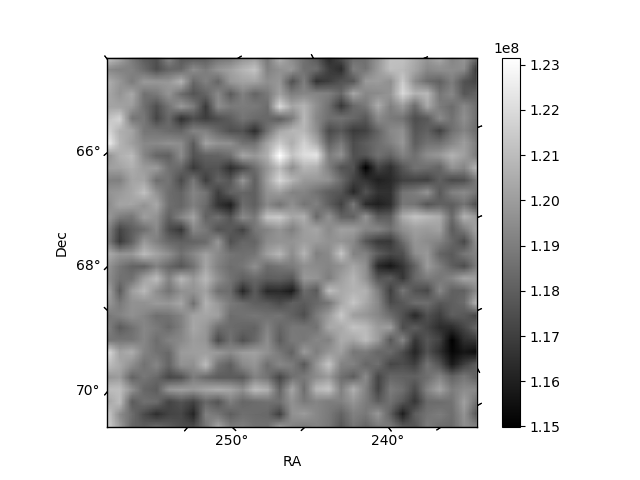
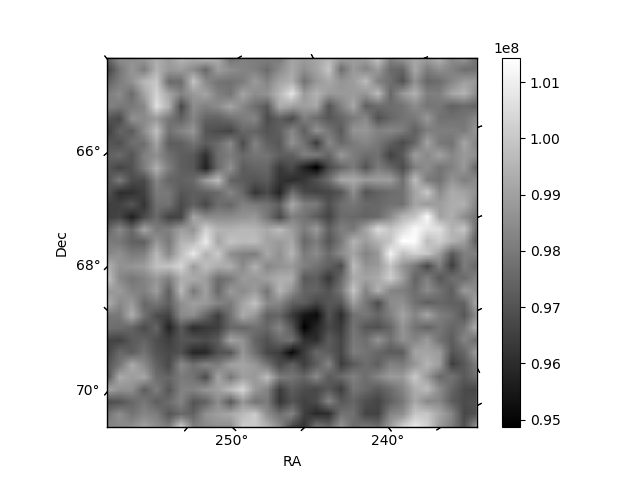
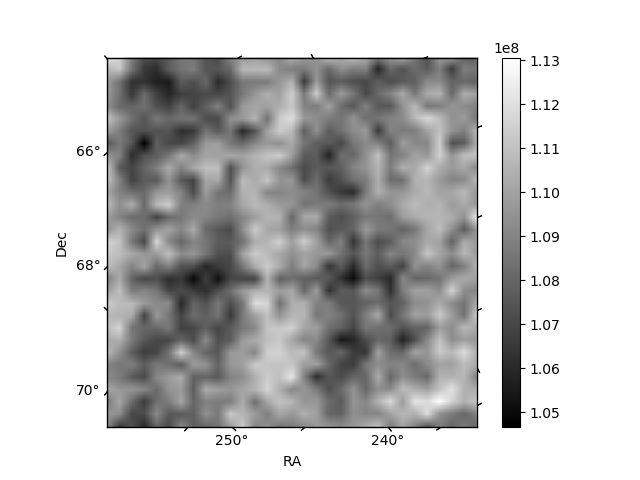
Histogram calculated using DETX and DETY for each event in the final _common_clean file
| Quadrant A | 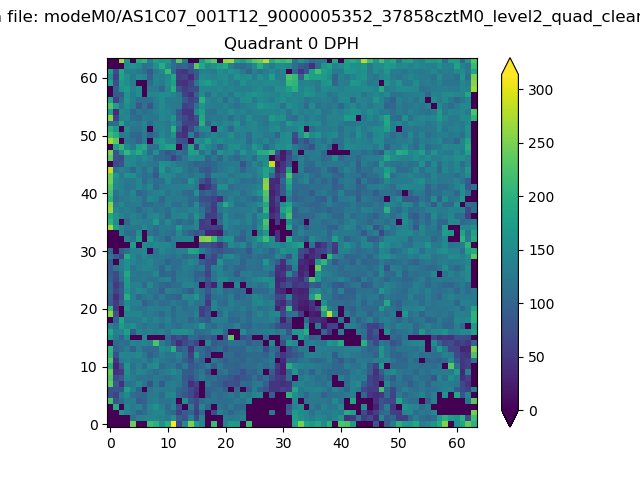 |
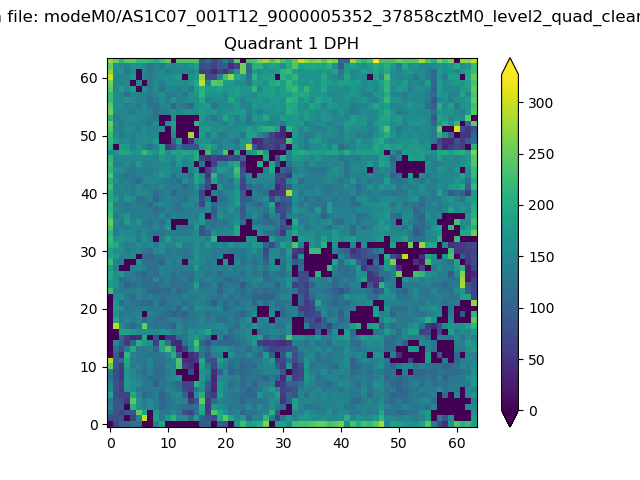 |
Quadrant B |
|---|---|---|---|
| Quadrant D | 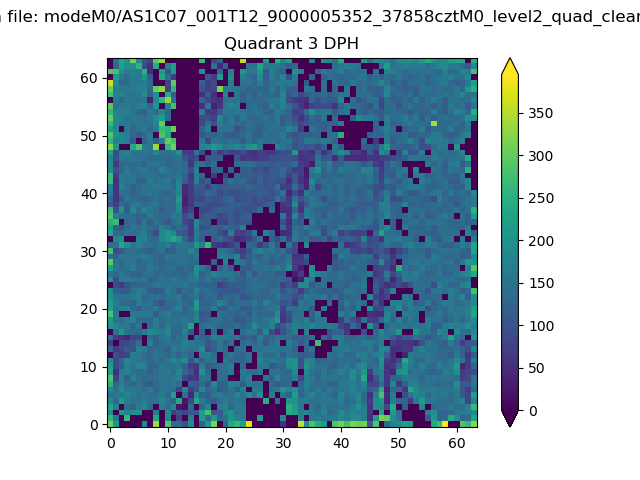 |
 |
Quadrant C |
| Plot type | Count rate plots | Images |
|---|---|---|
| Comparison with Poisson distribution Blue bars denote a histogram of data divided into 1 sec bins. Red curve is a Poisson curve with rate = median count rate of data. |
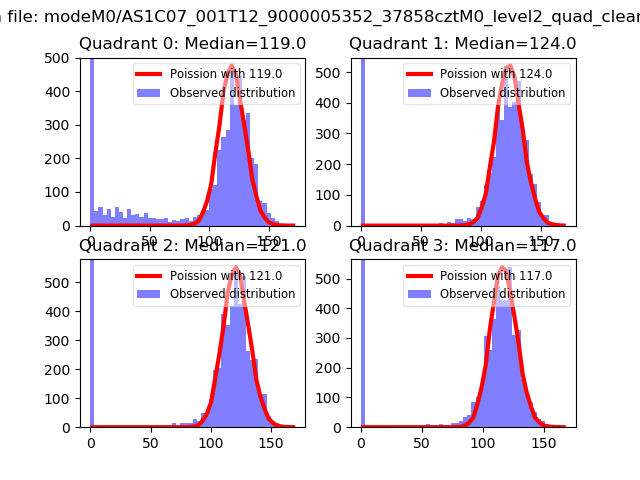 |
 |
| Quadrant-wise count rates Data is divided into 100 sec bins |
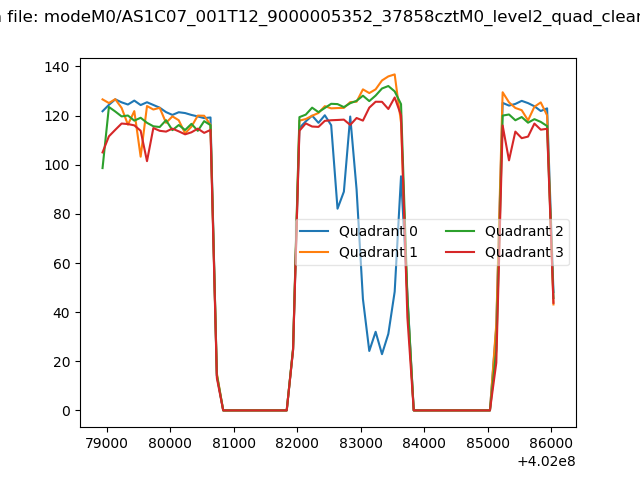 |
|
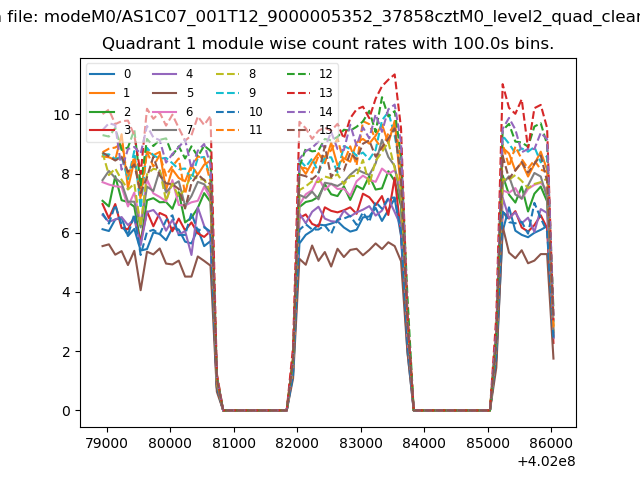
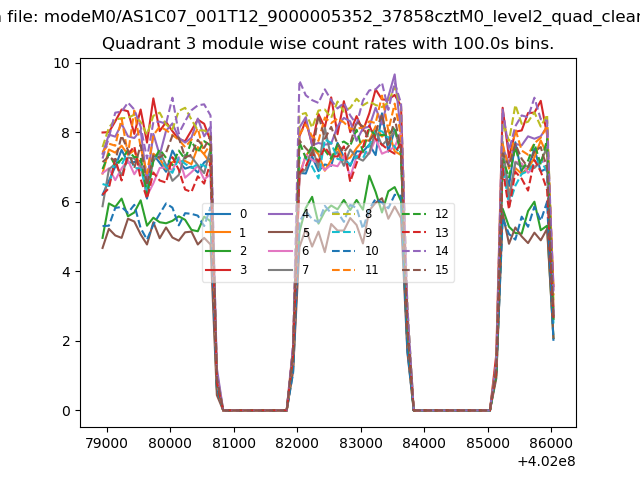
| Module-wise count rates for Quadrant A Data is divided into 100 sec bins |
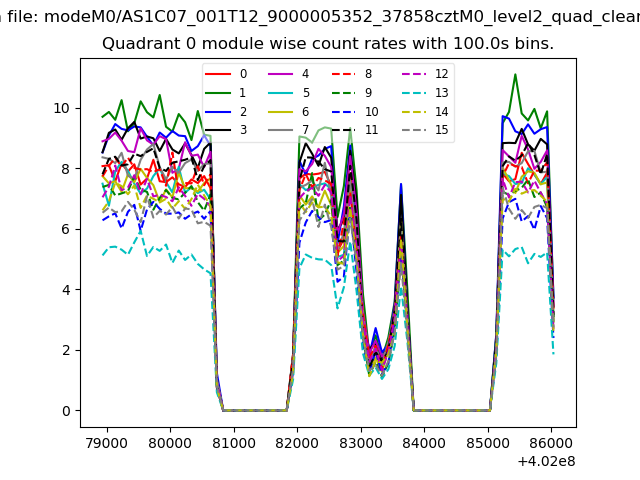 |
 |
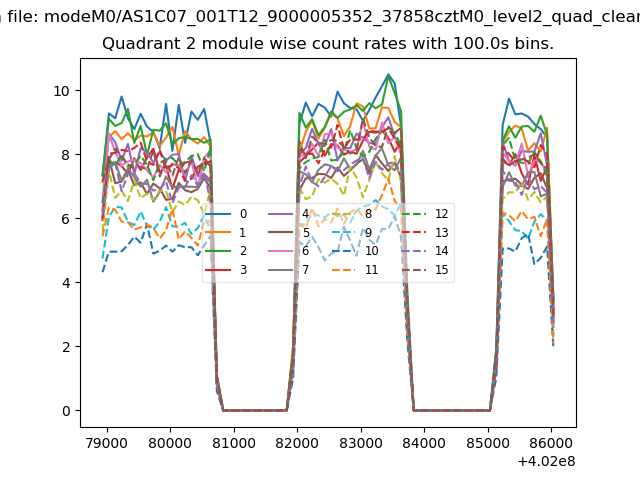
| Module-wise count rates for Quadrant B Data is divided into 100 sec bins |
 |
 |
| Module-wise count rates for Quadrant C Data is divided into 100 sec bins |
 |
 |
| Module-wise count rates for Quadrant D Data is divided into 100 sec bins |
 |
 |
| Parameter | Plot |
|---|---|
| CZT HV Monitor | 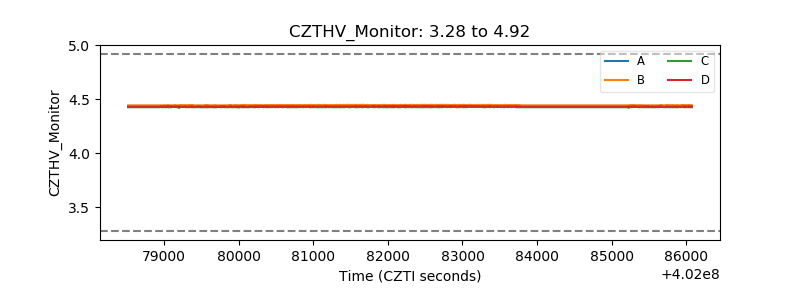 |
| D_VDD | 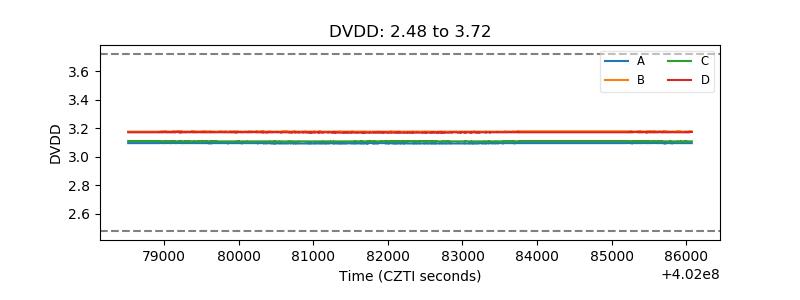 |
| Temperature 1 | 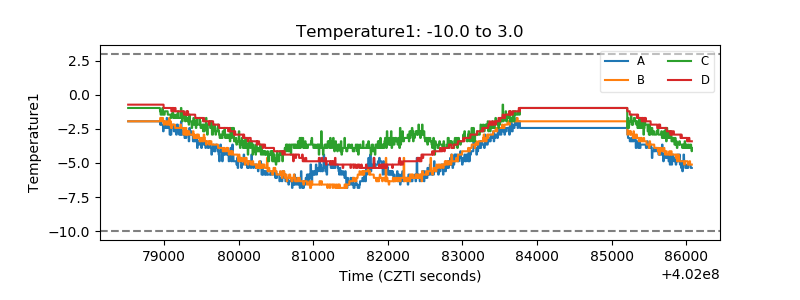 |
| Veto HV Monitor | 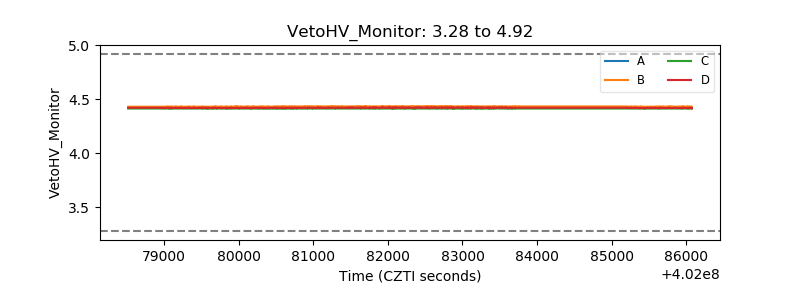 |
| Veto LLD | 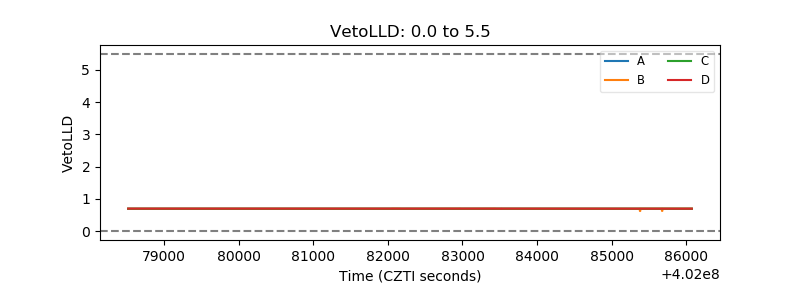 |
| Alpha Counter | 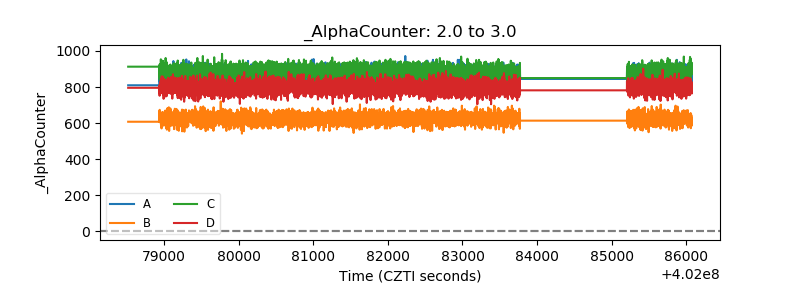 |
| _CPM_Rate | 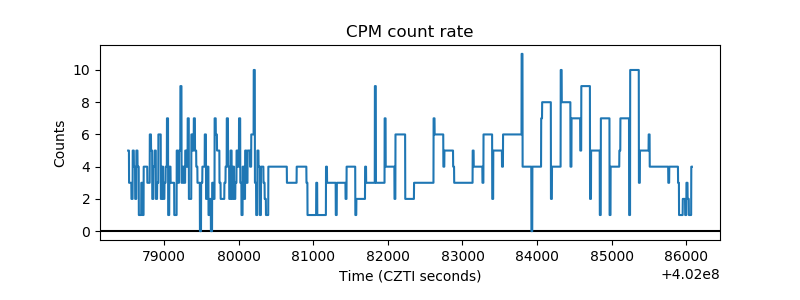 |
| CZT Counter | 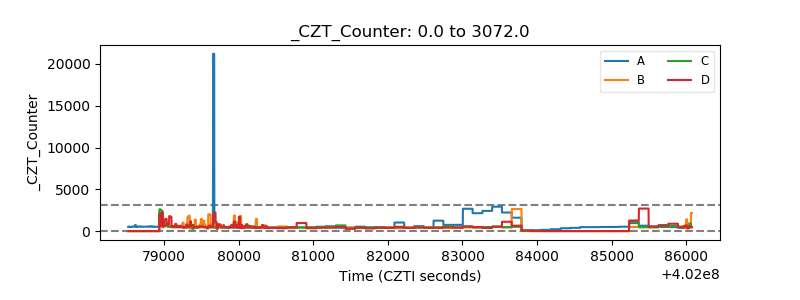 |
| +2.5 Volts monitor | 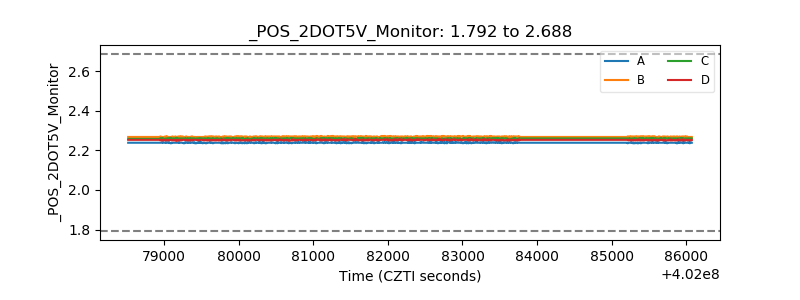 |
| +5 Volts monitor | 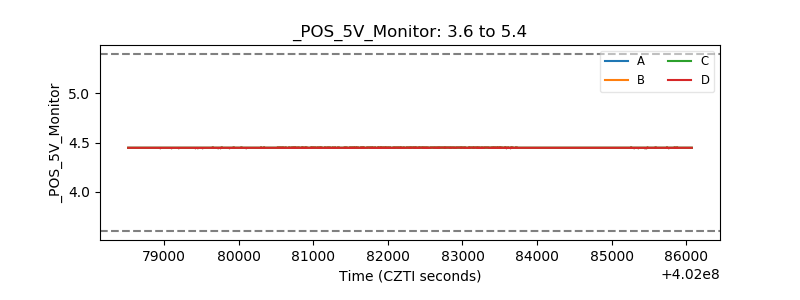 |
| _ROLL_ROT | 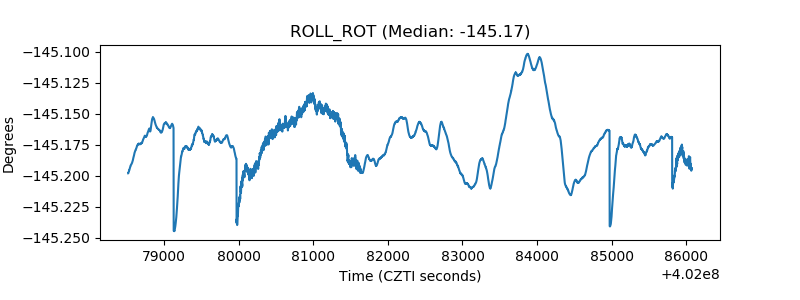 |
| _Roll_DEC | 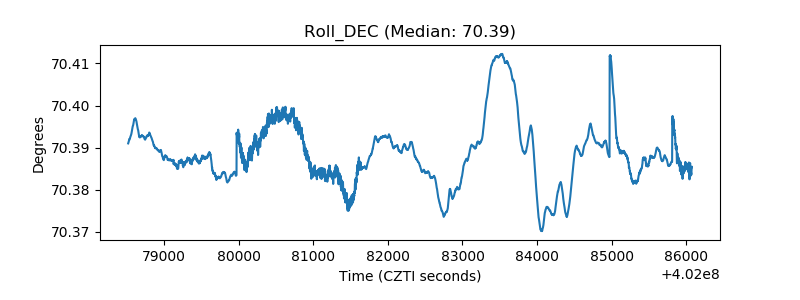 |
| _Roll_RA | 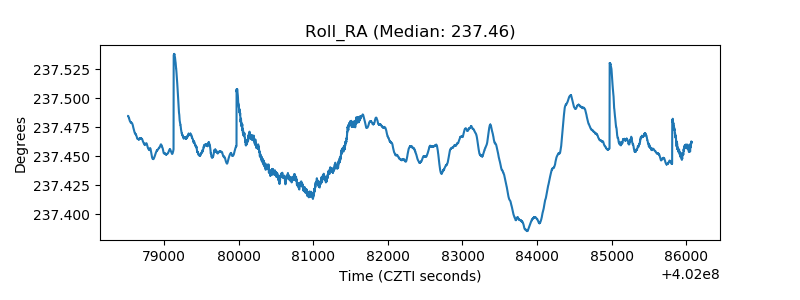 |
| Veto Counter | 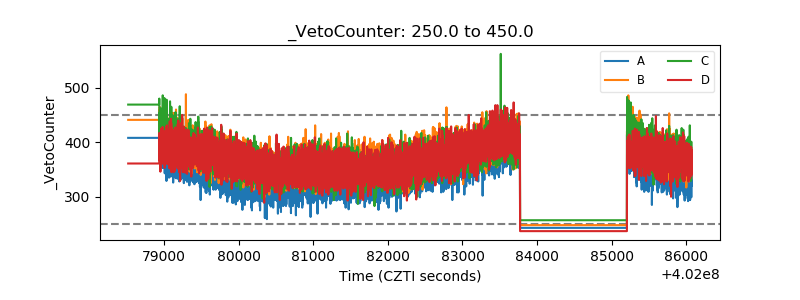 |