| Param | Original file | Final file |
|---|---|---|
| Filename | modeM0/AS1C07_001T12_9000005352_37859cztM0_level2.evt | modeM0/AS1C07_001T12_9000005352_37859cztM0_level2_quad_clean.evt |
| Size (bytes) | 487,944,000 | 86,181,120 |
| Size | 465.3 MB | 82.2 MB |
| Events in quadrant A | 2,917,308 | 569,547 |
| Events in quadrant B | 3,308,139 | 563,543 |
| Events in quadrant C | 3,022,321 | 556,622 |
| Events in quadrant D | 5,129,510 | 507,778 |
| Mode M9 | |||
|---|---|---|---|
| Quadrant | BADHDUFLAG | Total packets | Discarded packets |
| A | 0 | 21 | 0 |
| B | 0 | 21 | 0 |
| C | 0 | 21 | 0 |
| D | 0 | 22 | 0 |
| Mode M0 | |||
|---|---|---|---|
| Quadrant | BADHDUFLAG | Total packets | Discarded packets |
| A | 0 | 12456 | 3 |
| B | 0 | 13935 | 2 |
| C | 0 | 12433 | 2 |
| D | 0 | 19323 | 2 |
| Mode SS | |||
|---|---|---|---|
| Quadrant | BADHDUFLAG | Total packets | Discarded packets |
| A | 0 | 120 | 0 |
| B | 0 | 120 | 0 |
| C | 0 | 120 | 0 |
| D | 0 | 120 | 0 |
| Quadrant | Total seconds | Saturated seconds | Saturation percentage |
|---|---|---|---|
| A | 5895 | 15 | 0.254453% |
| B | 5895 | 169 | 2.866836% |
| C | 5895 | 27 | 0.458015% |
| D | 5895 | 602 | 10.212044% |
Noise dominated data is calculated using 1-second bins in cleaned event files. If a bin has >2000 counts, and if more than 50% of those come from <1% of pixels, then it is considered to be noise-dominated and hence unusable.
| Quadrant | # 1 sec bins | Bins with >0 counts | Bins with >2000 counts | High rate bins dominated by noise | Noise dominated (total time) | Noise dominated (detector-on time) | Marked lightcurve |
|---|---|---|---|---|---|---|---|
| A | 7207 | 5896 | 10 | 10 | 0.14% | 0.17% | 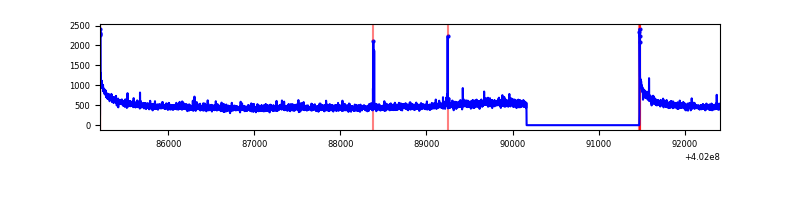 |
| B | 7207 | 5896 | 106 | 106 | 1.47% | 1.80% | 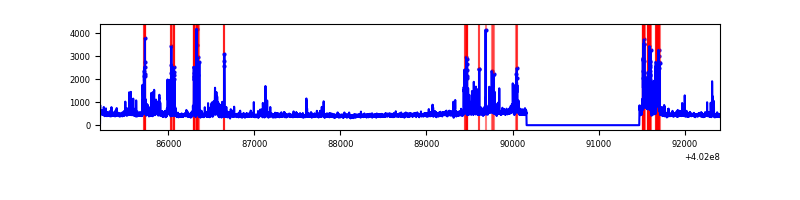 |
| C | 7207 | 5896 | 26 | 26 | 0.36% | 0.44% | 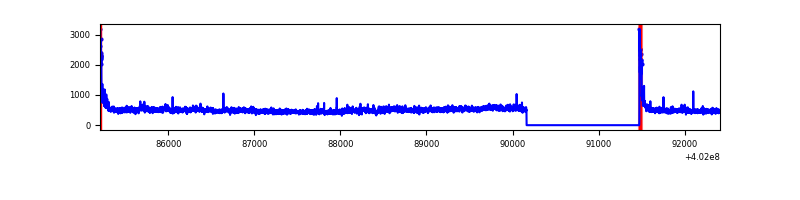 |
| D | 7207 | 5896 | 500 | 500 | 6.94% | 8.48% | 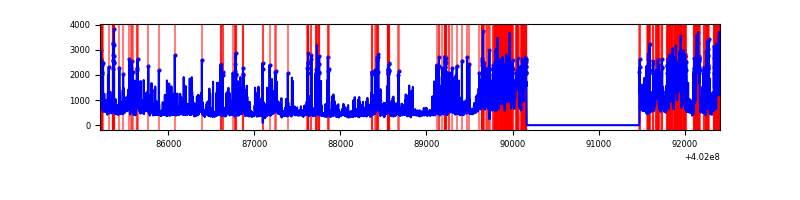 |
Top three noisy pixels from each quadrant. If the there are fewer than three noisy pixels in the level2.evt file, extra rows are filled as -1
| Pixel properties | Quadrant properties | ||||||
|---|---|---|---|---|---|---|---|
| Quadrant | DetID | PixID | Counts | Sigma | Mean | Median | Sigma |
| A | 10 | 83 | 370118 | 2823.48 | 647 | 633 | 130.9 |
| A | 9 | 143 | 20923 | 155.05 | 647 | 633 | 130.9 |
| A | 13 | 6 | 15353 | 112.49 | 647 | 633 | 130.9 |
| B | 5 | 172 | 565229 | 4611.21 | 637 | 619 | 122.4 |
| B | 0 | 229 | 66420 | 537.4 | 637 | 619 | 122.4 |
| B | 4 | 81 | 57351 | 463.33 | 637 | 619 | 122.4 |
| C | 15 | 214 | 247568 | 1674.9 | 631 | 634 | 147.4 |
| C | 14 | 67 | 157401 | 1063.32 | 631 | 634 | 147.4 |
| C | 0 | 10 | 128067 | 864.35 | 631 | 634 | 147.4 |
| D | 2 | 249 | 893686 | 6007.0 | 609 | 590 | 148.7 |
| D | 1 | 52 | 546628 | 3672.67 | 609 | 590 | 148.7 |
| D | 1 | 47 | 339226 | 2277.68 | 609 | 590 | 148.7 |
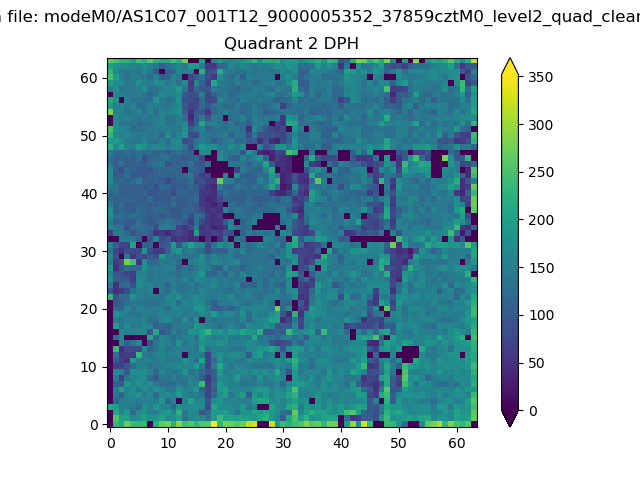
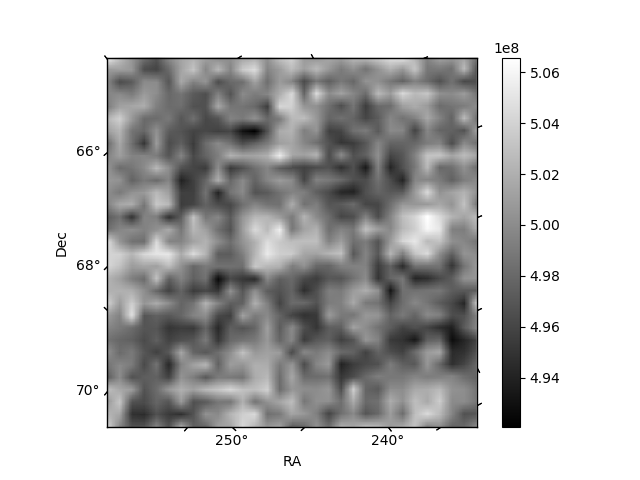
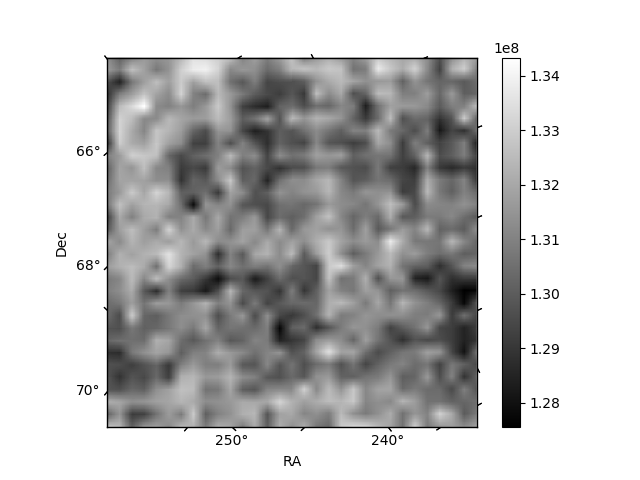
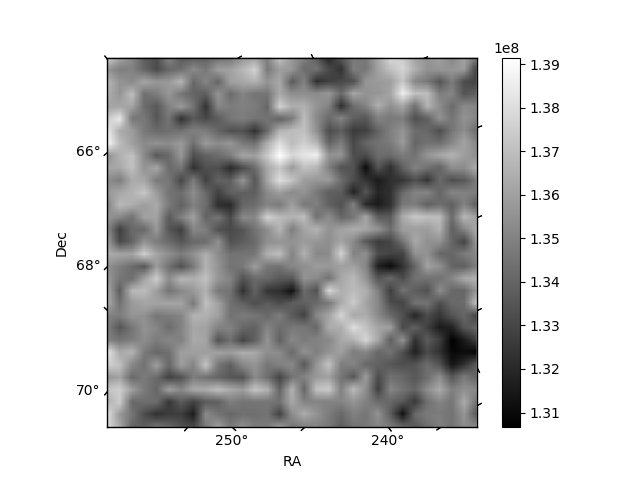
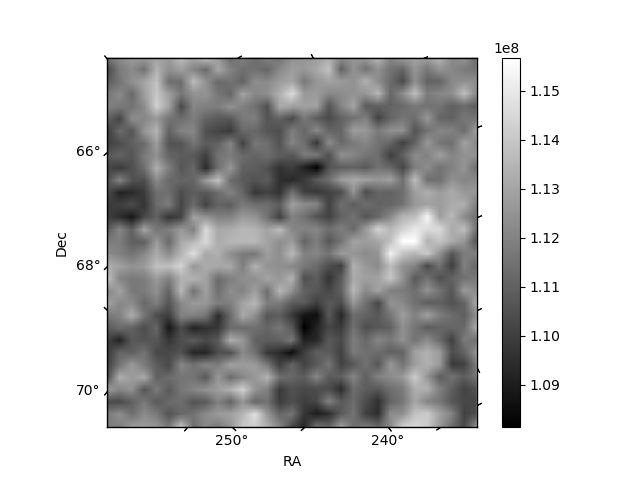
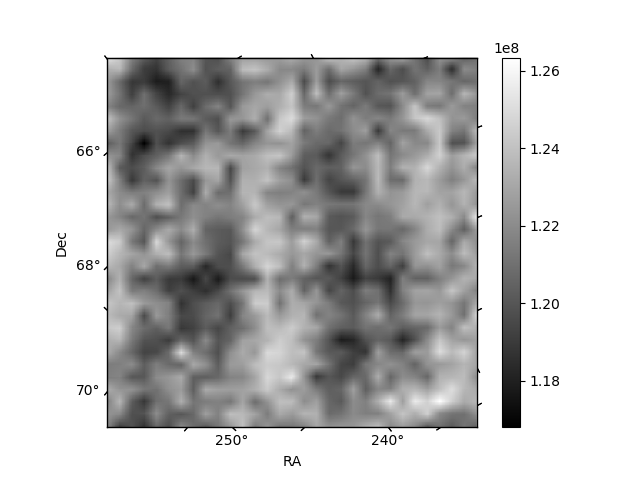
Histogram calculated using DETX and DETY for each event in the final _common_clean file
| Quadrant A | 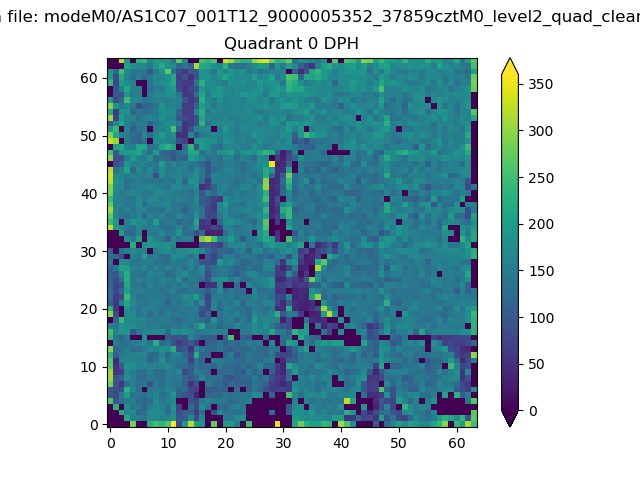 |
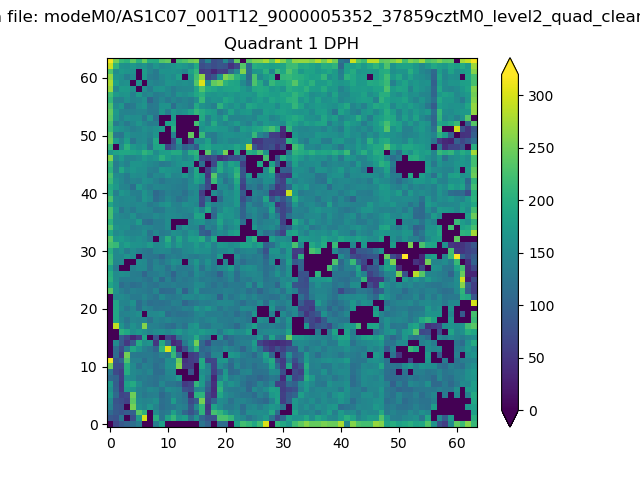 |
Quadrant B |
|---|---|---|---|
| Quadrant D | 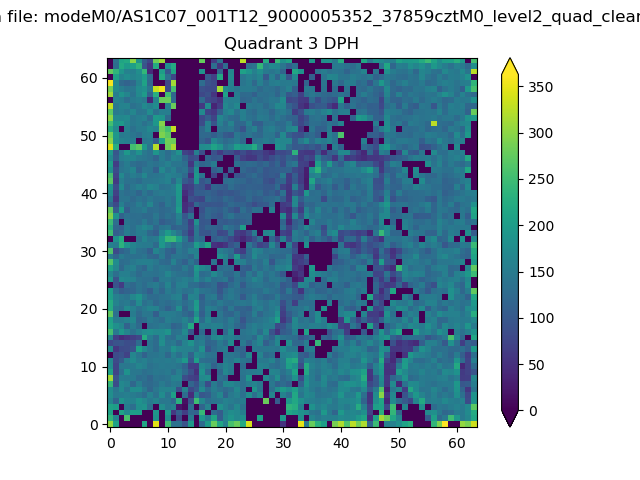 |
 |
Quadrant C |
| Plot type | Count rate plots | Images |
|---|---|---|
| Comparison with Poisson distribution Blue bars denote a histogram of data divided into 1 sec bins. Red curve is a Poisson curve with rate = median count rate of data. |
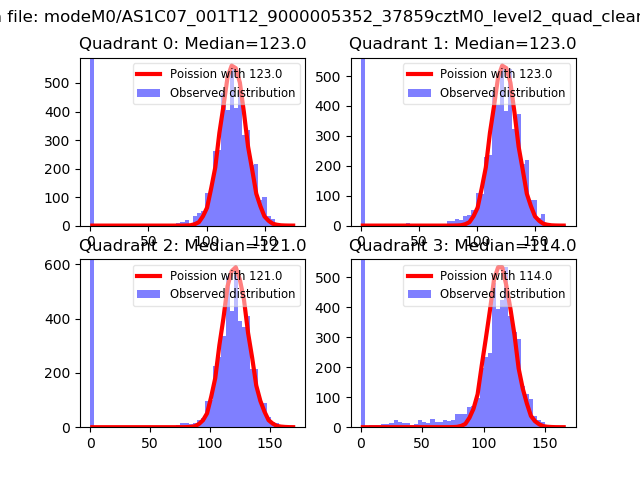 |
 |
| Quadrant-wise count rates Data is divided into 100 sec bins |
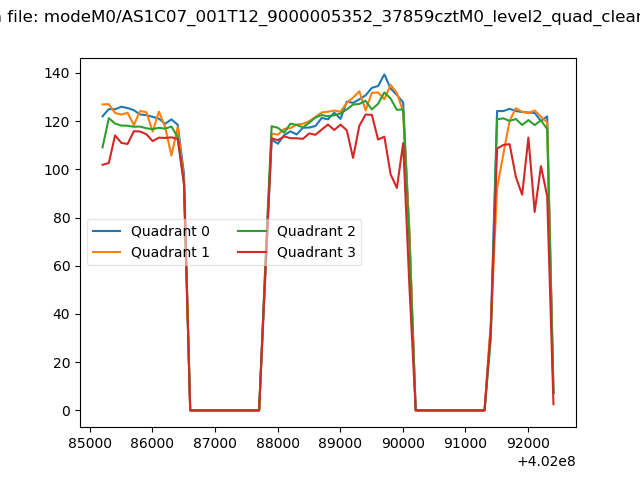 |
|
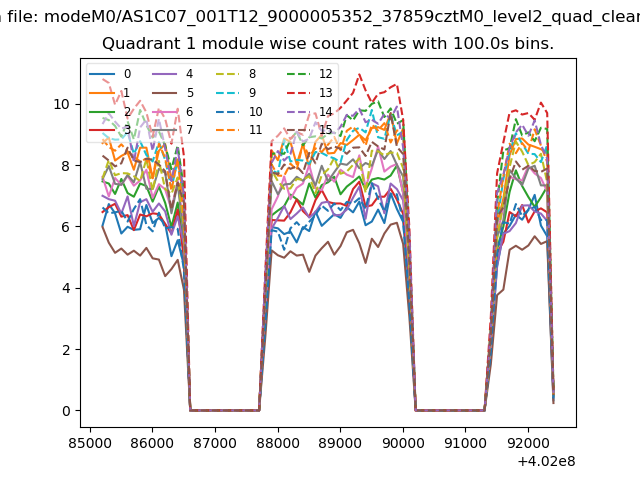
| Module-wise count rates for Quadrant A Data is divided into 100 sec bins |
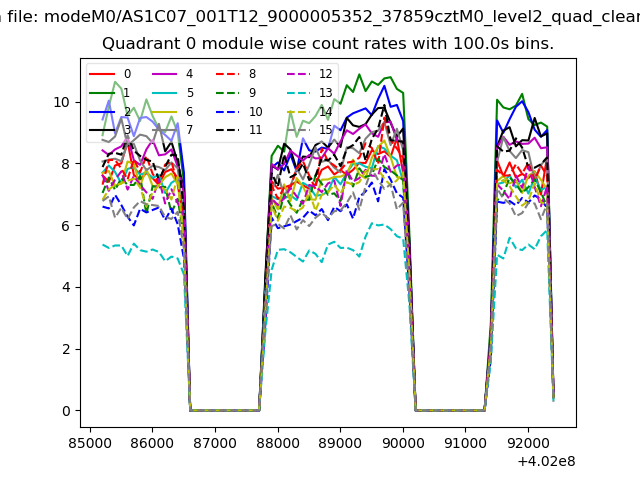 |
 |
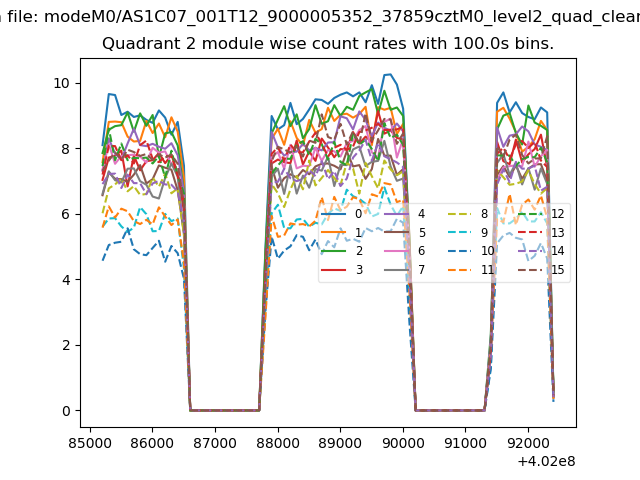
| Module-wise count rates for Quadrant B Data is divided into 100 sec bins |
 |
 |
| Module-wise count rates for Quadrant C Data is divided into 100 sec bins |
 |
 |
| Module-wise count rates for Quadrant D Data is divided into 100 sec bins |
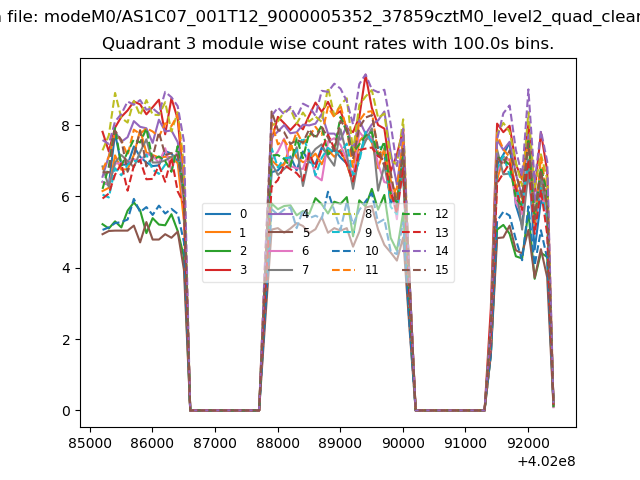 |
 |
| Parameter | Plot |
|---|---|
| CZT HV Monitor | 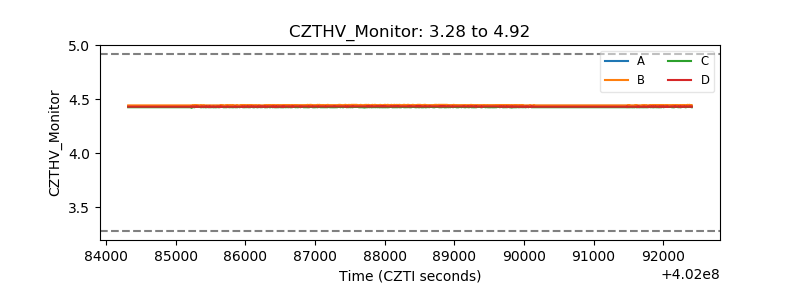 |
| D_VDD | 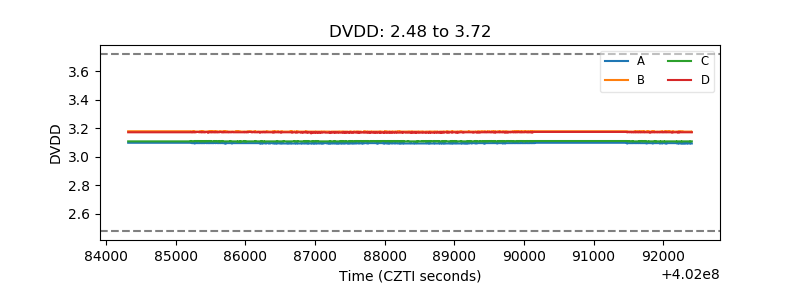 |
| Temperature 1 | 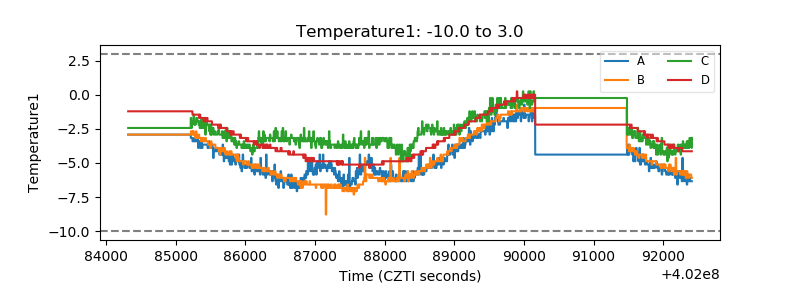 |
| Veto HV Monitor | 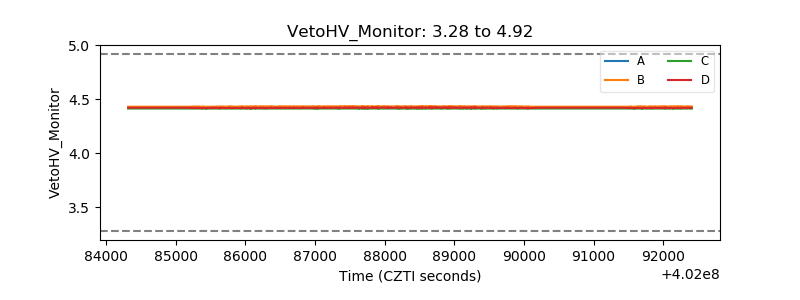 |
| Veto LLD | 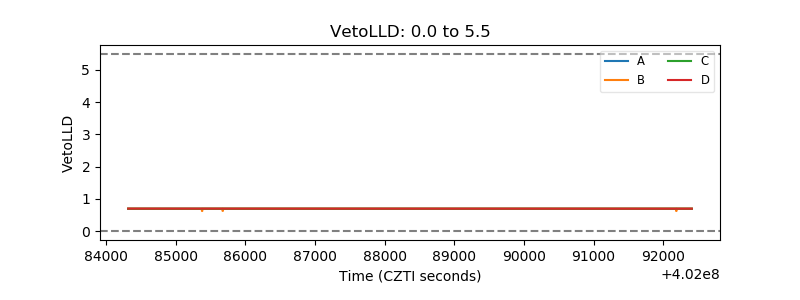 |
| Alpha Counter | 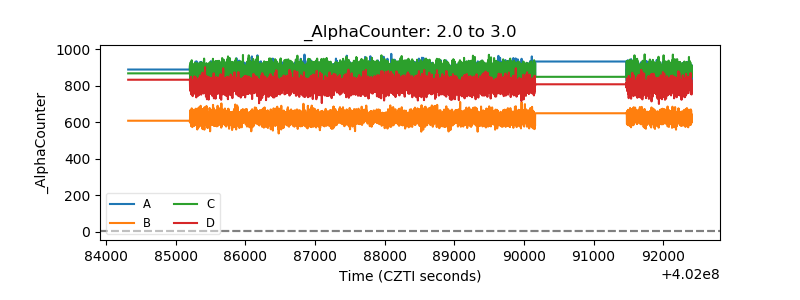 |
| _CPM_Rate | 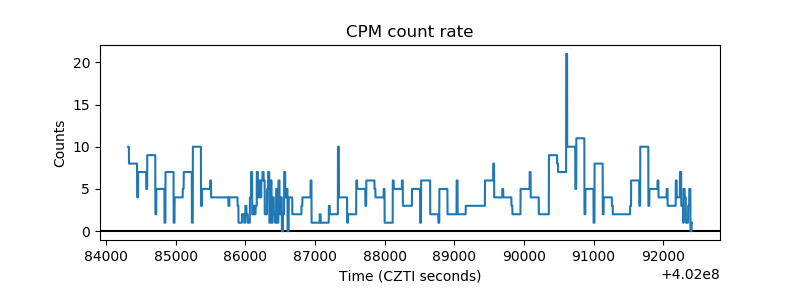 |
| CZT Counter | 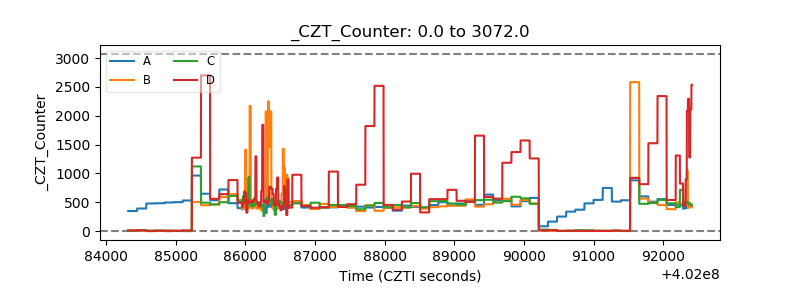 |
| +2.5 Volts monitor |  |
| +5 Volts monitor | 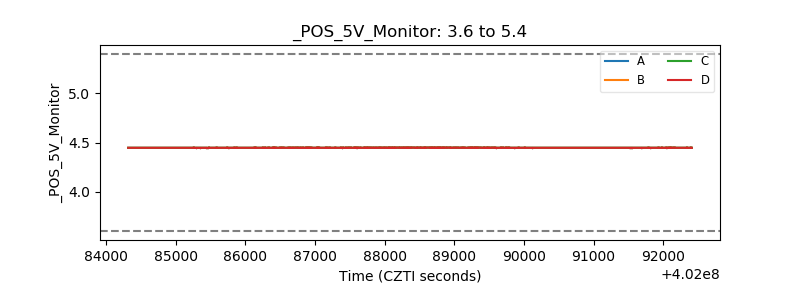 |
| _ROLL_ROT | 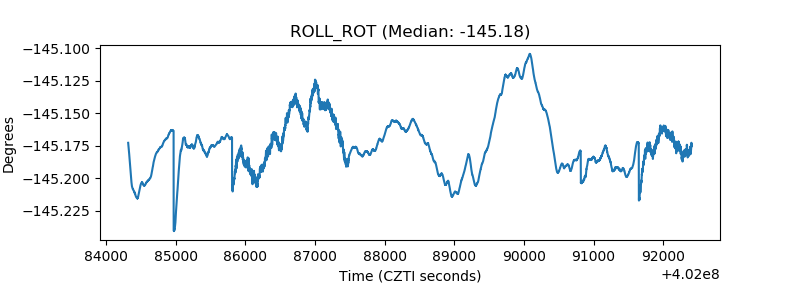 |
| _Roll_DEC |  |
| _Roll_RA | 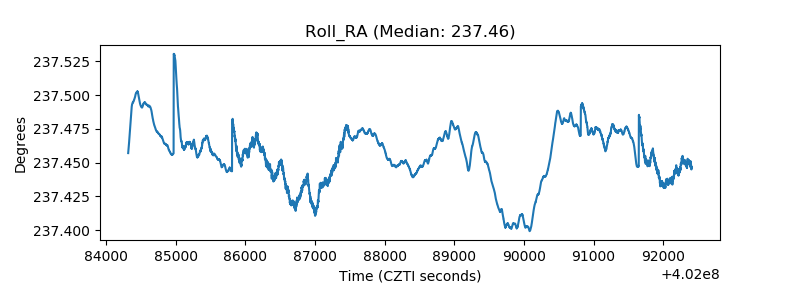 |
| Veto Counter | 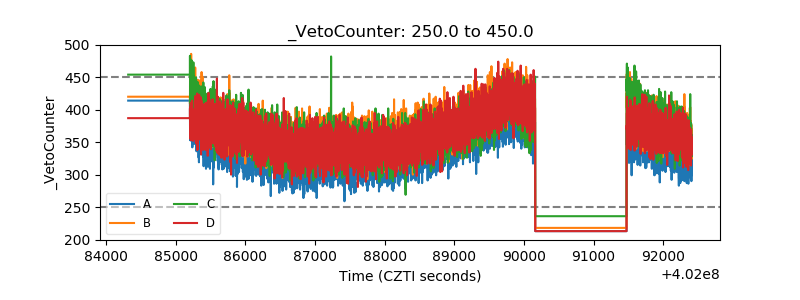 |