| Param | Original file | Final file |
|---|---|---|
| Filename | modeM0/AS1C07_001T12_9000005352_37862cztM0_level2.evt | modeM0/AS1C07_001T12_9000005352_37862cztM0_level2_quad_clean.evt |
| Size (bytes) | 1,280,217,600 | 204,462,720 |
| Size | 1.2 GB | 195.0 MB |
| Events in quadrant A | 7,736,984 | 1,320,378 |
| Events in quadrant B | 8,256,863 | 1,315,519 |
| Events in quadrant C | 7,855,475 | 1,303,762 |
| Events in quadrant D | 13,866,090 | 1,172,983 |
| Mode M9 | |||
|---|---|---|---|
| Quadrant | BADHDUFLAG | Total packets | Discarded packets |
| A | 0 | 55 | 0 |
| B | 0 | 55 | 0 |
| C | 0 | 55 | 0 |
| D | 0 | 55 | 0 |
| Mode M0 | |||
|---|---|---|---|
| Quadrant | BADHDUFLAG | Total packets | Discarded packets |
| A | 0 | 33056 | 5 |
| B | 0 | 35654 | 4 |
| C | 0 | 33230 | 4 |
| D | 0 | 52405 | 4 |
| Mode SS | |||
|---|---|---|---|
| Quadrant | BADHDUFLAG | Total packets | Discarded packets |
| A | 0 | 320 | 0 |
| B | 0 | 320 | 0 |
| C | 0 | 320 | 0 |
| D | 0 | 320 | 0 |
| Quadrant | Total seconds | Saturated seconds | Saturation percentage |
|---|---|---|---|
| A | 15647 | 30 | 0.191730% |
| B | 15647 | 339 | 2.166549% |
| C | 15647 | 97 | 0.619927% |
| D | 15647 | 1813 | 11.586886% |
Noise dominated data is calculated using 1-second bins in cleaned event files. If a bin has >2000 counts, and if more than 50% of those come from <1% of pixels, then it is considered to be noise-dominated and hence unusable.
| Quadrant | # 1 sec bins | Bins with >0 counts | Bins with >2000 counts | High rate bins dominated by noise | Noise dominated (total time) | Noise dominated (detector-on time) | Marked lightcurve |
|---|---|---|---|---|---|---|---|
| A | 21167 | 15651 | 14 | 14 | 0.07% | 0.09% | 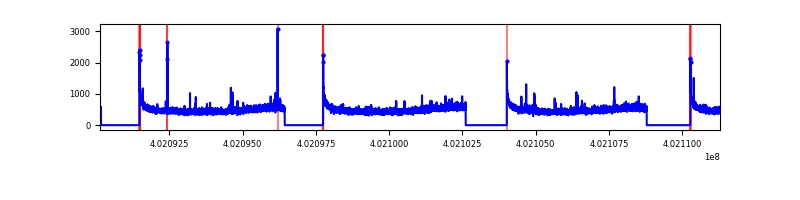 |
| B | 21167 | 15651 | 213 | 213 | 1.01% | 1.36% | 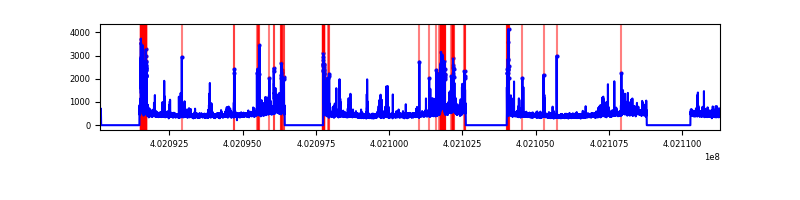 |
| C | 21167 | 15651 | 101 | 101 | 0.48% | 0.65% | 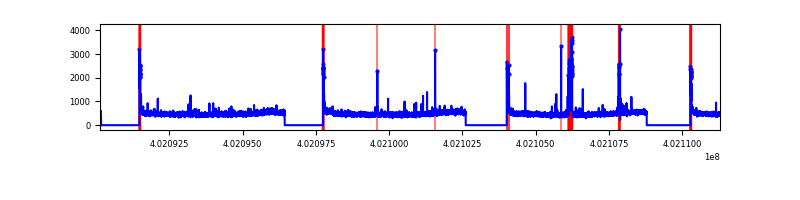 |
| D | 21167 | 15651 | 1598 | 1598 | 7.55% | 10.21% |  |
Top three noisy pixels from each quadrant. If the there are fewer than three noisy pixels in the level2.evt file, extra rows are filled as -1
| Pixel properties | Quadrant properties | ||||||
|---|---|---|---|---|---|---|---|
| Quadrant | DetID | PixID | Counts | Sigma | Mean | Median | Sigma |
| A | 10 | 83 | 875889 | 2534.88 | 1728 | 1692 | 344.9 |
| A | 12 | 189 | 42206 | 117.48 | 1728 | 1692 | 344.9 |
| A | 9 | 143 | 30060 | 82.26 | 1728 | 1692 | 344.9 |
| B | 5 | 172 | 890647 | 2752.27 | 1703 | 1658 | 323.0 |
| B | 0 | 229 | 189448 | 581.39 | 1703 | 1658 | 323.0 |
| B | 4 | 81 | 136883 | 418.65 | 1703 | 1658 | 323.0 |
| C | 15 | 214 | 652945 | 1676.75 | 1678 | 1688 | 388.4 |
| C | 14 | 254 | 276346 | 707.14 | 1678 | 1688 | 388.4 |
| C | 0 | 10 | 213959 | 546.52 | 1678 | 1688 | 388.4 |
| D | 2 | 249 | 3574113 | 9142.78 | 1607 | 1560 | 390.8 |
| D | 1 | 52 | 1926507 | 4926.27 | 1607 | 1560 | 390.8 |
| D | 10 | 253 | 512777 | 1308.29 | 1607 | 1560 | 390.8 |
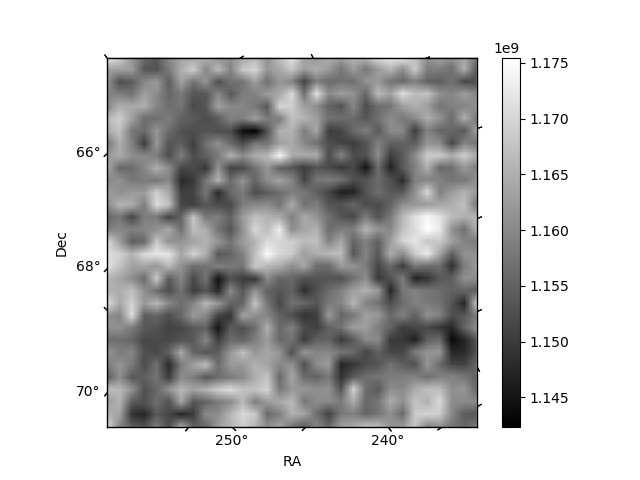
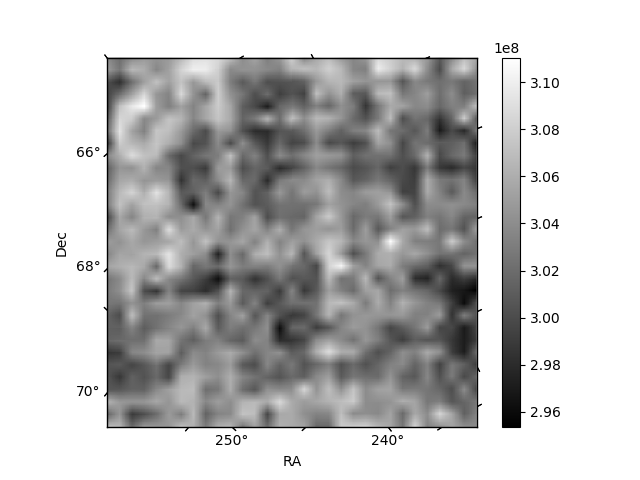
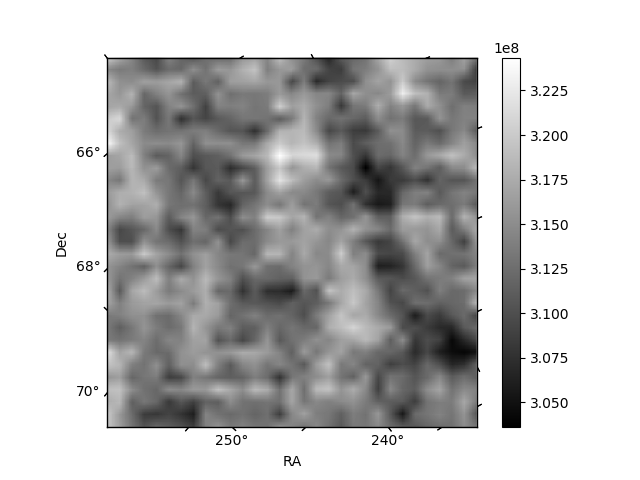
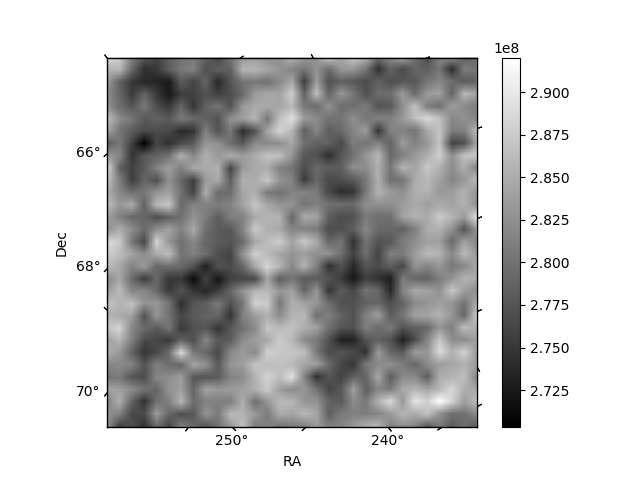
Histogram calculated using DETX and DETY for each event in the final _common_clean file
| Quadrant A | 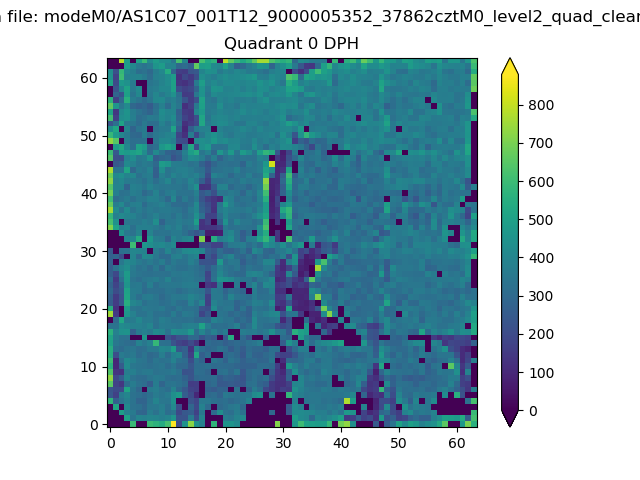 |
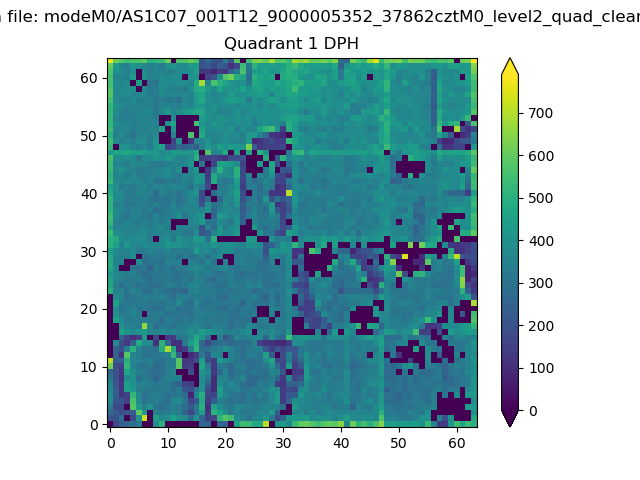 |
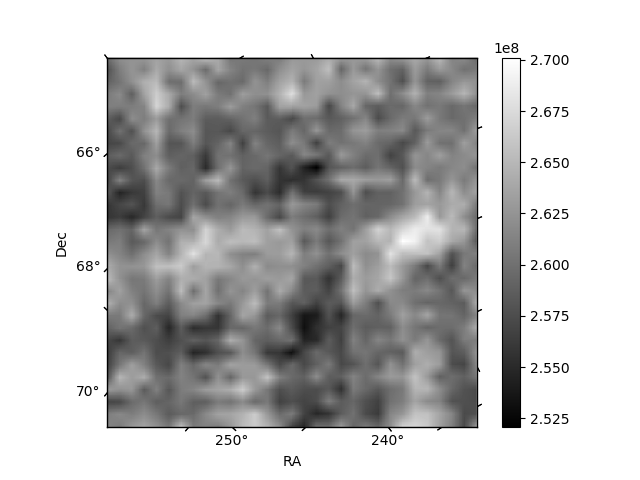
Quadrant B |
|---|---|---|---|
| Quadrant D | 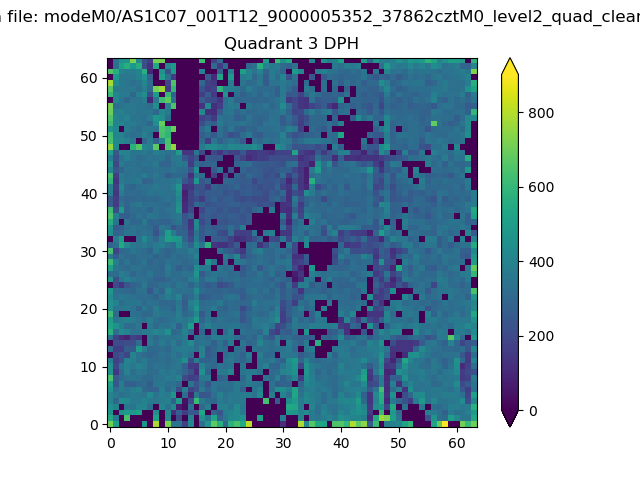 |
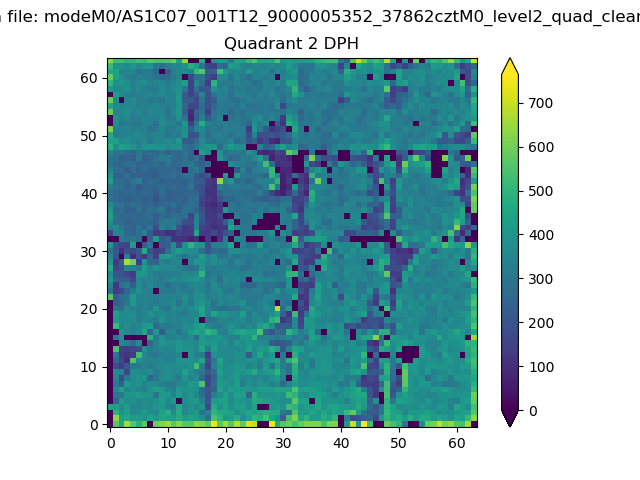 |
Quadrant C |
| Plot type | Count rate plots | Images |
|---|---|---|
| Comparison with Poisson distribution Blue bars denote a histogram of data divided into 1 sec bins. Red curve is a Poisson curve with rate = median count rate of data. |
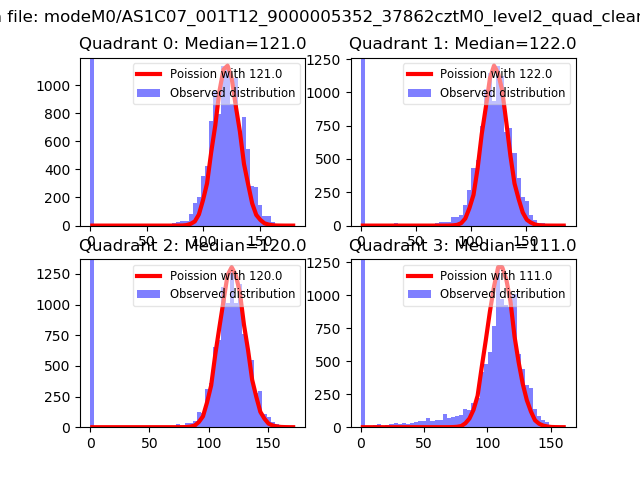 |
 |
| Quadrant-wise count rates Data is divided into 100 sec bins |
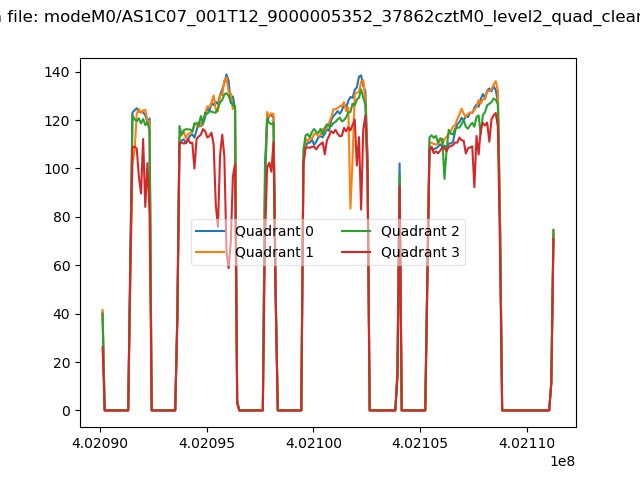 |
|
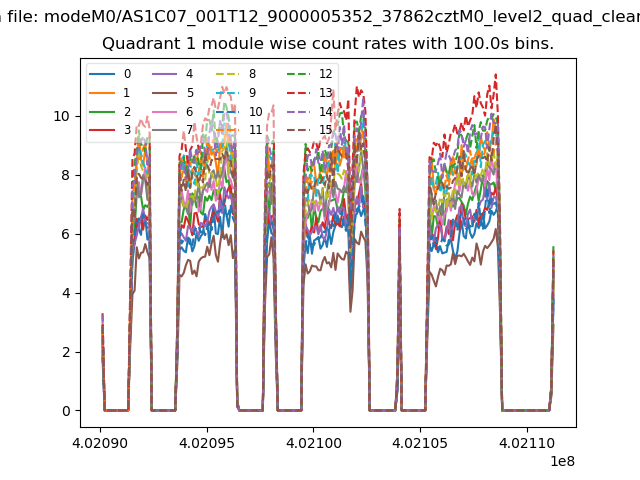
| Module-wise count rates for Quadrant A Data is divided into 100 sec bins |
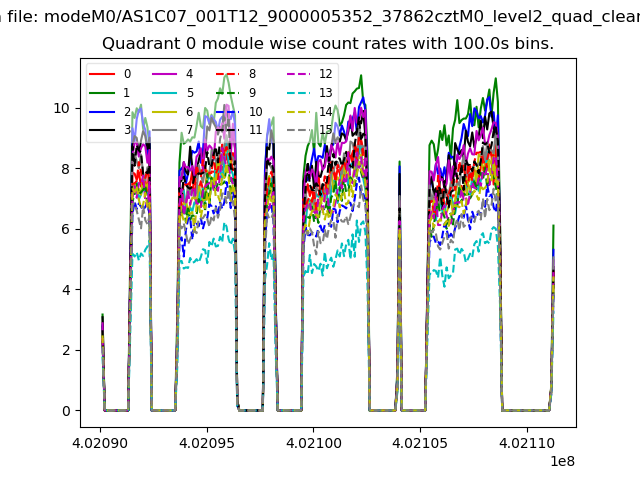 |
 |
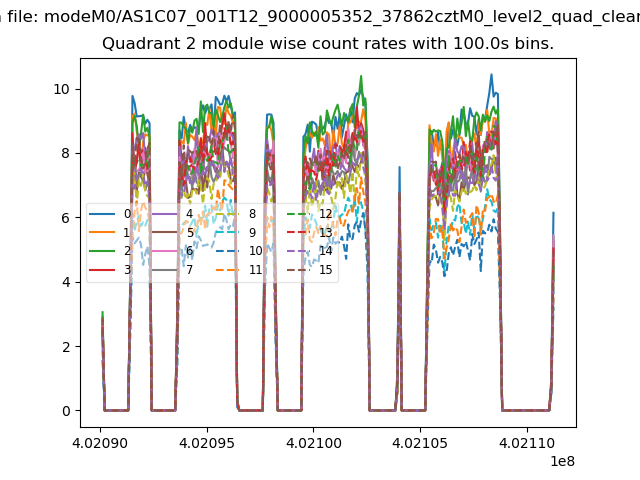
| Module-wise count rates for Quadrant B Data is divided into 100 sec bins |
 |
 |
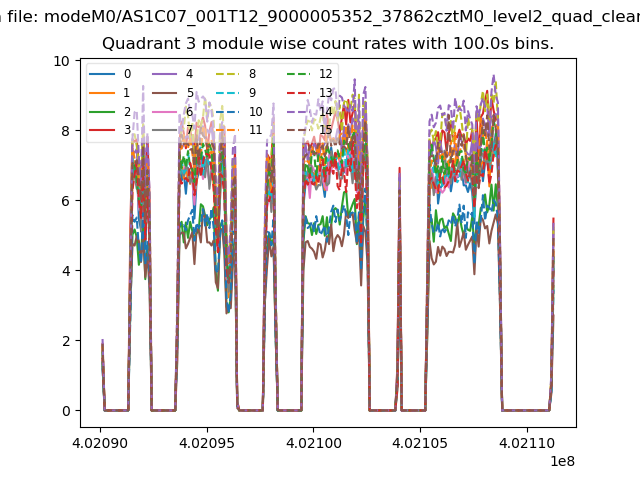
| Module-wise count rates for Quadrant C Data is divided into 100 sec bins |
 |
 |
| Module-wise count rates for Quadrant D Data is divided into 100 sec bins |
 |
 |
| Parameter | Plot |
|---|---|
| CZT HV Monitor | 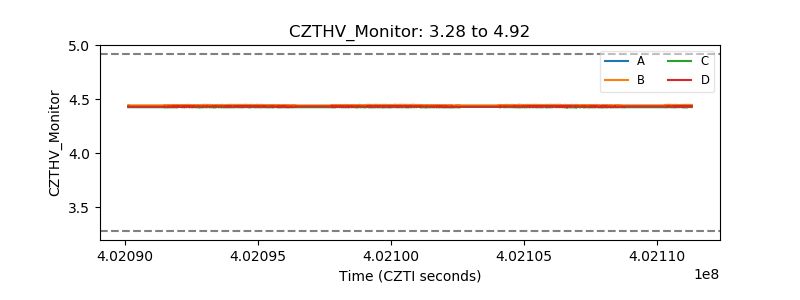 |
| D_VDD | 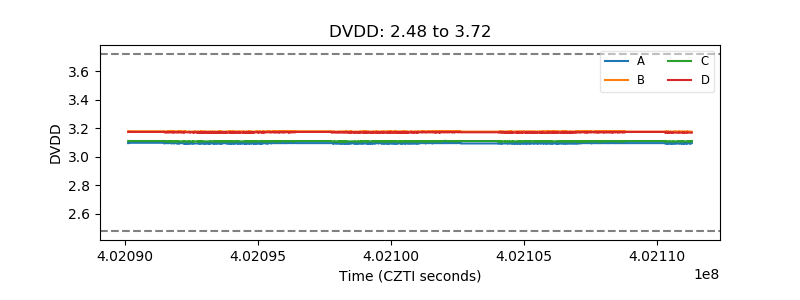 |
| Temperature 1 | 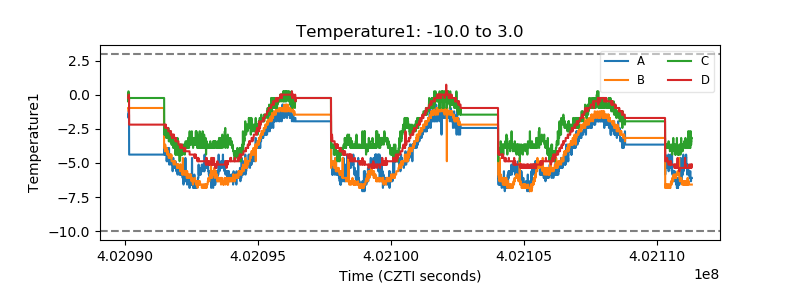 |
| Veto HV Monitor | 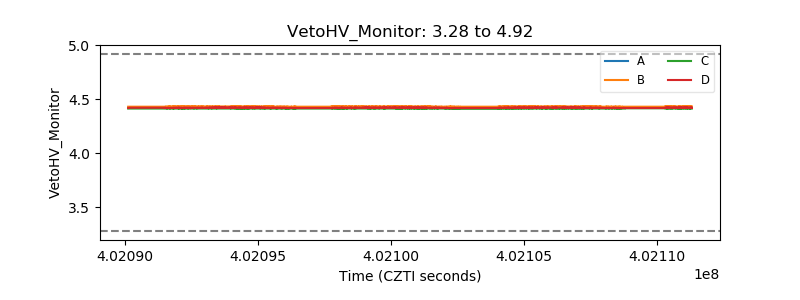 |
| Veto LLD | 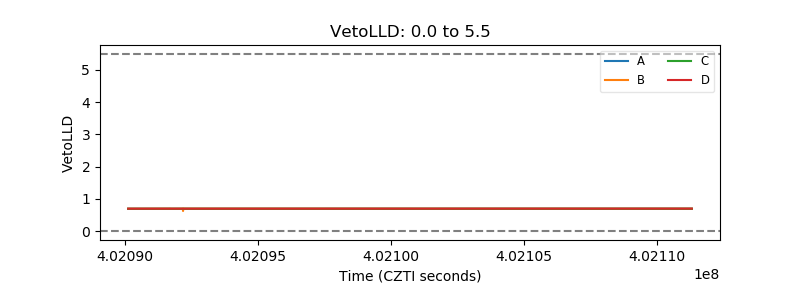 |
| Alpha Counter | 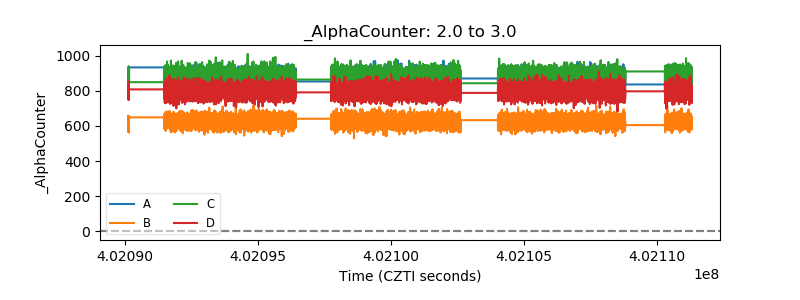 |
| _CPM_Rate | 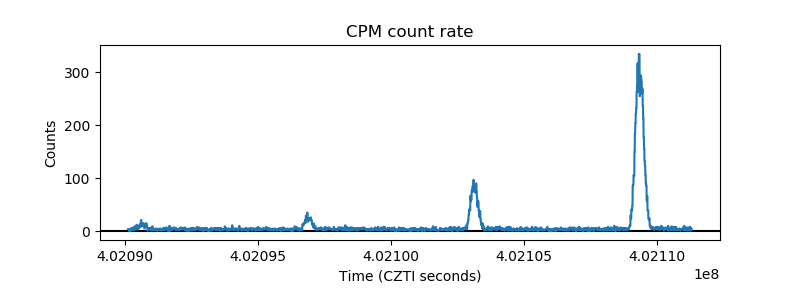 |
| CZT Counter | 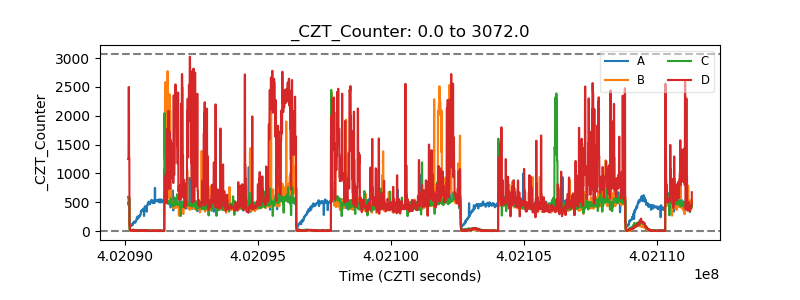 |
| +2.5 Volts monitor | 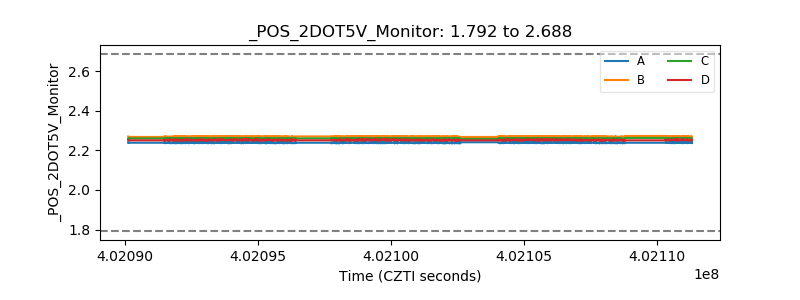 |
| +5 Volts monitor | 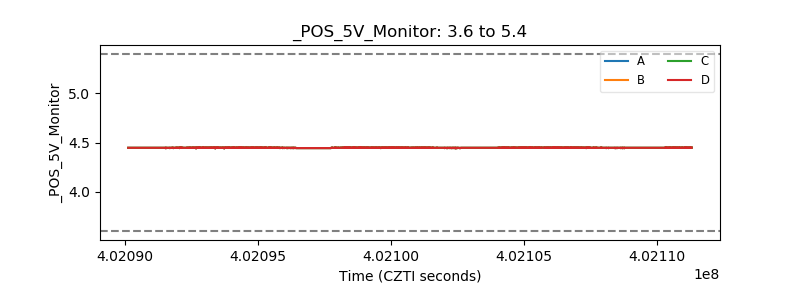 |
| _ROLL_ROT | 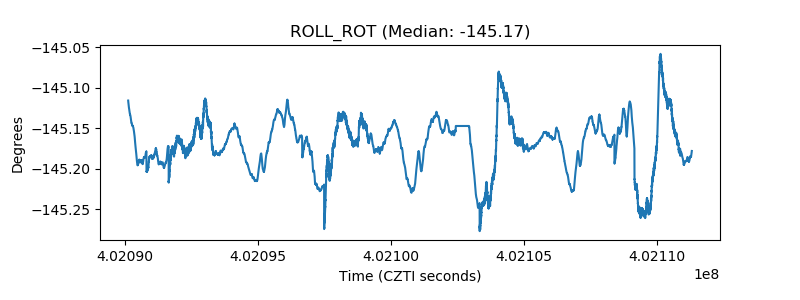 |
| _Roll_DEC | 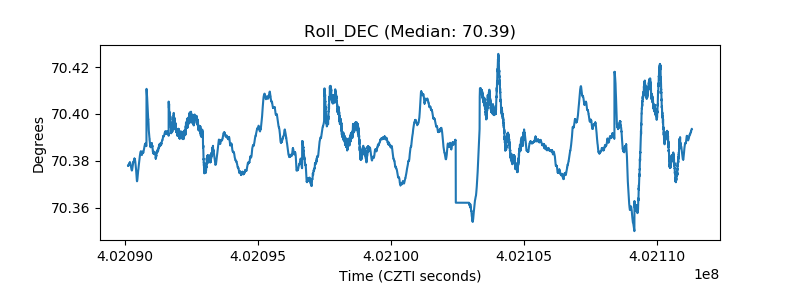 |
| _Roll_RA | 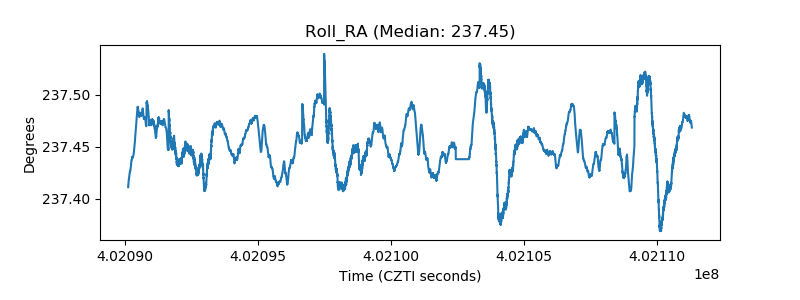 |
| Veto Counter | 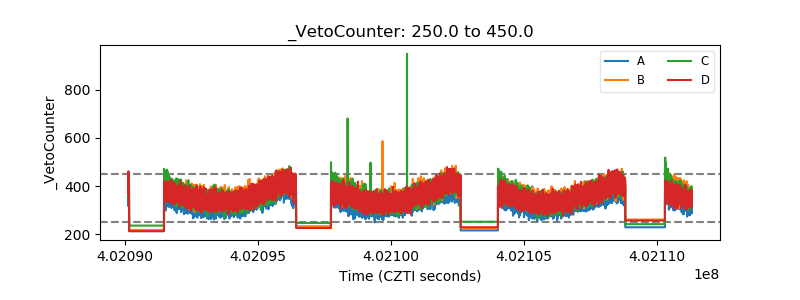 |