| Param | Original file | Final file |
|---|---|---|
| Filename | modeM0/AS1C07_001T12_9000005352_37865cztM0_level2.evt | modeM0/AS1C07_001T12_9000005352_37865cztM0_level2_quad_clean.evt |
| Size (bytes) | 433,290,240 | 88,574,400 |
| Size | 413.2 MB | 84.5 MB |
| Events in quadrant A | 2,723,159 | 590,081 |
| Events in quadrant B | 2,962,702 | 591,799 |
| Events in quadrant C | 2,752,507 | 581,600 |
| Events in quadrant D | 4,317,272 | 540,839 |
| Mode M9 | |||
|---|---|---|---|
| Quadrant | BADHDUFLAG | Total packets | Discarded packets |
| A | 0 | 17 | 0 |
| B | 0 | 17 | 0 |
| C | 0 | 17 | 0 |
| D | 0 | 17 | 0 |
| Mode M0 | |||
|---|---|---|---|
| Quadrant | BADHDUFLAG | Total packets | Discarded packets |
| A | 0 | 11431 | 3 |
| B | 0 | 12395 | 2 |
| C | 0 | 11462 | 2 |
| D | 0 | 16670 | 2 |
| Mode SS | |||
|---|---|---|---|
| Quadrant | BADHDUFLAG | Total packets | Discarded packets |
| A | 0 | 110 | 0 |
| B | 0 | 110 | 0 |
| C | 0 | 110 | 0 |
| D | 0 | 110 | 0 |
| Quadrant | Total seconds | Saturated seconds | Saturation percentage |
|---|---|---|---|
| A | 5395 | 7 | 0.129750% |
| B | 5395 | 143 | 2.650602% |
| C | 5395 | 12 | 0.222428% |
| D | 5395 | 359 | 6.654310% |
Noise dominated data is calculated using 1-second bins in cleaned event files. If a bin has >2000 counts, and if more than 50% of those come from <1% of pixels, then it is considered to be noise-dominated and hence unusable.
| Quadrant | # 1 sec bins | Bins with >0 counts | Bins with >2000 counts | High rate bins dominated by noise | Noise dominated (total time) | Noise dominated (detector-on time) | Marked lightcurve |
|---|---|---|---|---|---|---|---|
| A | 7128 | 5396 | 2 | 2 | 0.03% | 0.04% | 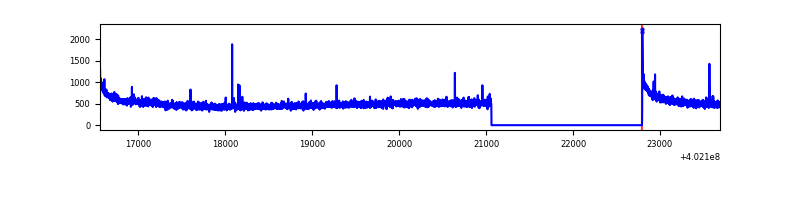 |
| B | 7128 | 5396 | 103 | 103 | 1.45% | 1.91% | 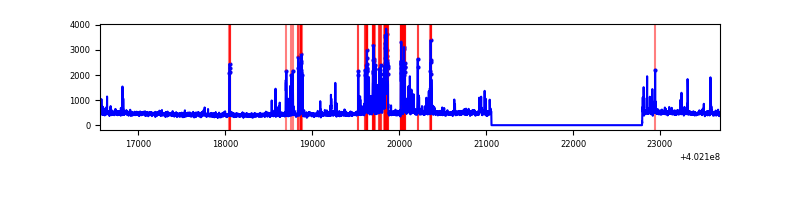 |
| C | 7128 | 5396 | 9 | 9 | 0.13% | 0.17% | 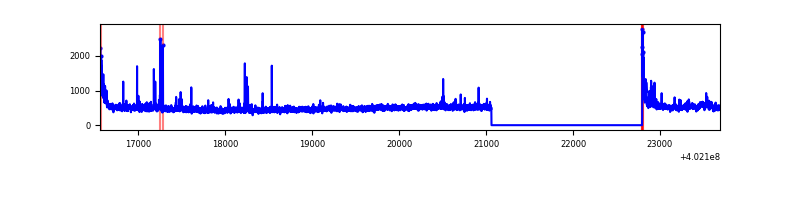 |
| D | 7128 | 5396 | 316 | 316 | 4.43% | 5.86% | 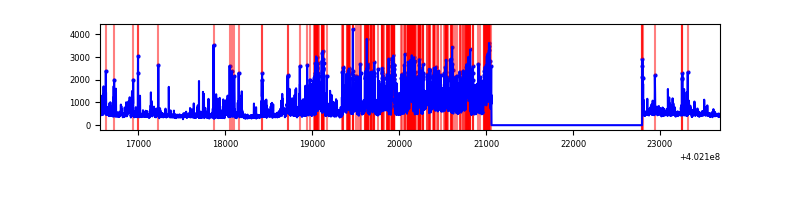 |
Top three noisy pixels from each quadrant. If the there are fewer than three noisy pixels in the level2.evt file, extra rows are filled as -1
| Pixel properties | Quadrant properties | ||||||
|---|---|---|---|---|---|---|---|
| Quadrant | DetID | PixID | Counts | Sigma | Mean | Median | Sigma |
| A | 10 | 83 | 343560 | 2798.93 | 606 | 593 | 122.5 |
| A | 15 | 222 | 12884 | 100.31 | 606 | 593 | 122.5 |
| A | 13 | 6 | 9784 | 75.01 | 606 | 593 | 122.5 |
| B | 5 | 172 | 498119 | 4345.93 | 597 | 582 | 114.5 |
| B | 0 | 229 | 41452 | 357.0 | 597 | 582 | 114.5 |
| B | 0 | 230 | 37479 | 322.29 | 597 | 582 | 114.5 |
| C | 15 | 214 | 226768 | 1675.52 | 582 | 585 | 135.0 |
| C | 0 | 10 | 101563 | 748.03 | 582 | 585 | 135.0 |
| C | 14 | 67 | 80335 | 590.77 | 582 | 585 | 135.0 |
| D | 2 | 249 | 1011865 | 7159.15 | 573 | 556 | 141.3 |
| D | 1 | 52 | 586408 | 4147.3 | 573 | 556 | 141.3 |
| D | 12 | 235 | 118135 | 832.35 | 573 | 556 | 141.3 |
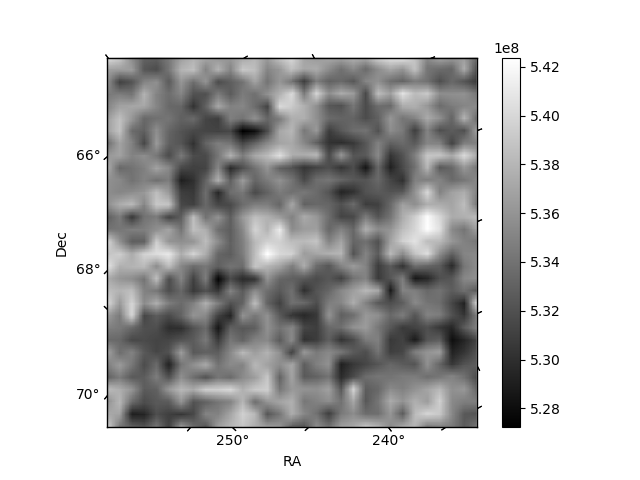
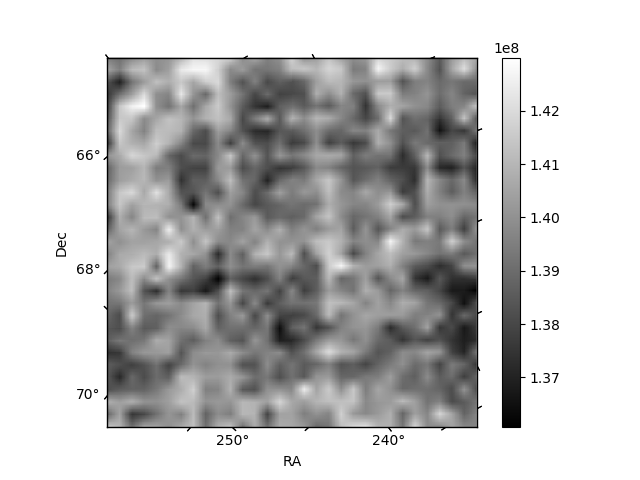
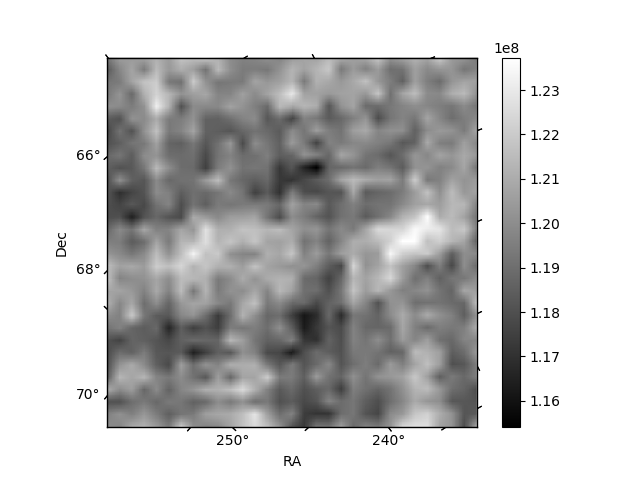
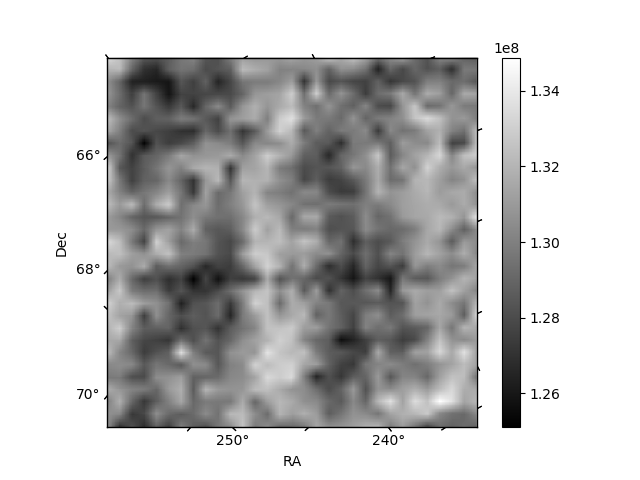
Histogram calculated using DETX and DETY for each event in the final _common_clean file
| Quadrant A | 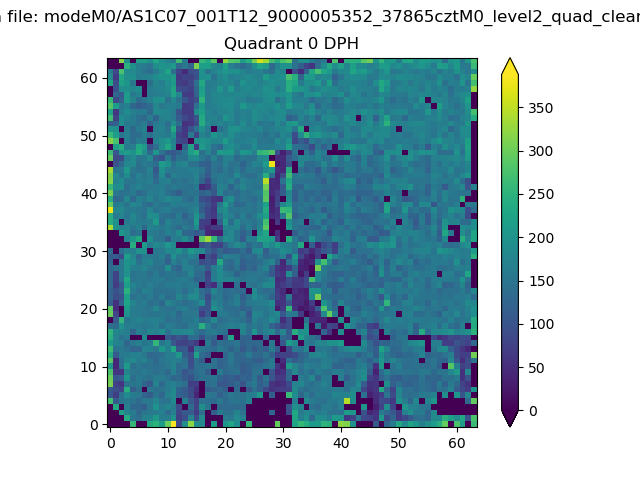 |
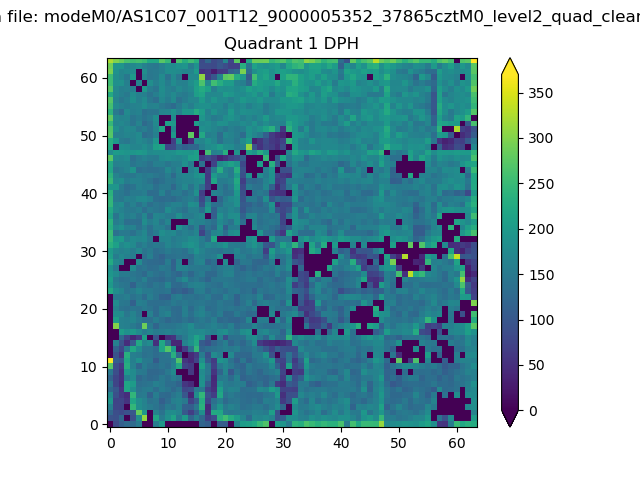 |
Quadrant B |
|---|---|---|---|
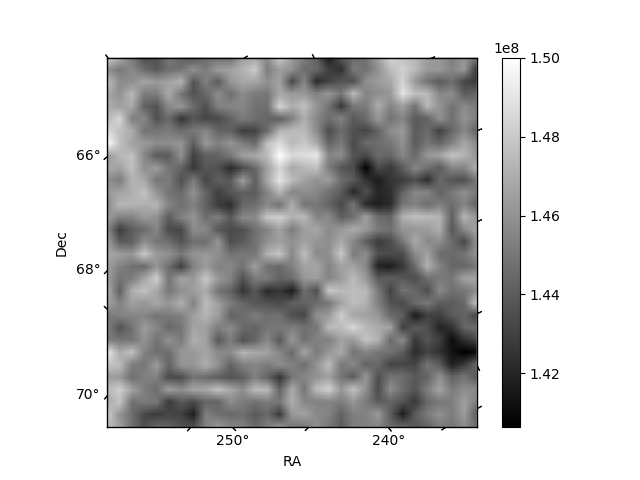
| Quadrant D | 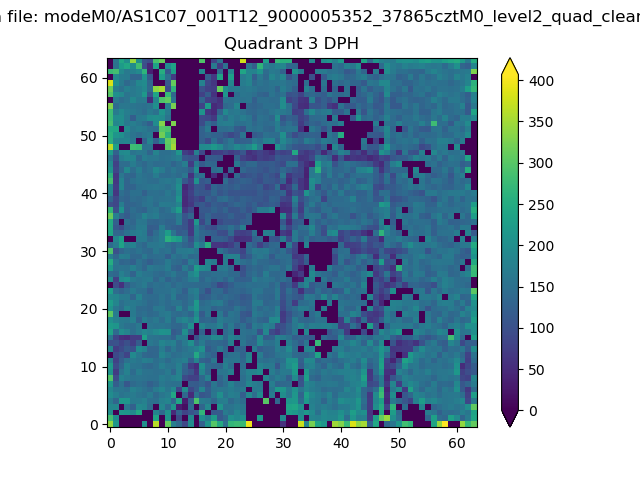 |
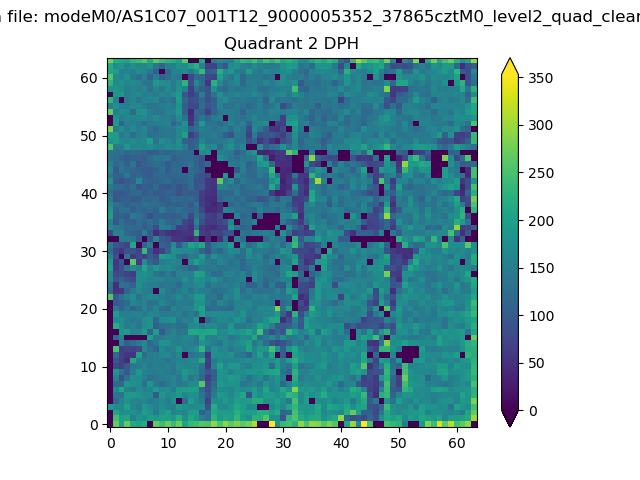 |
Quadrant C |
| Plot type | Count rate plots | Images |
|---|---|---|
| Comparison with Poisson distribution Blue bars denote a histogram of data divided into 1 sec bins. Red curve is a Poisson curve with rate = median count rate of data. |
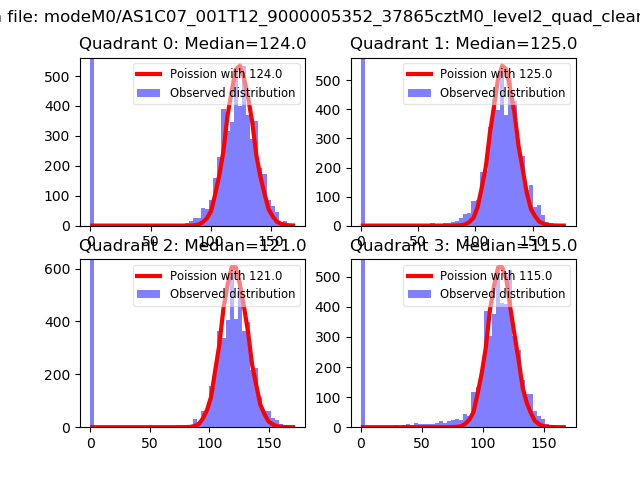 |
 |
| Quadrant-wise count rates Data is divided into 100 sec bins |
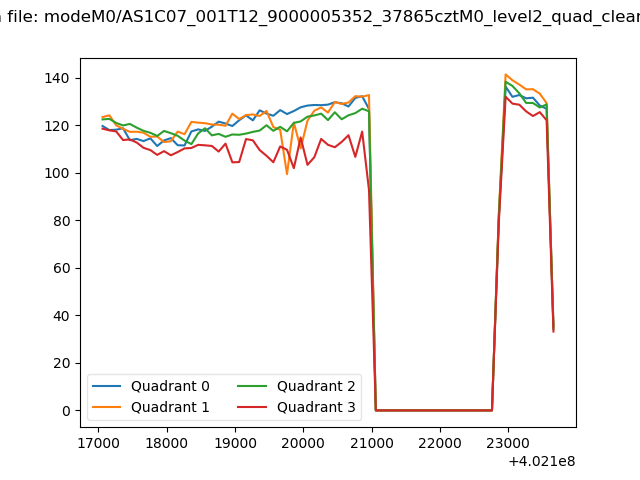 |
|
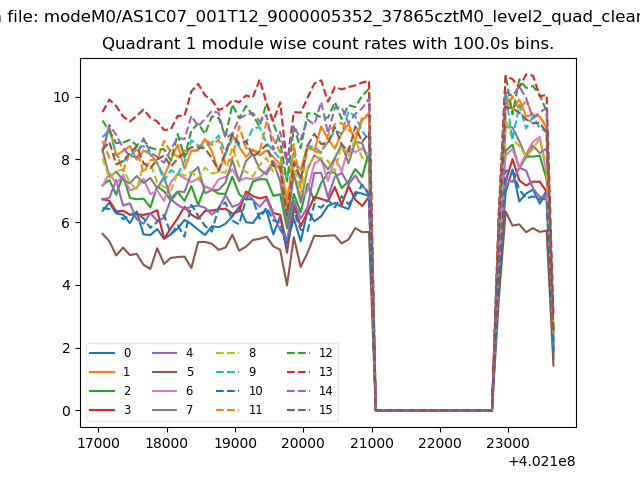
| Module-wise count rates for Quadrant A Data is divided into 100 sec bins |
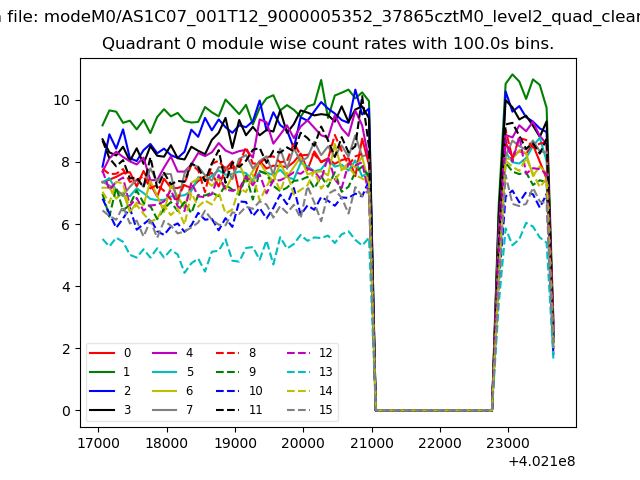 |
 |
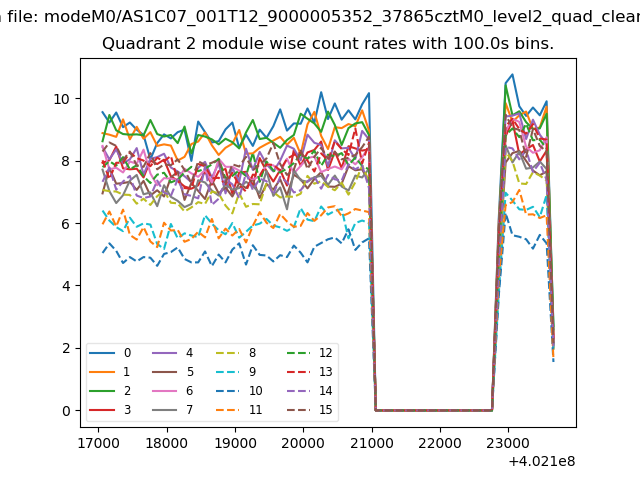
| Module-wise count rates for Quadrant B Data is divided into 100 sec bins |
 |
 |
| Module-wise count rates for Quadrant C Data is divided into 100 sec bins |
 |
 |
| Module-wise count rates for Quadrant D Data is divided into 100 sec bins |
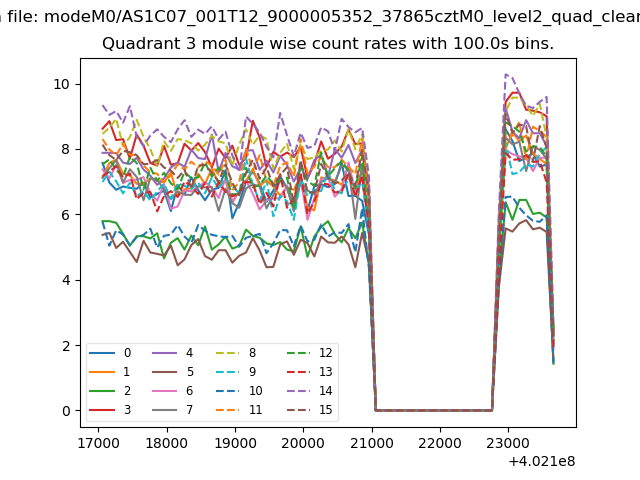 |
 |
| Parameter | Plot |
|---|---|
| CZT HV Monitor | 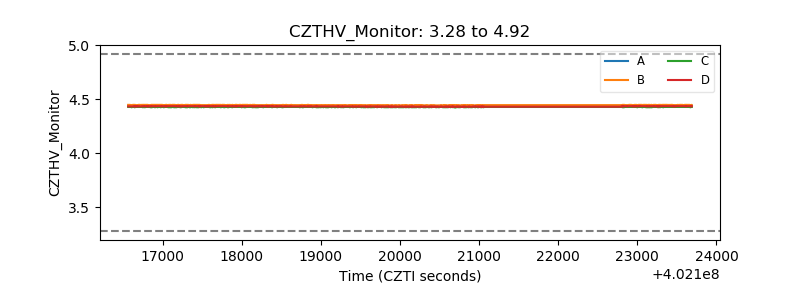 |
| D_VDD | 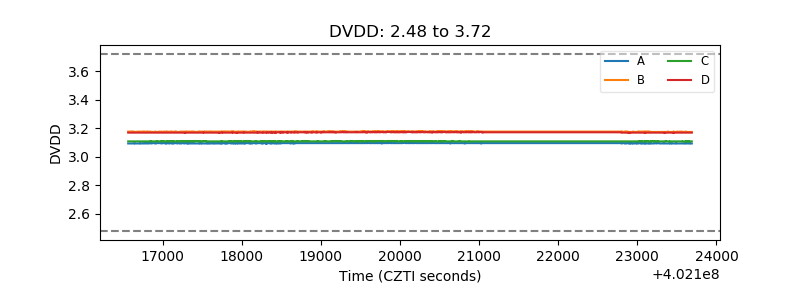 |
| Temperature 1 | 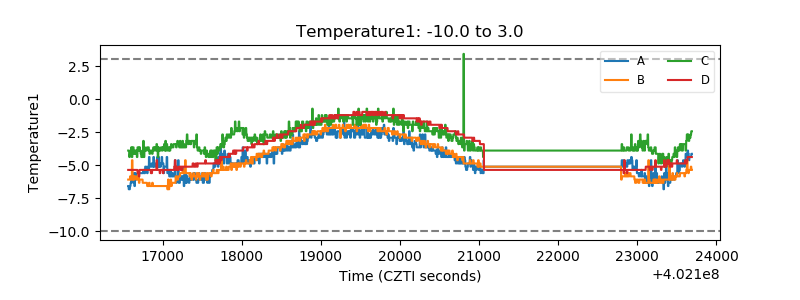 |
| Veto HV Monitor | 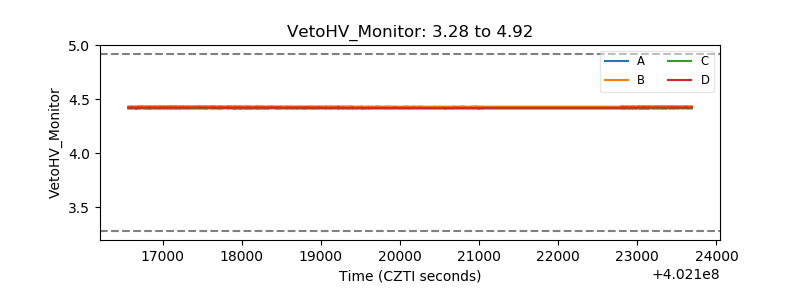 |
| Veto LLD | 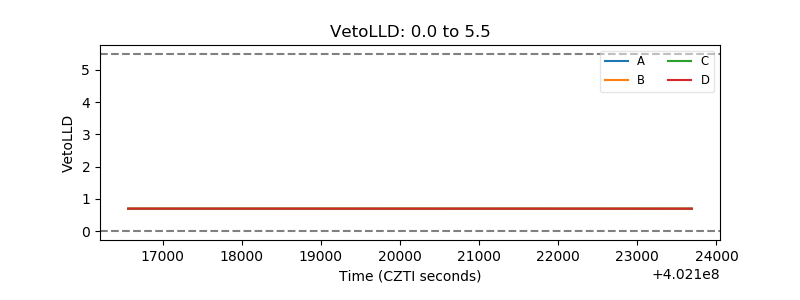 |
| Alpha Counter | 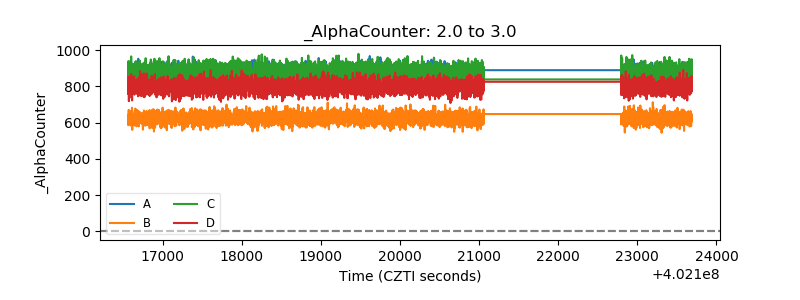 |
| _CPM_Rate | 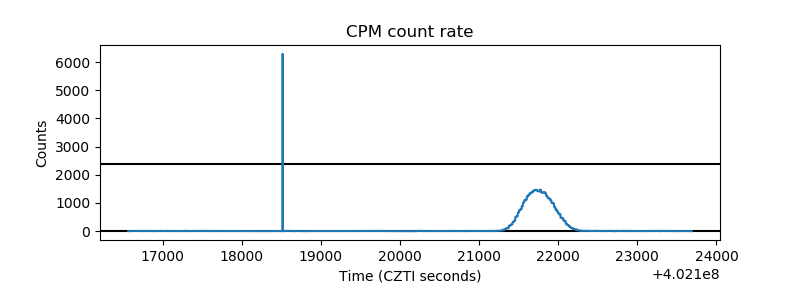 |
| CZT Counter | 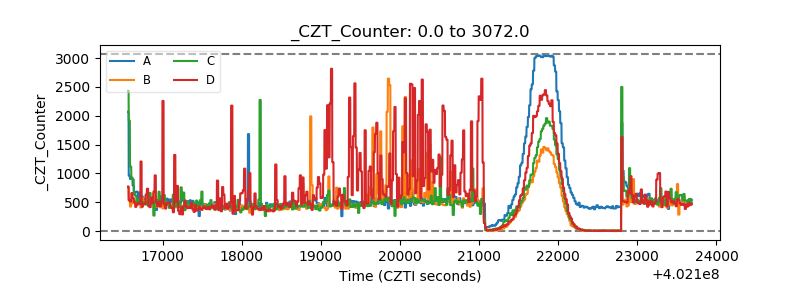 |
| +2.5 Volts monitor | 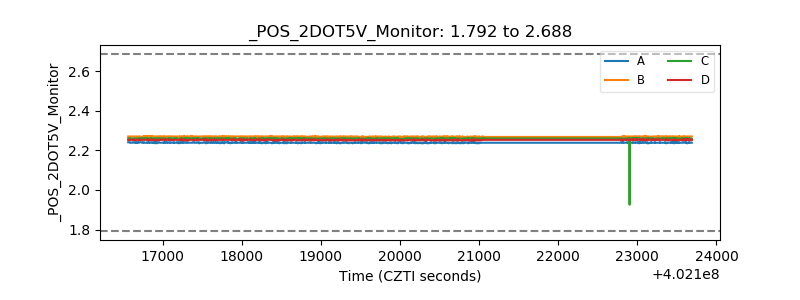 |
| +5 Volts monitor | 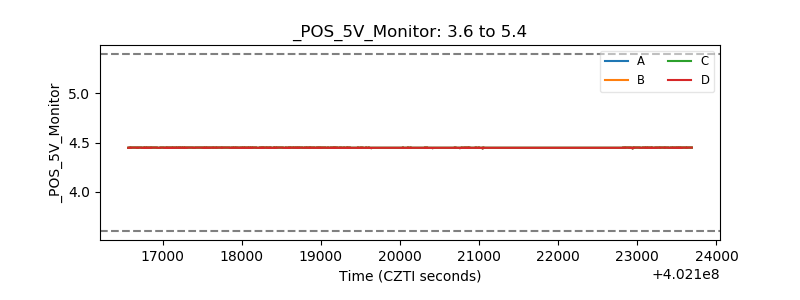 |
| _ROLL_ROT | 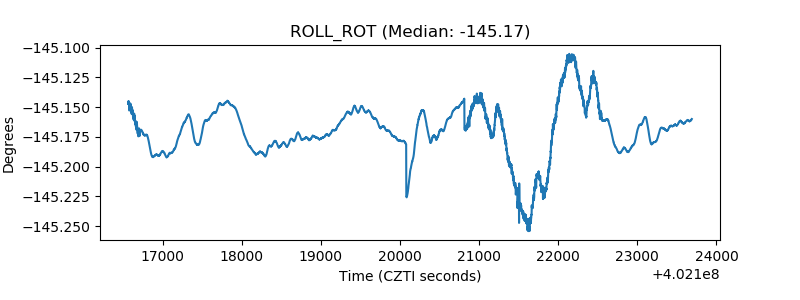 |
| _Roll_DEC | 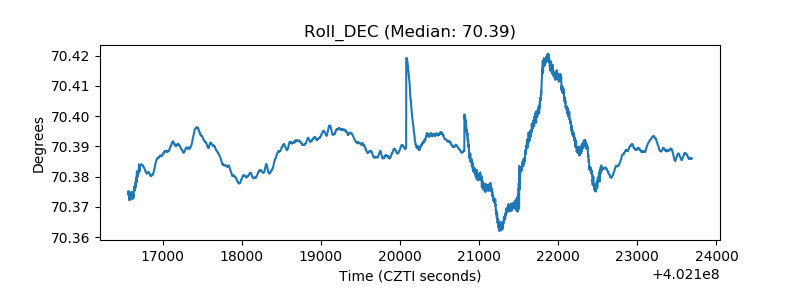 |
| _Roll_RA | 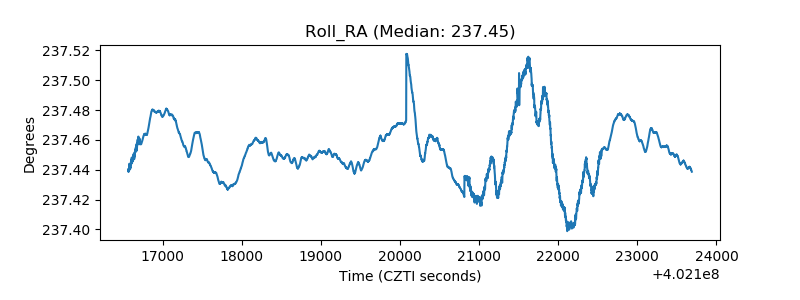 |
| Veto Counter | 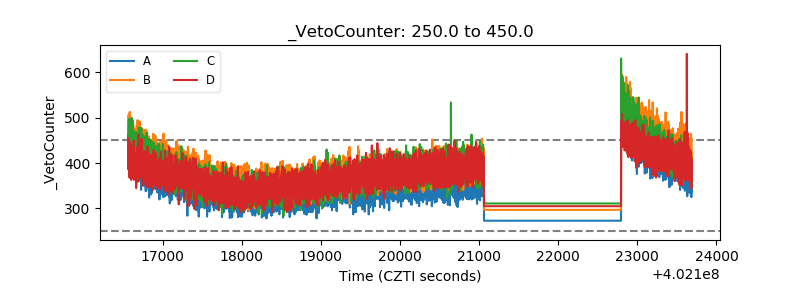 |