| Param | Original file | Final file |
|---|---|---|
| Filename | modeM0/AS1C07_001T12_9000005352_37866cztM0_level2.evt | modeM0/AS1C07_001T12_9000005352_37866cztM0_level2_quad_clean.evt |
| Size (bytes) | 431,530,560 | 98,928,000 |
| Size | 411.5 MB | 94.3 MB |
| Events in quadrant A | 2,725,925 | 675,686 |
| Events in quadrant B | 2,745,781 | 683,205 |
| Events in quadrant C | 2,870,129 | 653,303 |
| Events in quadrant D | 4,371,869 | 617,436 |
| Mode M9 | |||
|---|---|---|---|
| Quadrant | BADHDUFLAG | Total packets | Discarded packets |
| A | 0 | 26 | 0 |
| B | 0 | 26 | 0 |
| C | 0 | 26 | 0 |
| D | 0 | 27 | 0 |
| Mode M0 | |||
|---|---|---|---|
| Quadrant | BADHDUFLAG | Total packets | Discarded packets |
| A | 0 | 11267 | 3 |
| B | 0 | 11486 | 2 |
| C | 0 | 11500 | 2 |
| D | 0 | 16484 | 2 |
| Mode SS | |||
|---|---|---|---|
| Quadrant | BADHDUFLAG | Total packets | Discarded packets |
| A | 0 | 106 | 0 |
| B | 0 | 106 | 0 |
| C | 0 | 106 | 0 |
| D | 0 | 106 | 0 |
| Quadrant | Total seconds | Saturated seconds | Saturation percentage |
|---|---|---|---|
| A | 5234 | 12 | 0.229270% |
| B | 5234 | 73 | 1.394727% |
| C | 5234 | 23 | 0.439434% |
| D | 5234 | 228 | 4.356133% |
Noise dominated data is calculated using 1-second bins in cleaned event files. If a bin has >2000 counts, and if more than 50% of those come from <1% of pixels, then it is considered to be noise-dominated and hence unusable.
| Quadrant | # 1 sec bins | Bins with >0 counts | Bins with >2000 counts | High rate bins dominated by noise | Noise dominated (total time) | Noise dominated (detector-on time) | Marked lightcurve |
|---|---|---|---|---|---|---|---|
| A | 7116 | 5235 | 5 | 5 | 0.07% | 0.10% | 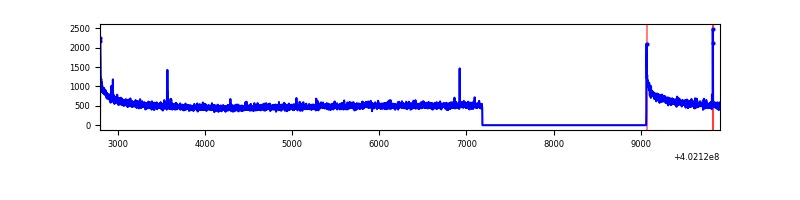 |
| B | 7116 | 5235 | 47 | 47 | 0.66% | 0.90% | 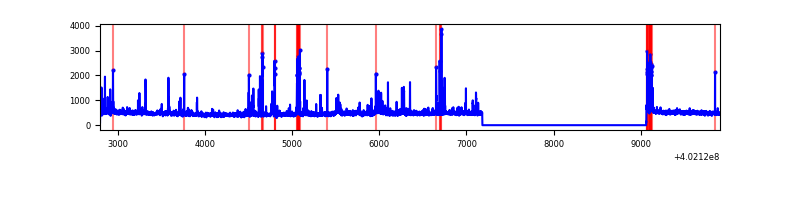 |
| C | 7116 | 5235 | 13 | 13 | 0.18% | 0.25% | 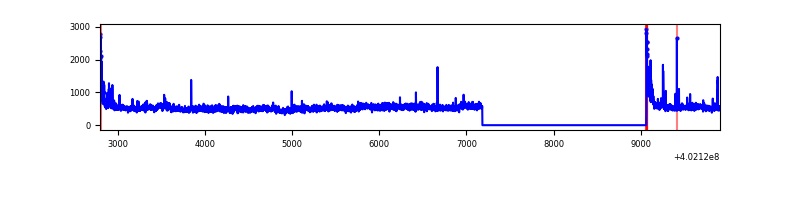 |
| D | 7116 | 5235 | 260 | 260 | 3.65% | 4.97% | 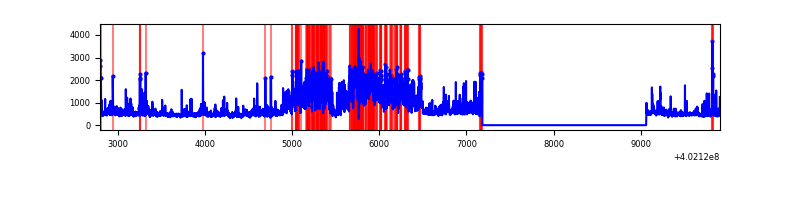 |
Top three noisy pixels from each quadrant. If the there are fewer than three noisy pixels in the level2.evt file, extra rows are filled as -1
| Pixel properties | Quadrant properties | ||||||
|---|---|---|---|---|---|---|---|
| Quadrant | DetID | PixID | Counts | Sigma | Mean | Median | Sigma |
| A | 10 | 83 | 344064 | 2830.93 | 609 | 598 | 121.3 |
| A | 13 | 6 | 14436 | 114.06 | 609 | 598 | 121.3 |
| A | 13 | 254 | 6497 | 48.62 | 609 | 598 | 121.3 |
| B | 5 | 172 | 276570 | 2433.62 | 599 | 583 | 113.4 |
| B | 0 | 229 | 52703 | 459.59 | 599 | 583 | 113.4 |
| B | 0 | 230 | 32746 | 283.61 | 599 | 583 | 113.4 |
| C | 14 | 67 | 242568 | 1799.39 | 578 | 579 | 134.5 |
| C | 15 | 214 | 221437 | 1642.27 | 578 | 579 | 134.5 |
| C | 0 | 10 | 106247 | 785.73 | 578 | 579 | 134.5 |
| D | 12 | 235 | 1536321 | 10823.0 | 580 | 563 | 141.9 |
| D | 2 | 250 | 140563 | 986.63 | 580 | 563 | 141.9 |
| D | 2 | 249 | 133159 | 934.45 | 580 | 563 | 141.9 |
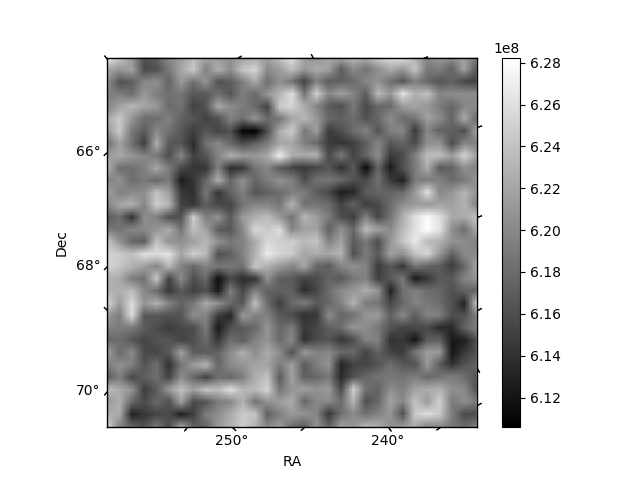
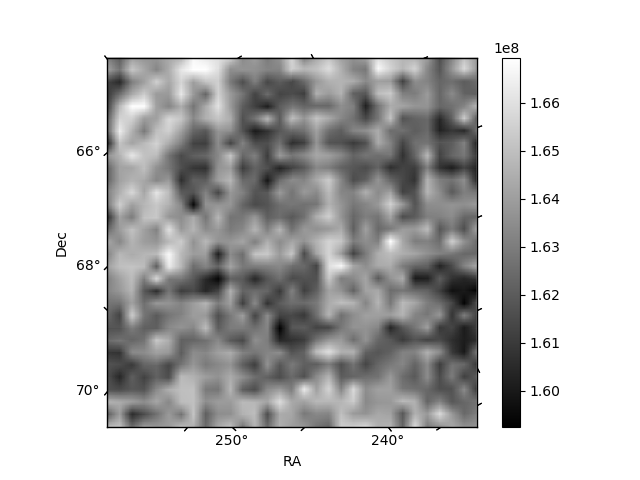
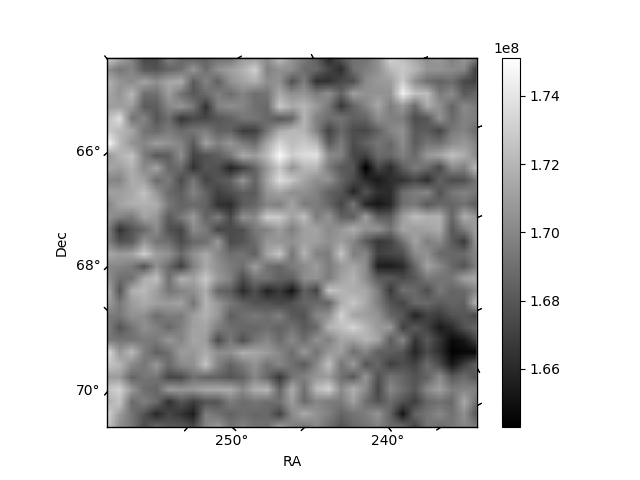
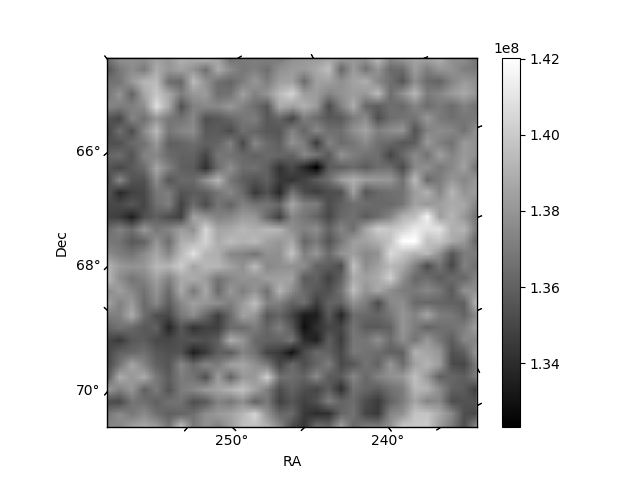
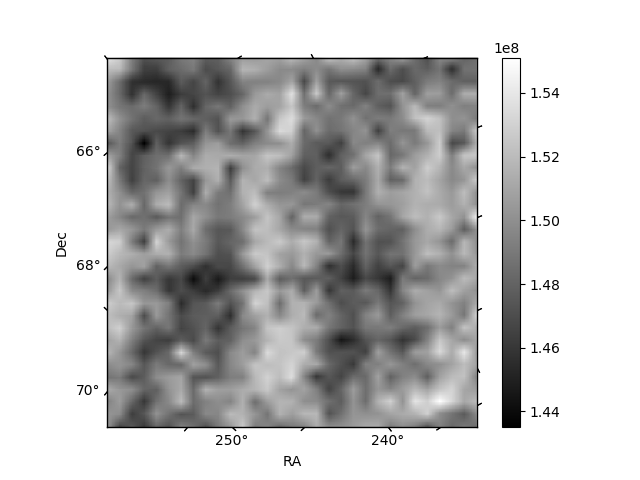
Histogram calculated using DETX and DETY for each event in the final _common_clean file
| Quadrant A | 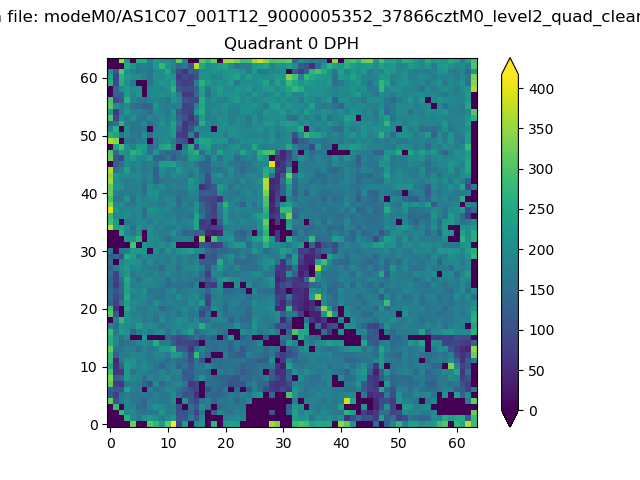 |
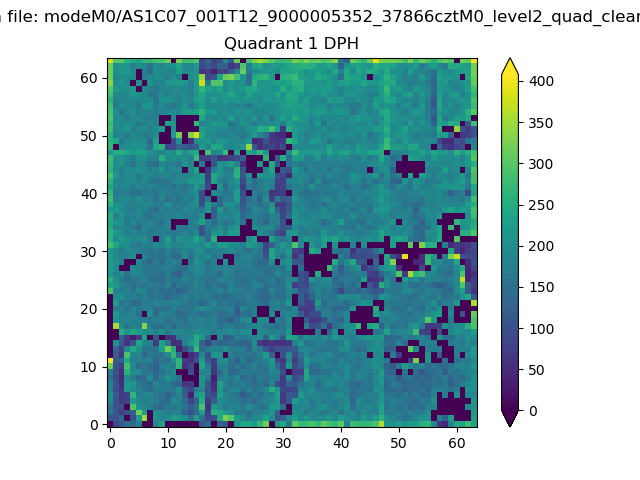 |
Quadrant B |
|---|---|---|---|
| Quadrant D | 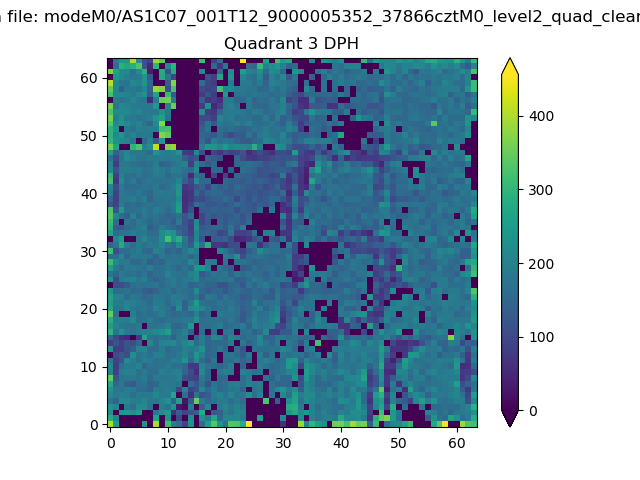 |
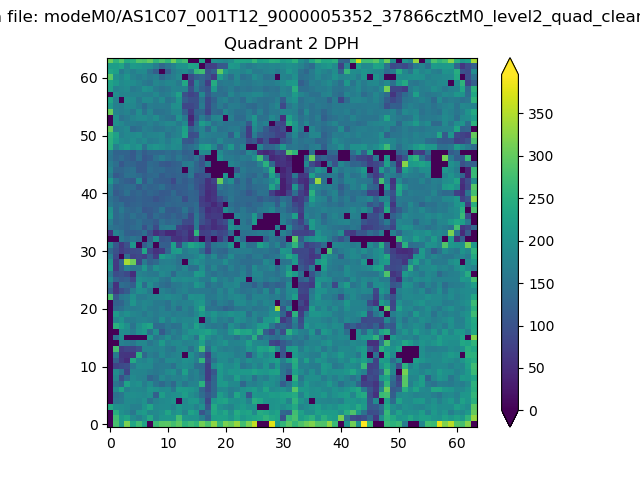 |
Quadrant C |
| Plot type | Count rate plots | Images |
|---|---|---|
| Comparison with Poisson distribution Blue bars denote a histogram of data divided into 1 sec bins. Red curve is a Poisson curve with rate = median count rate of data. |
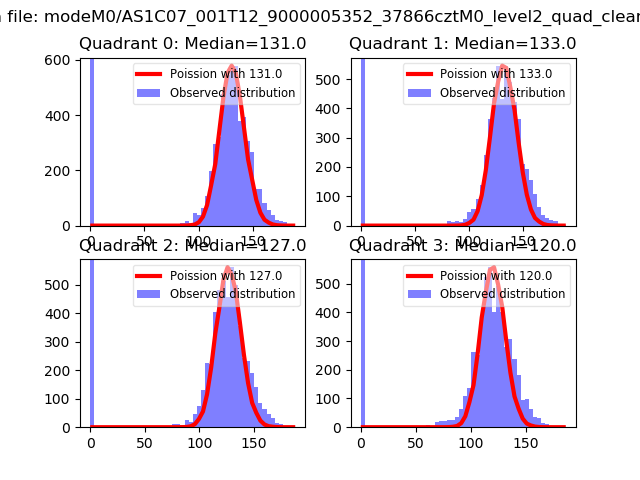 |
 |
| Quadrant-wise count rates Data is divided into 100 sec bins |
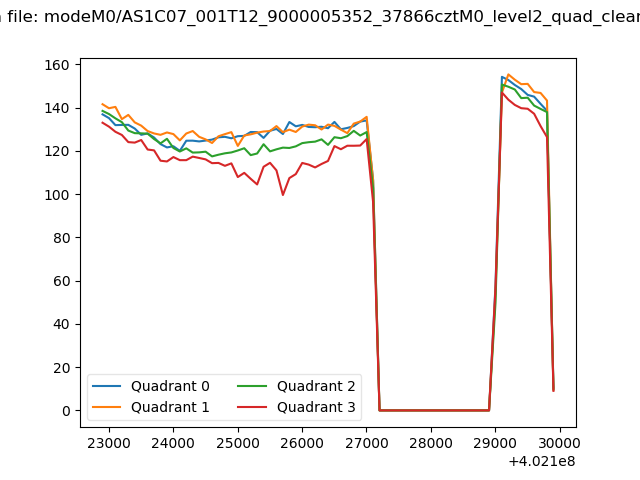 |
|
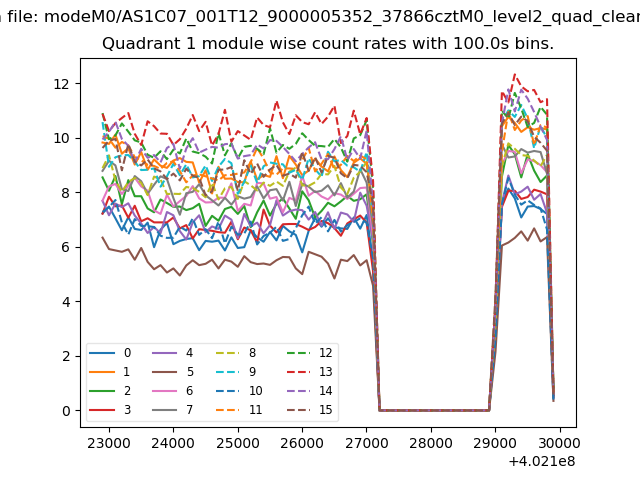
| Module-wise count rates for Quadrant A Data is divided into 100 sec bins |
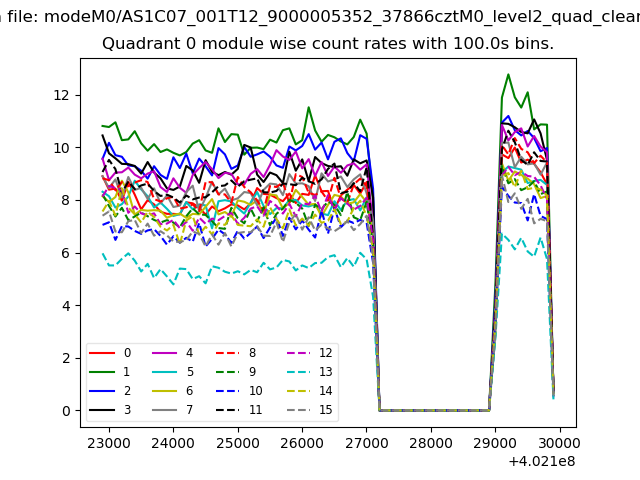 |
 |
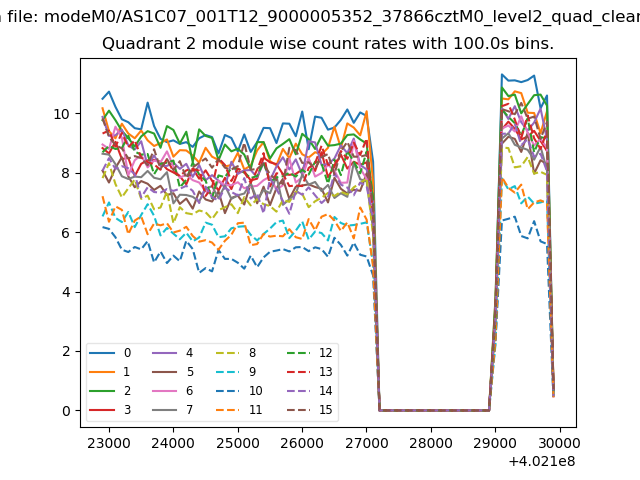
| Module-wise count rates for Quadrant B Data is divided into 100 sec bins |
 |
 |
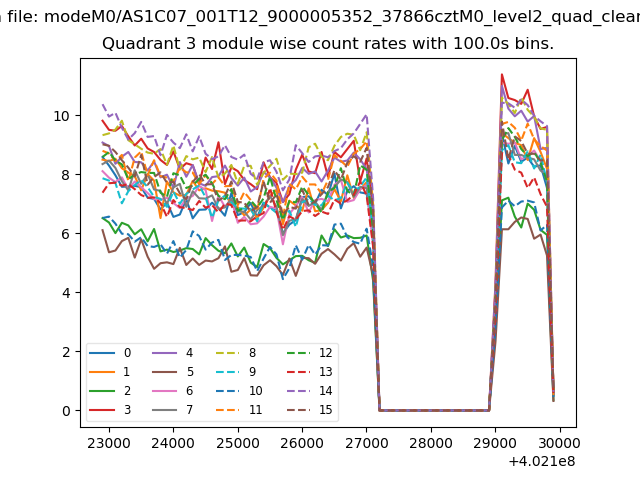
| Module-wise count rates for Quadrant C Data is divided into 100 sec bins |
 |
 |
| Module-wise count rates for Quadrant D Data is divided into 100 sec bins |
 |
 |
| Parameter | Plot |
|---|---|
| CZT HV Monitor | 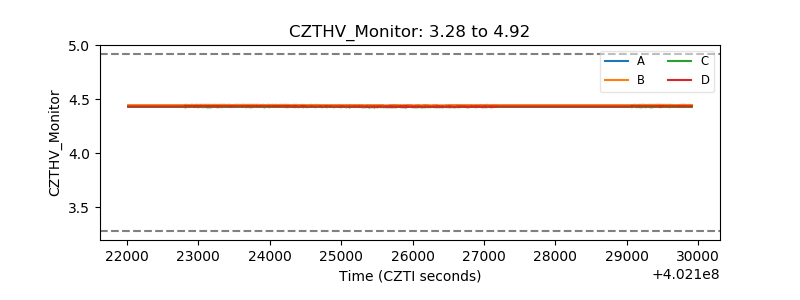 |
| D_VDD | 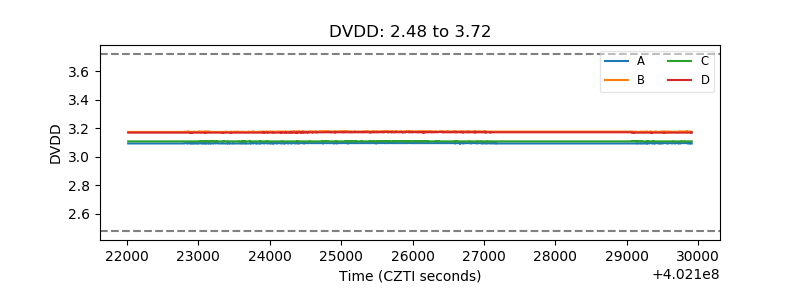 |
| Temperature 1 | 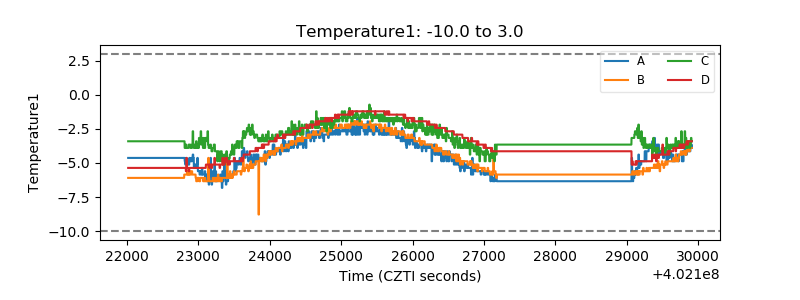 |
| Veto HV Monitor | 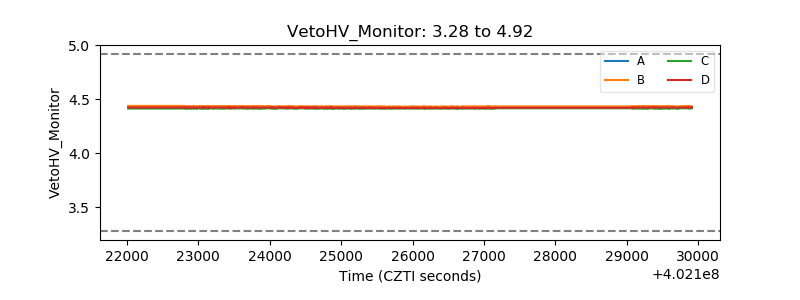 |
| Veto LLD | 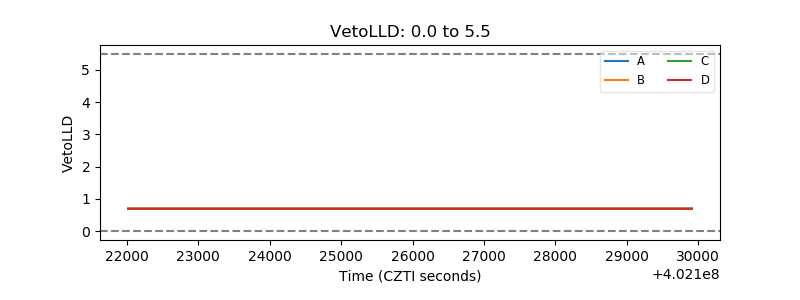 |
| Alpha Counter | 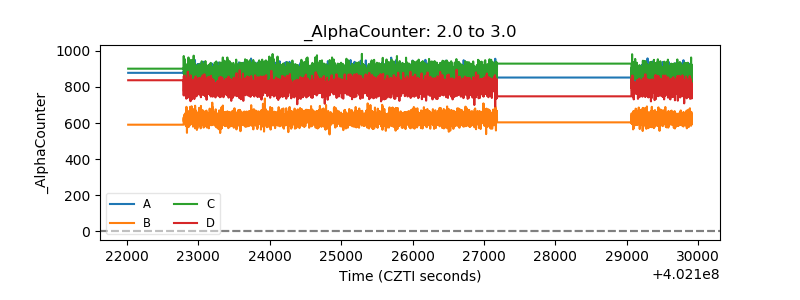 |
| _CPM_Rate | 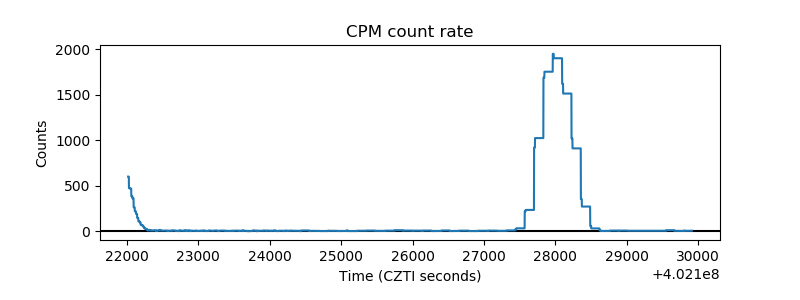 |
| CZT Counter | 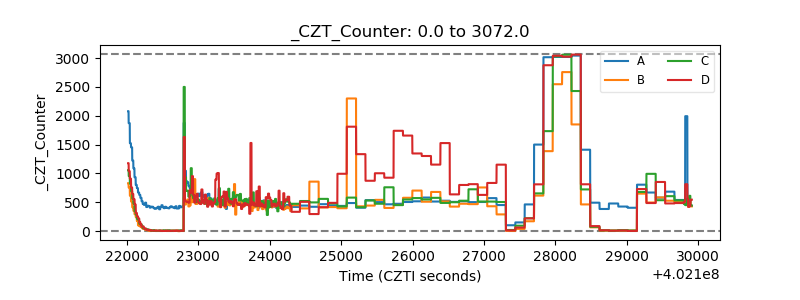 |
| +2.5 Volts monitor | 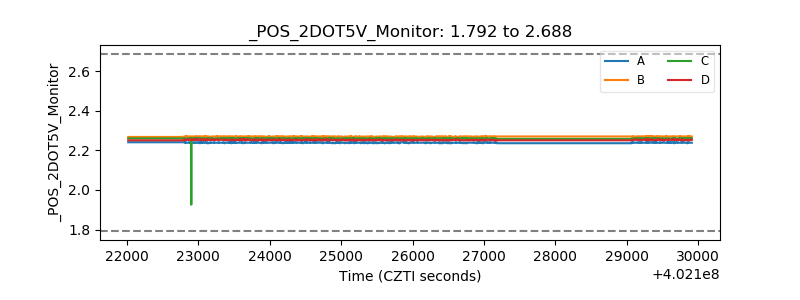 |
| +5 Volts monitor | 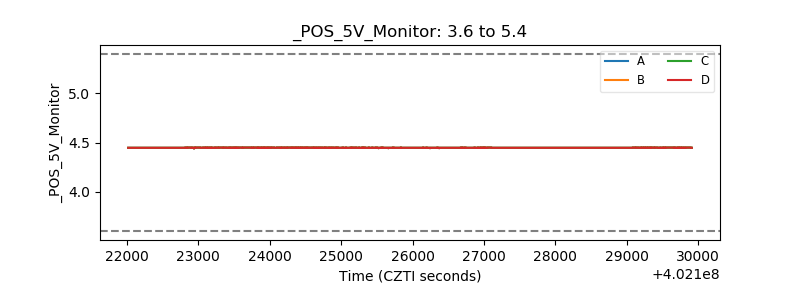 |
| _ROLL_ROT | 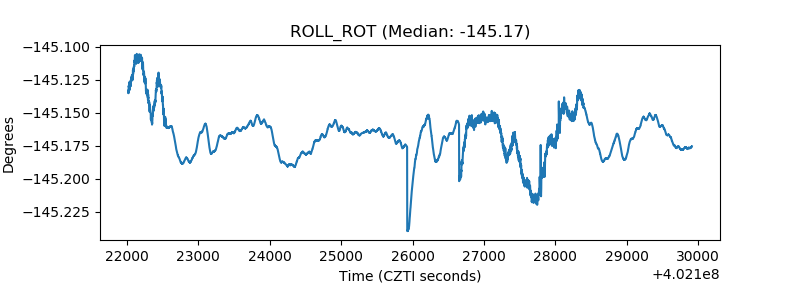 |
| _Roll_DEC | 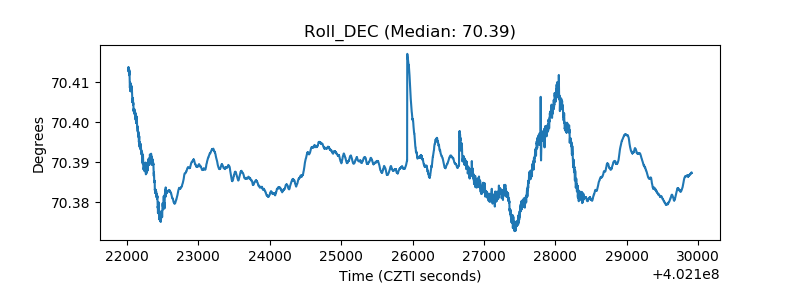 |
| _Roll_RA | 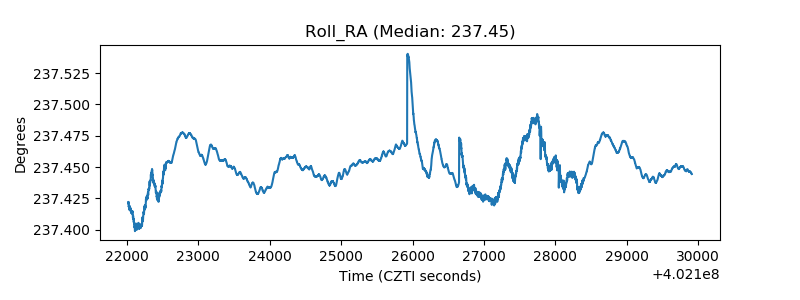 |
| Veto Counter | 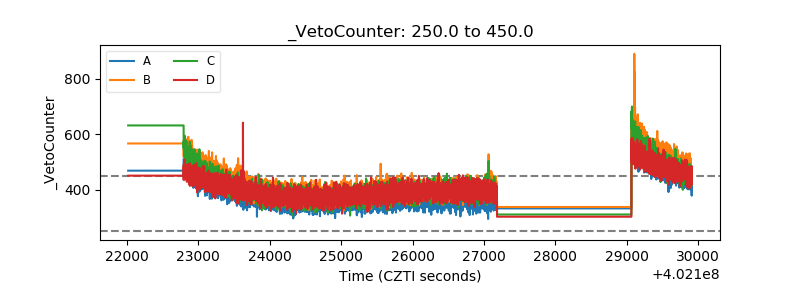 |