| Param | Original file | Final file |
|---|---|---|
| Filename | modeM0/AS1C07_001T12_9000005352_37867cztM0_level2.evt | modeM0/AS1C07_001T12_9000005352_37867cztM0_level2_quad_clean.evt |
| Size (bytes) | 404,997,120 | 102,695,040 |
| Size | 386.2 MB | 97.9 MB |
| Events in quadrant A | 2,754,287 | 714,588 |
| Events in quadrant B | 2,909,507 | 714,125 |
| Events in quadrant C | 2,683,069 | 677,929 |
| Events in quadrant D | 3,574,293 | 648,780 |
| Mode M9 | |||
|---|---|---|---|
| Quadrant | BADHDUFLAG | Total packets | Discarded packets |
| A | 0 | 22 | 0 |
| B | 0 | 22 | 0 |
| C | 0 | 22 | 0 |
| D | 0 | 23 | 0 |
| Mode M0 | |||
|---|---|---|---|
| Quadrant | BADHDUFLAG | Total packets | Discarded packets |
| A | 0 | 11104 | 3 |
| B | 0 | 11669 | 2 |
| C | 0 | 10841 | 2 |
| D | 0 | 13940 | 2 |
| Mode SS | |||
|---|---|---|---|
| Quadrant | BADHDUFLAG | Total packets | Discarded packets |
| A | 0 | 104 | 0 |
| B | 0 | 104 | 0 |
| C | 0 | 104 | 0 |
| D | 0 | 104 | 0 |
| Quadrant | Total seconds | Saturated seconds | Saturation percentage |
|---|---|---|---|
| A | 5061 | 17 | 0.335902% |
| B | 5061 | 121 | 2.390832% |
| C | 5061 | 28 | 0.553250% |
| D | 5061 | 191 | 3.773958% |
Noise dominated data is calculated using 1-second bins in cleaned event files. If a bin has >2000 counts, and if more than 50% of those come from <1% of pixels, then it is considered to be noise-dominated and hence unusable.
| Quadrant | # 1 sec bins | Bins with >0 counts | Bins with >2000 counts | High rate bins dominated by noise | Noise dominated (total time) | Noise dominated (detector-on time) | Marked lightcurve |
|---|---|---|---|---|---|---|---|
| A | 7064 | 5062 | 8 | 8 | 0.11% | 0.16% | 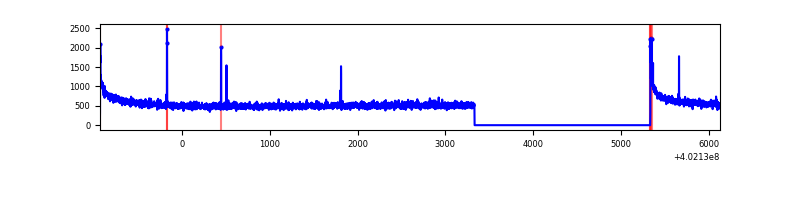 |
| B | 7064 | 5062 | 91 | 91 | 1.29% | 1.80% | 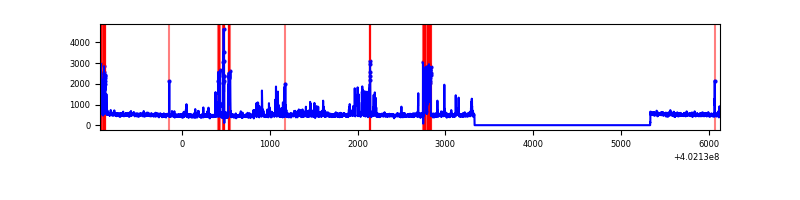 |
| C | 7064 | 5062 | 24 | 24 | 0.34% | 0.47% | 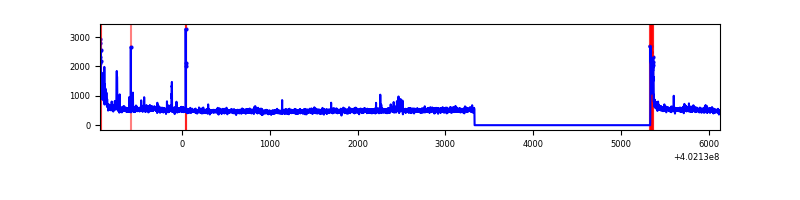 |
| D | 7064 | 5062 | 154 | 154 | 2.18% | 3.04% | 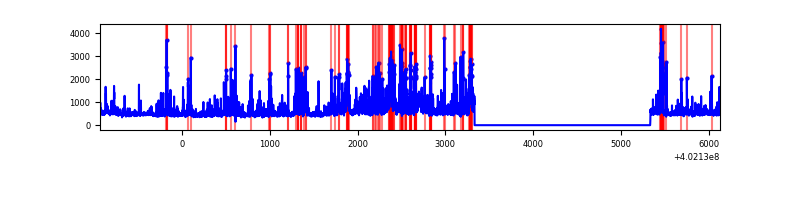 |
Top three noisy pixels from each quadrant. If the there are fewer than three noisy pixels in the level2.evt file, extra rows are filled as -1
| Pixel properties | Quadrant properties | ||||||
|---|---|---|---|---|---|---|---|
| Quadrant | DetID | PixID | Counts | Sigma | Mean | Median | Sigma |
| A | 10 | 83 | 341562 | 2816.73 | 613 | 602 | 121.0 |
| A | 13 | 6 | 13842 | 109.38 | 613 | 602 | 121.0 |
| A | 7 | 3 | 12097 | 94.96 | 613 | 602 | 121.0 |
| B | 5 | 172 | 441215 | 3941.35 | 597 | 584 | 111.8 |
| B | 0 | 229 | 67430 | 597.92 | 597 | 584 | 111.8 |
| B | 0 | 230 | 36594 | 322.1 | 597 | 584 | 111.8 |
| C | 15 | 214 | 215402 | 1630.43 | 575 | 579 | 131.8 |
| C | 0 | 10 | 127983 | 966.95 | 575 | 579 | 131.8 |
| C | 14 | 67 | 49041 | 367.81 | 575 | 579 | 131.8 |
| D | 2 | 249 | 590647 | 4180.33 | 582 | 566 | 141.2 |
| D | 1 | 52 | 243960 | 1724.28 | 582 | 566 | 141.2 |
| D | 13 | 200 | 147106 | 1038.14 | 582 | 566 | 141.2 |
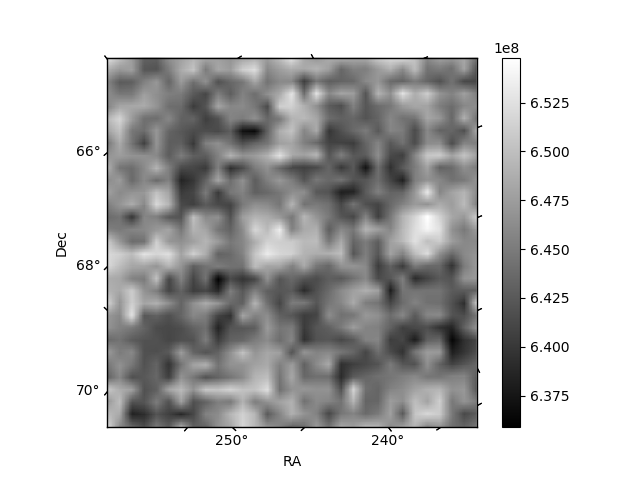
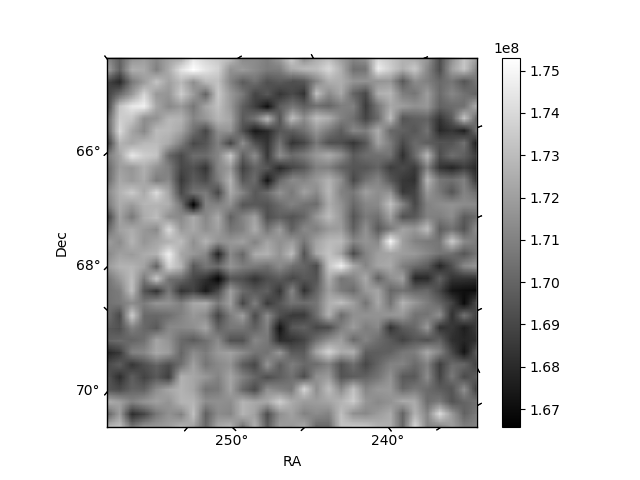
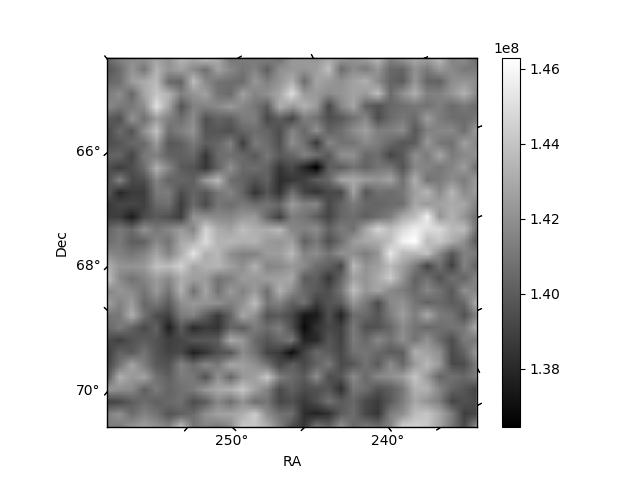
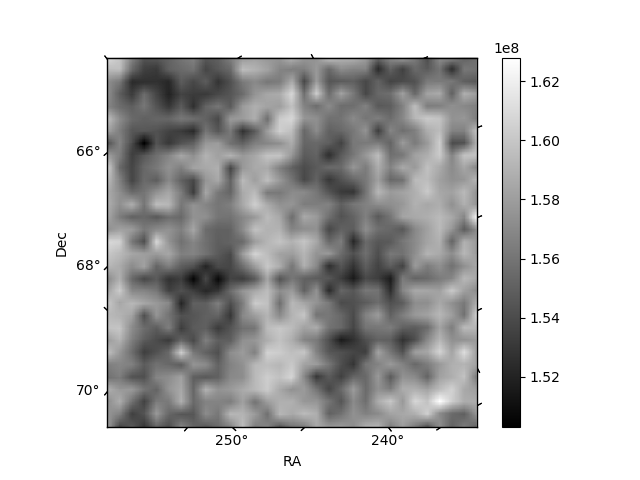
Histogram calculated using DETX and DETY for each event in the final _common_clean file
| Quadrant A | 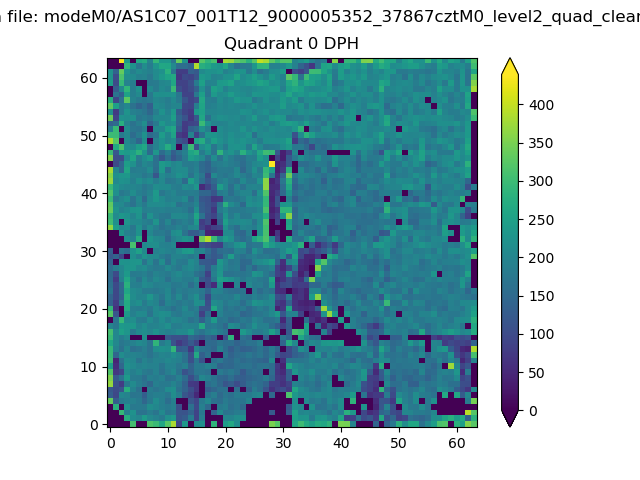 |
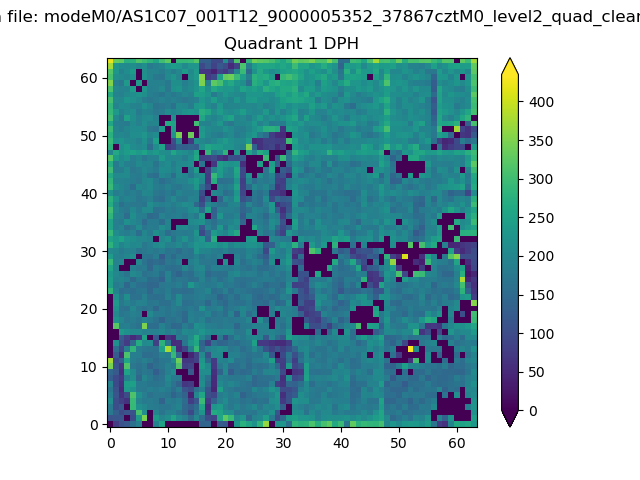 |
Quadrant B |
|---|---|---|---|
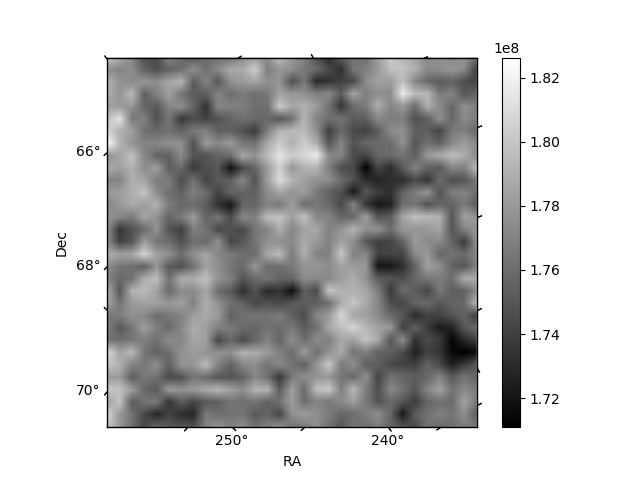
| Quadrant D | 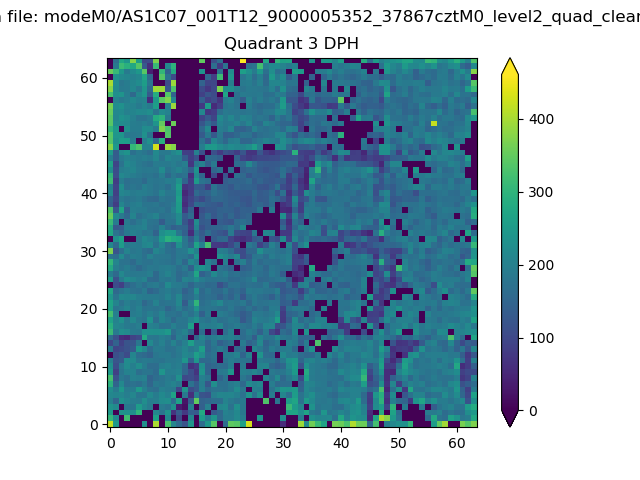 |
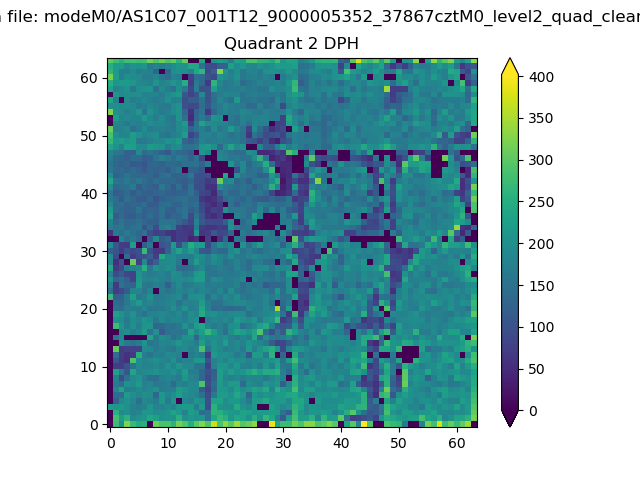 |
Quadrant C |
| Plot type | Count rate plots | Images |
|---|---|---|
| Comparison with Poisson distribution Blue bars denote a histogram of data divided into 1 sec bins. Red curve is a Poisson curve with rate = median count rate of data. |
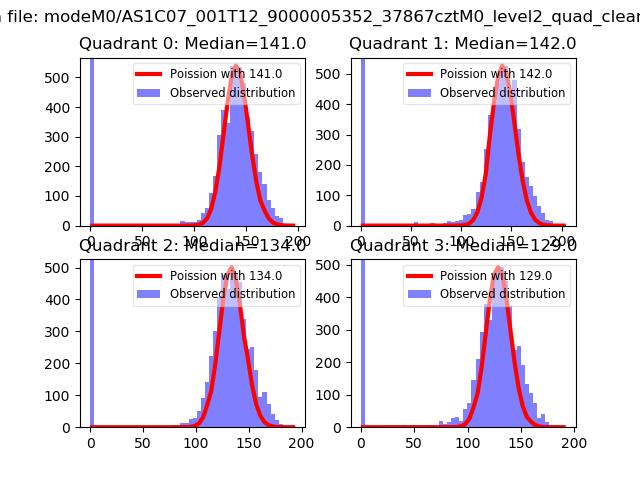 |
 |
| Quadrant-wise count rates Data is divided into 100 sec bins |
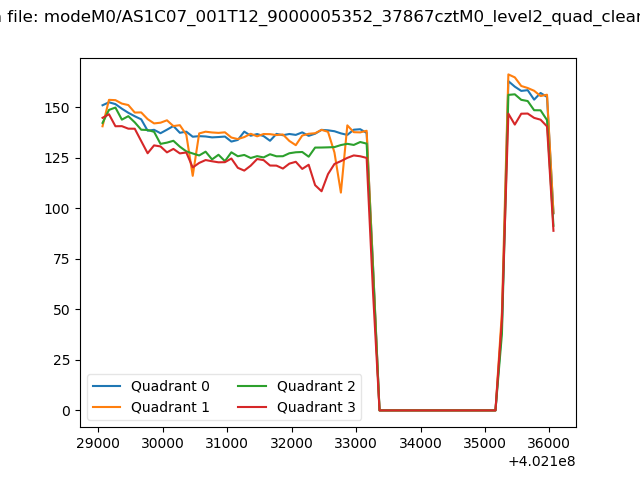 |
|
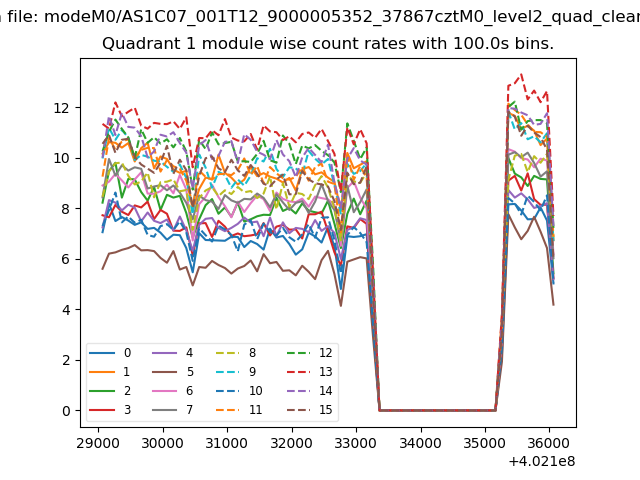
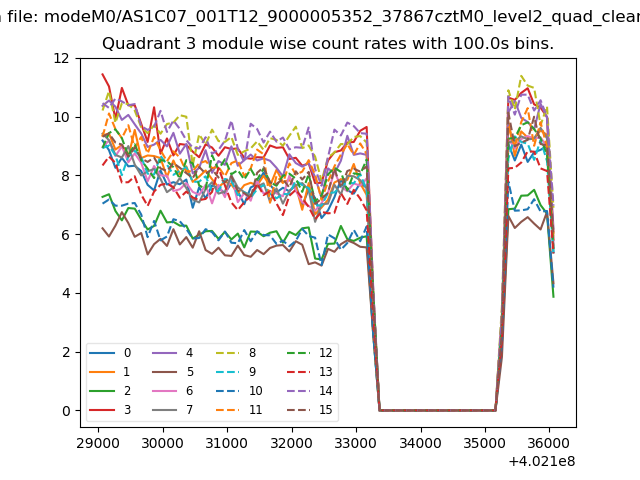
| Module-wise count rates for Quadrant A Data is divided into 100 sec bins |
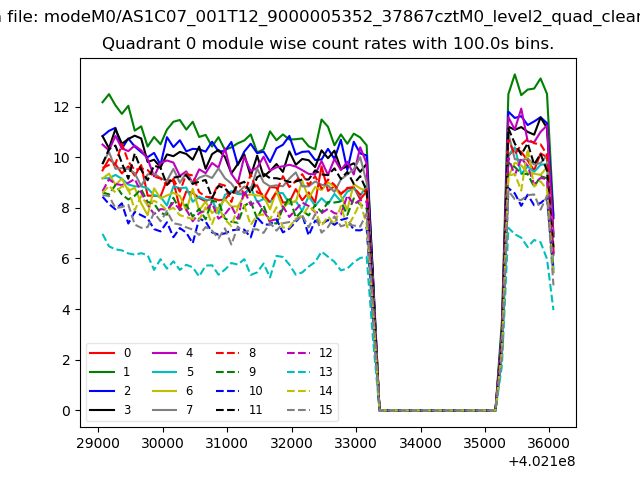 |
 |
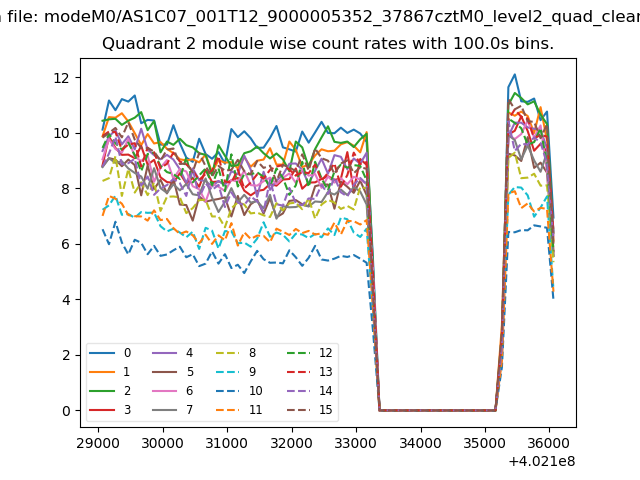
| Module-wise count rates for Quadrant B Data is divided into 100 sec bins |
 |
 |
| Module-wise count rates for Quadrant C Data is divided into 100 sec bins |
 |
 |
| Module-wise count rates for Quadrant D Data is divided into 100 sec bins |
 |
 |
| Parameter | Plot |
|---|---|
| CZT HV Monitor | 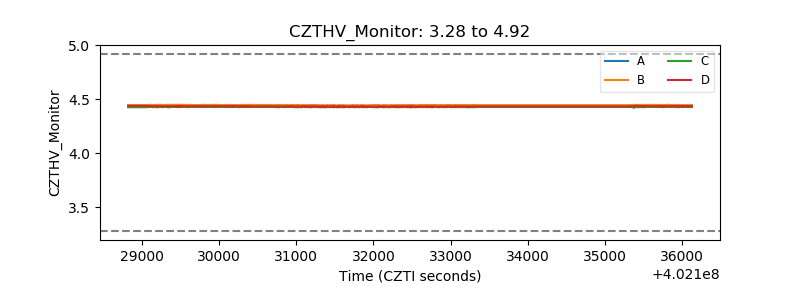 |
| D_VDD | 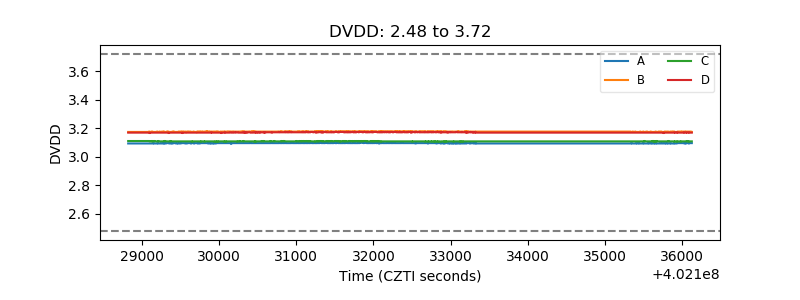 |
| Temperature 1 | 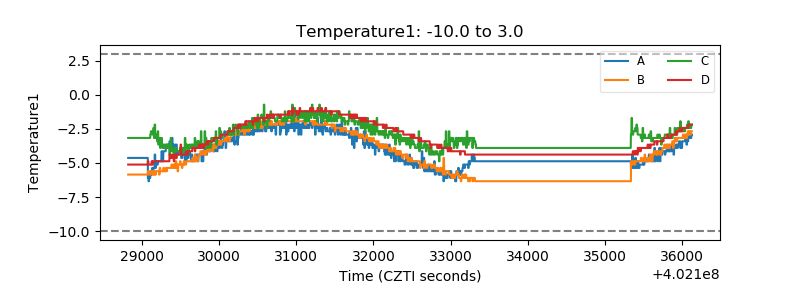 |
| Veto HV Monitor | 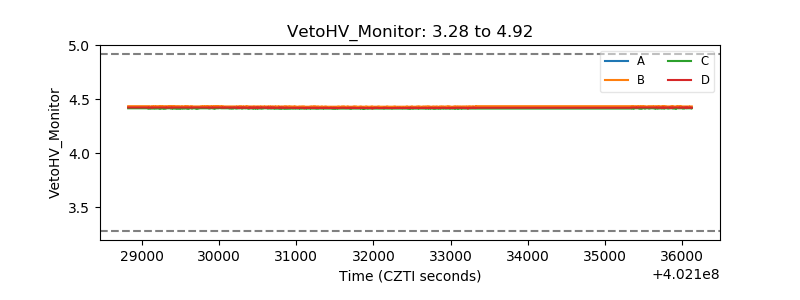 |
| Veto LLD | 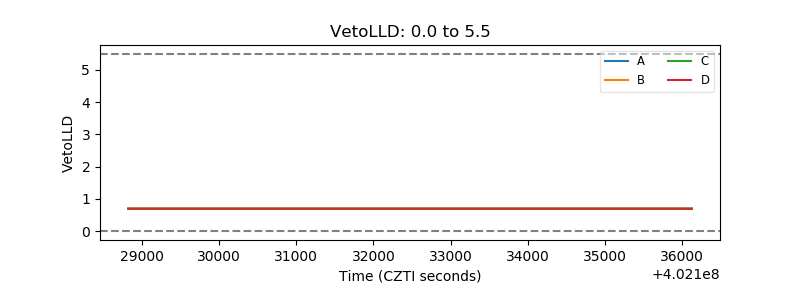 |
| Alpha Counter | 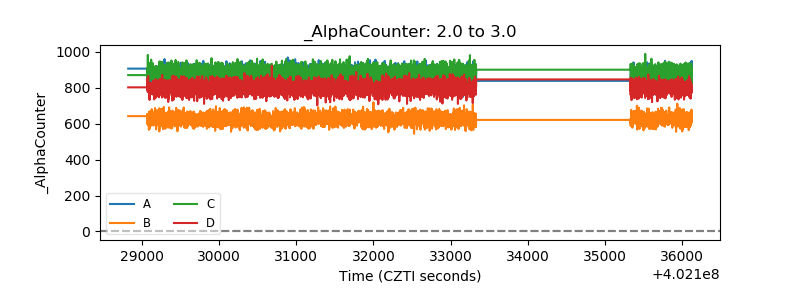 |
| _CPM_Rate | 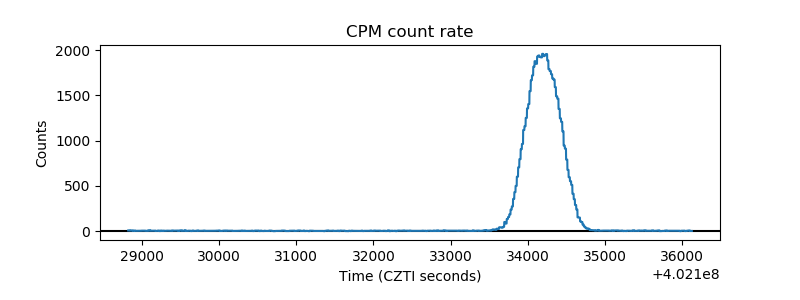 |
| CZT Counter | 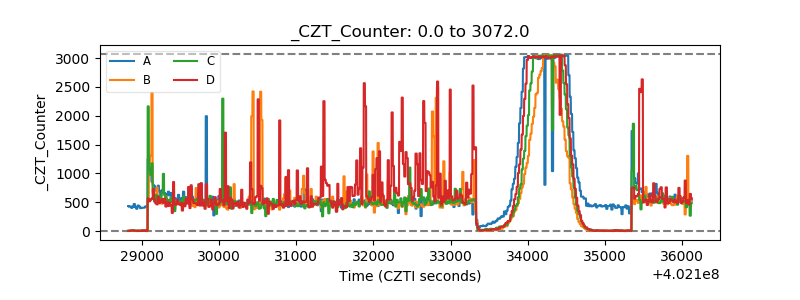 |
| +2.5 Volts monitor | 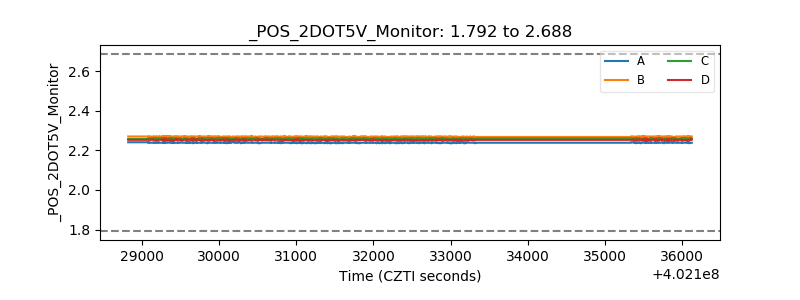 |
| +5 Volts monitor | 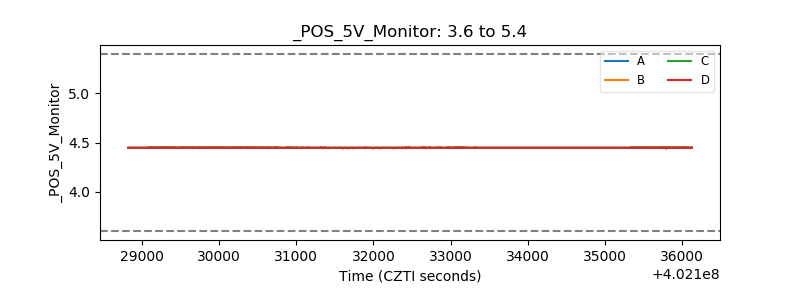 |
| _ROLL_ROT | 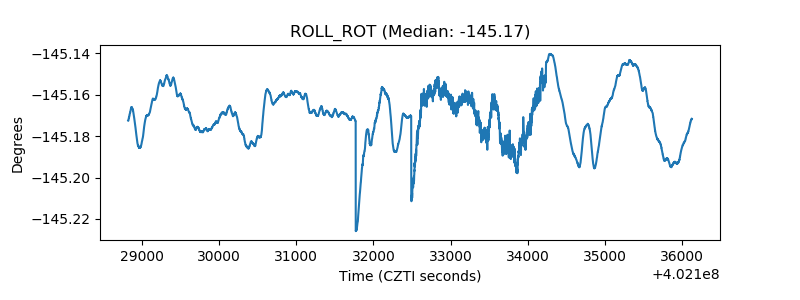 |
| _Roll_DEC | 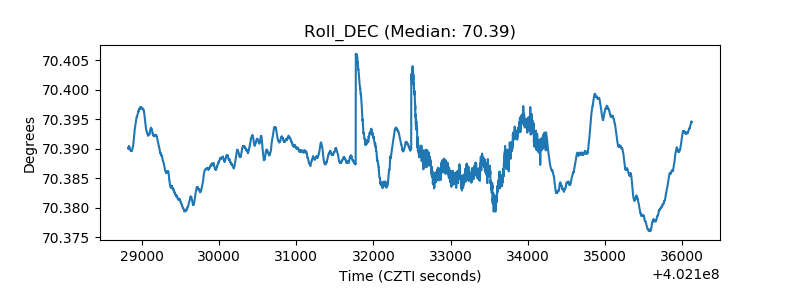 |
| _Roll_RA | 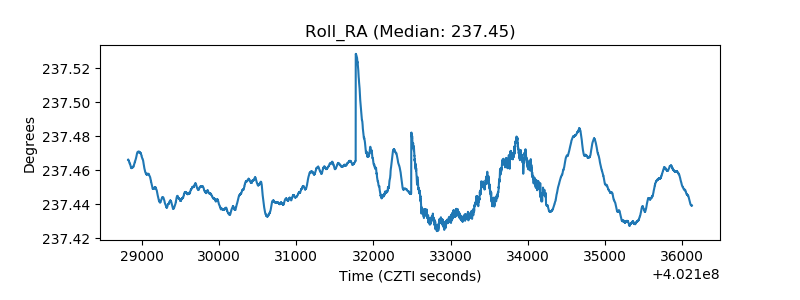 |
| Veto Counter | 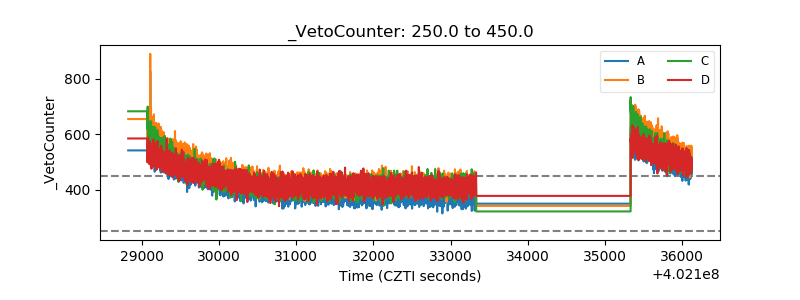 |