| Param | Original file | Final file |
|---|---|---|
| Filename | modeM0/AS1C07_001T12_9000005352_37868cztM0_level2.evt | modeM0/AS1C07_001T12_9000005352_37868cztM0_level2_quad_clean.evt |
| Size (bytes) | 422,478,720 | 96,520,320 |
| Size | 402.9 MB | 92.0 MB |
| Events in quadrant A | 2,737,129 | 675,734 |
| Events in quadrant B | 2,852,162 | 668,587 |
| Events in quadrant C | 2,652,066 | 632,090 |
| Events in quadrant D | 4,217,447 | 599,696 |
| Mode M9 | |||
|---|---|---|---|
| Quadrant | BADHDUFLAG | Total packets | Discarded packets |
| A | 0 | 27 | 0 |
| B | 0 | 27 | 0 |
| C | 0 | 27 | 0 |
| D | 0 | 28 | 0 |
| Mode M0 | |||
|---|---|---|---|
| Quadrant | BADHDUFLAG | Total packets | Discarded packets |
| A | 0 | 10984 | 3 |
| B | 0 | 11362 | 2 |
| C | 0 | 10661 | 2 |
| D | 0 | 15902 | 2 |
| Mode SS | |||
|---|---|---|---|
| Quadrant | BADHDUFLAG | Total packets | Discarded packets |
| A | 0 | 100 | 0 |
| B | 0 | 100 | 0 |
| C | 0 | 100 | 0 |
| D | 0 | 100 | 0 |
| Quadrant | Total seconds | Saturated seconds | Saturation percentage |
|---|---|---|---|
| A | 4952 | 15 | 0.302908% |
| B | 4952 | 81 | 1.635703% |
| C | 4952 | 44 | 0.888530% |
| D | 4952 | 307 | 6.199515% |
Noise dominated data is calculated using 1-second bins in cleaned event files. If a bin has >2000 counts, and if more than 50% of those come from <1% of pixels, then it is considered to be noise-dominated and hence unusable.
| Quadrant | # 1 sec bins | Bins with >0 counts | Bins with >2000 counts | High rate bins dominated by noise | Noise dominated (total time) | Noise dominated (detector-on time) | Marked lightcurve |
|---|---|---|---|---|---|---|---|
| A | 7044 | 4953 | 8 | 8 | 0.11% | 0.16% | 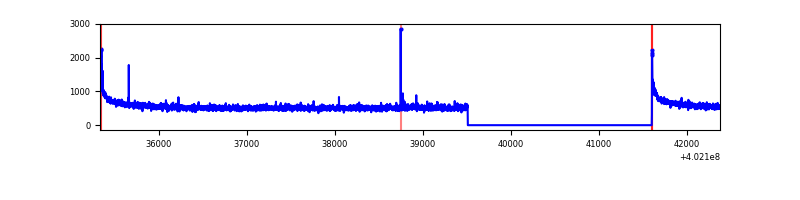 |
| B | 7044 | 4953 | 61 | 61 | 0.87% | 1.23% | 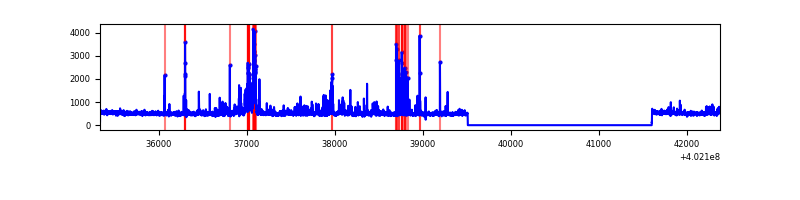 |
| C | 7044 | 4953 | 41 | 41 | 0.58% | 0.83% | 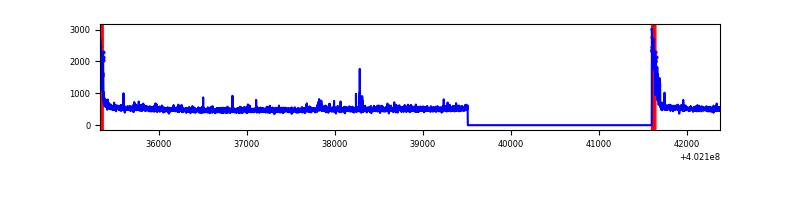 |
| D | 7044 | 4953 | 236 | 236 | 3.35% | 4.76% | 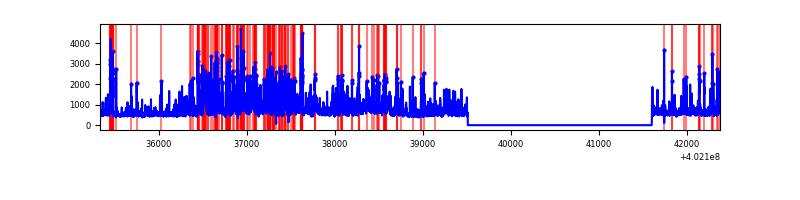 |
Top three noisy pixels from each quadrant. If the there are fewer than three noisy pixels in the level2.evt file, extra rows are filled as -1
| Pixel properties | Quadrant properties | ||||||
|---|---|---|---|---|---|---|---|
| Quadrant | DetID | PixID | Counts | Sigma | Mean | Median | Sigma |
| A | 10 | 83 | 337742 | 2784.59 | 610 | 601 | 121.1 |
| A | 7 | 3 | 17911 | 142.97 | 610 | 601 | 121.1 |
| A | 12 | 189 | 12645 | 99.47 | 610 | 601 | 121.1 |
| B | 5 | 172 | 274780 | 2504.34 | 591 | 580 | 109.5 |
| B | 0 | 229 | 123813 | 1125.52 | 591 | 580 | 109.5 |
| B | 0 | 213 | 31123 | 278.96 | 591 | 580 | 109.5 |
| C | 15 | 214 | 210614 | 1613.01 | 570 | 574 | 130.2 |
| C | 0 | 10 | 186110 | 1424.83 | 570 | 574 | 130.2 |
| C | 14 | 254 | 27966 | 210.36 | 570 | 574 | 130.2 |
| D | 1 | 52 | 957809 | 6905.74 | 574 | 559 | 138.6 |
| D | 12 | 235 | 262034 | 1886.32 | 574 | 559 | 138.6 |
| D | 2 | 249 | 182859 | 1315.14 | 574 | 559 | 138.6 |
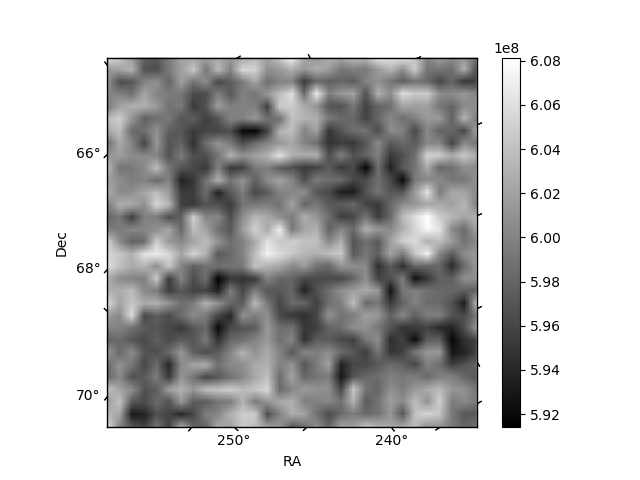
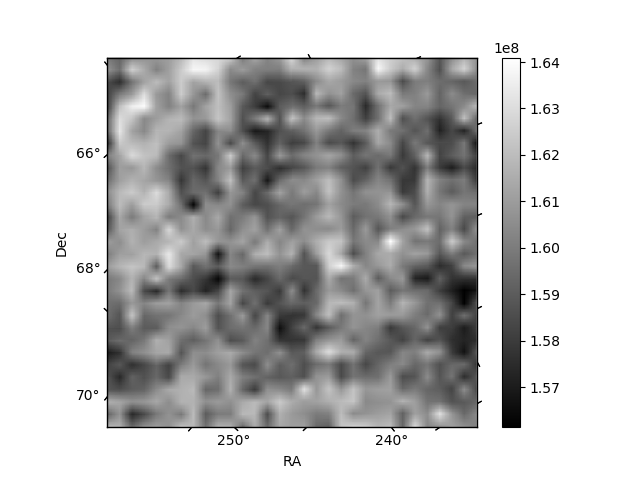
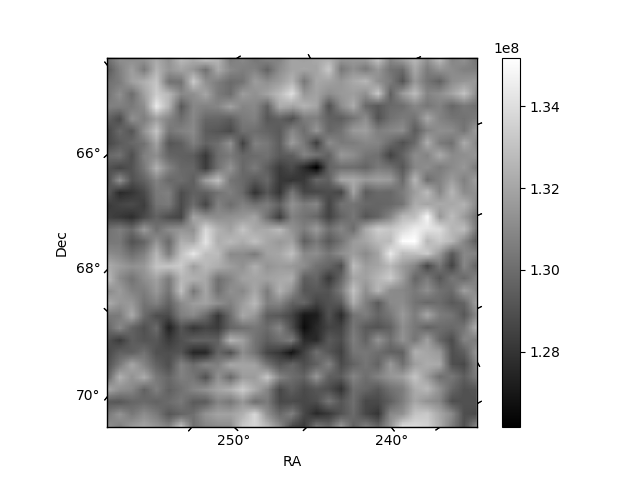
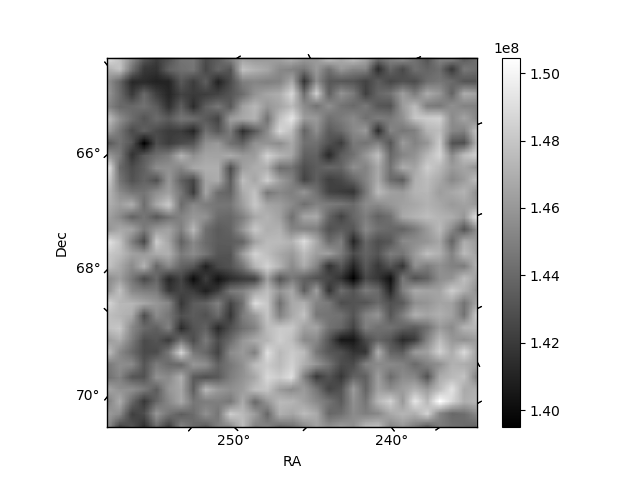
Histogram calculated using DETX and DETY for each event in the final _common_clean file
| Quadrant A | 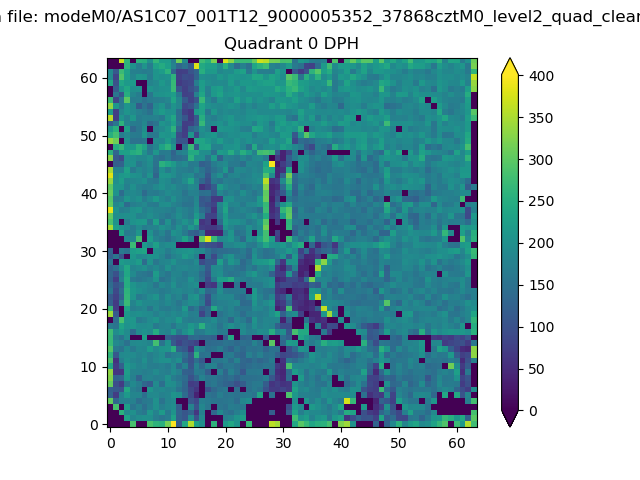 |
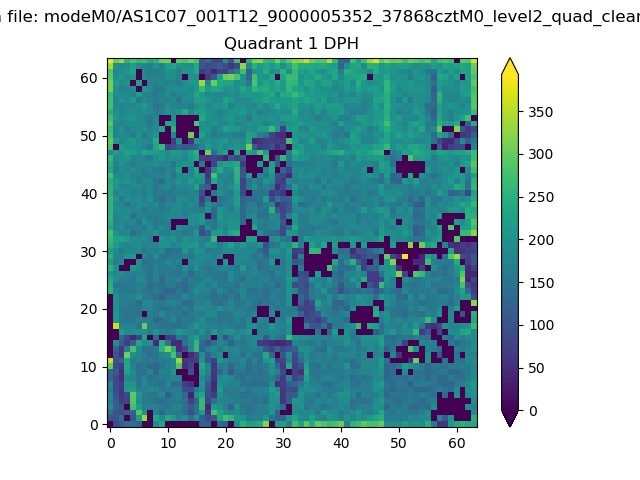 |
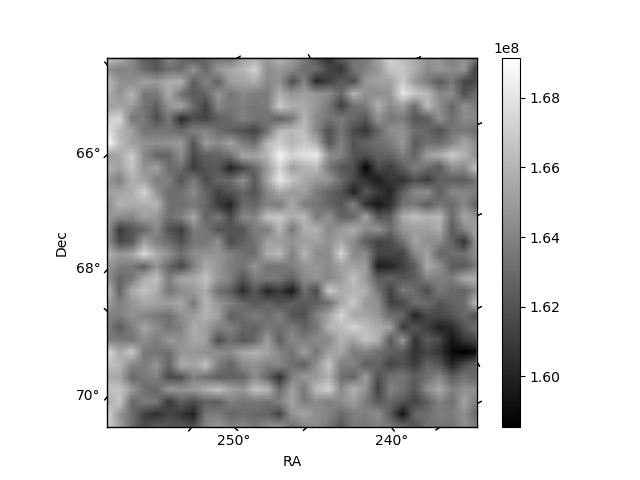
Quadrant B |
|---|---|---|---|
| Quadrant D | 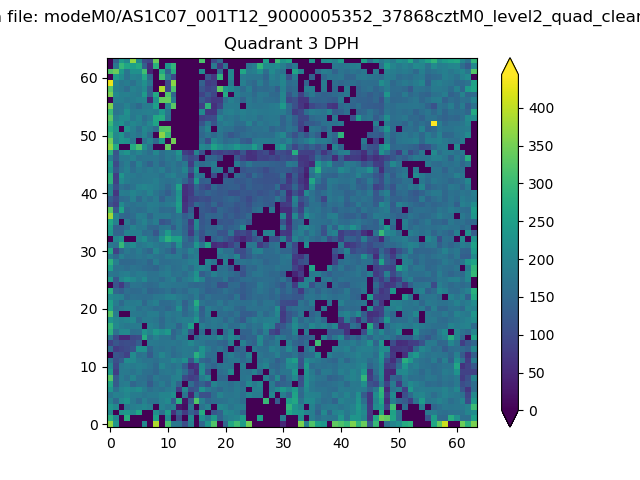 |
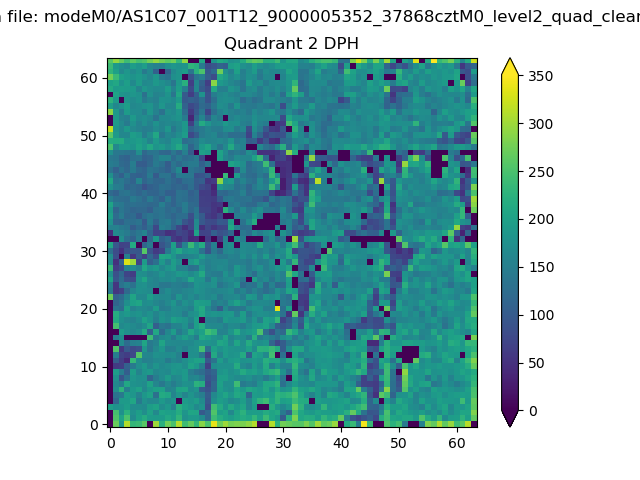 |
Quadrant C |
| Plot type | Count rate plots | Images |
|---|---|---|
| Comparison with Poisson distribution Blue bars denote a histogram of data divided into 1 sec bins. Red curve is a Poisson curve with rate = median count rate of data. |
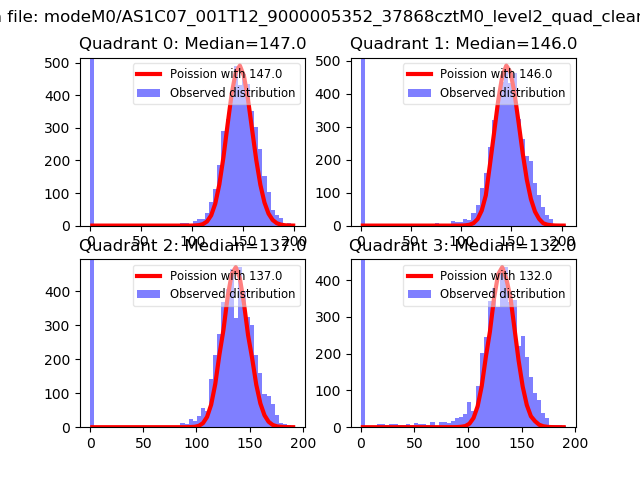 |
 |
| Quadrant-wise count rates Data is divided into 100 sec bins |
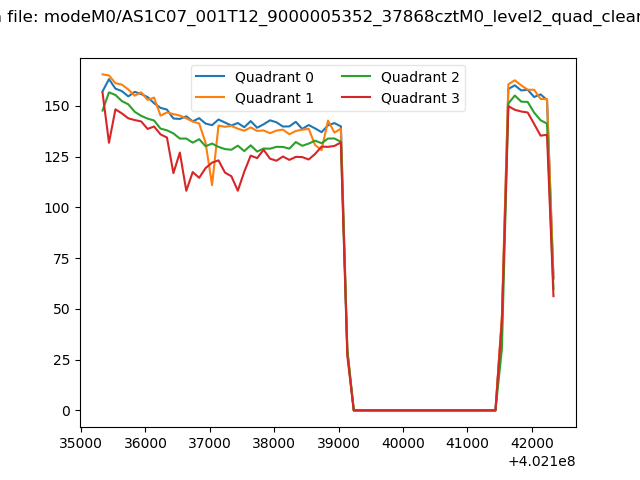 |
|
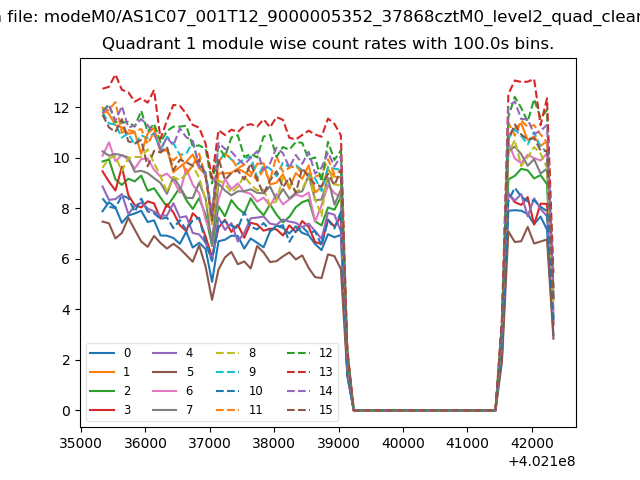
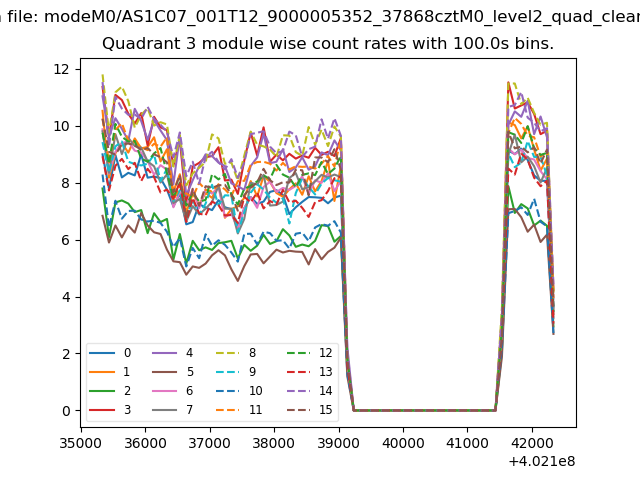
| Module-wise count rates for Quadrant A Data is divided into 100 sec bins |
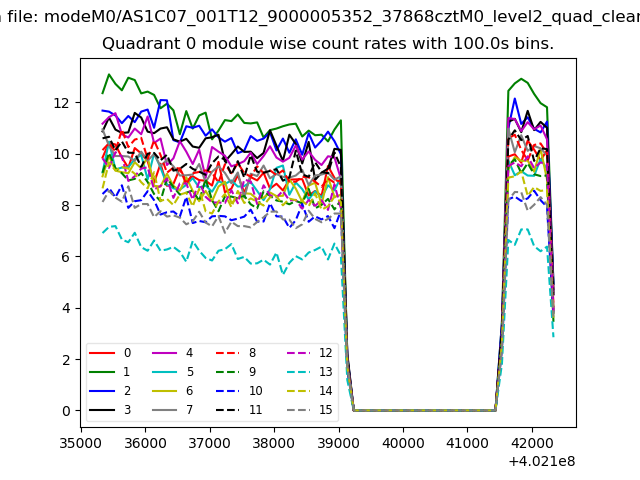 |
 |
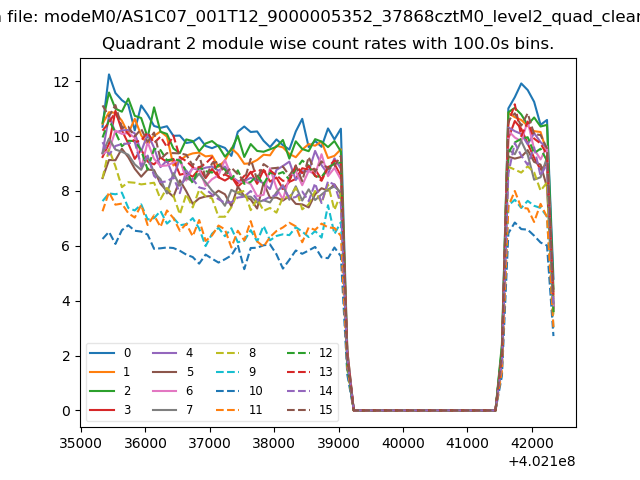
| Module-wise count rates for Quadrant B Data is divided into 100 sec bins |
 |
 |
| Module-wise count rates for Quadrant C Data is divided into 100 sec bins |
 |
 |
| Module-wise count rates for Quadrant D Data is divided into 100 sec bins |
 |
 |
| Parameter | Plot |
|---|---|
| CZT HV Monitor |  |
| D_VDD | 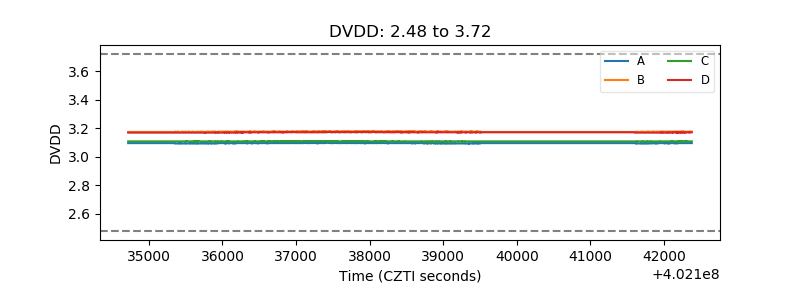 |
| Temperature 1 | 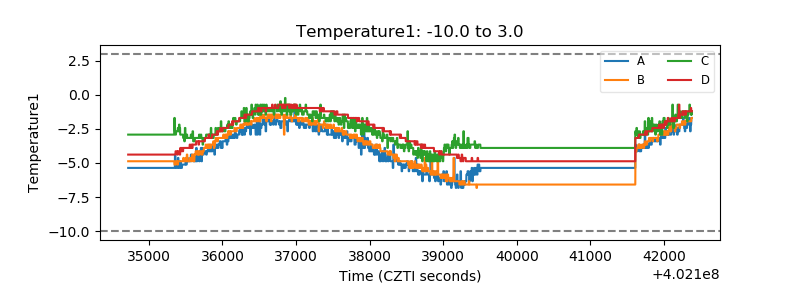 |
| Veto HV Monitor | 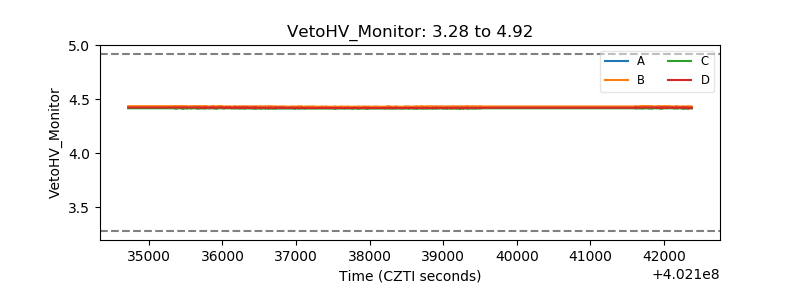 |
| Veto LLD | 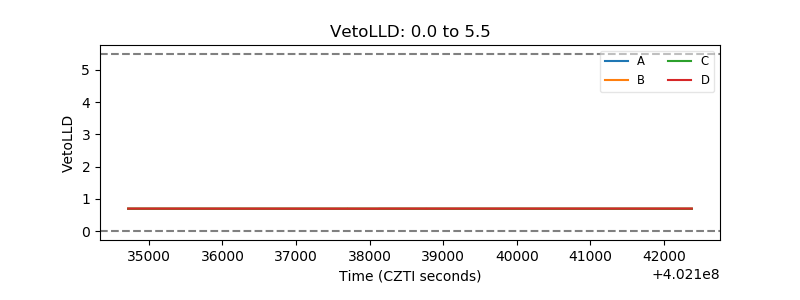 |
| Alpha Counter | 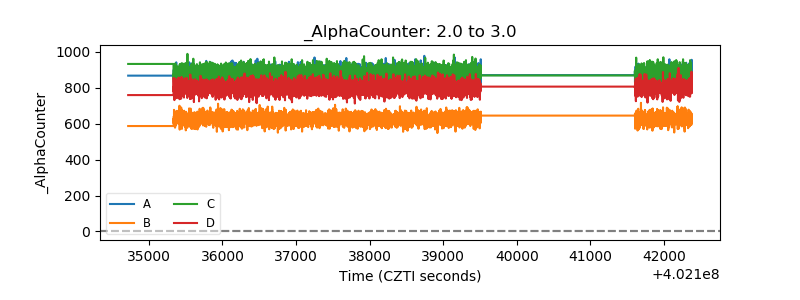 |
| _CPM_Rate | 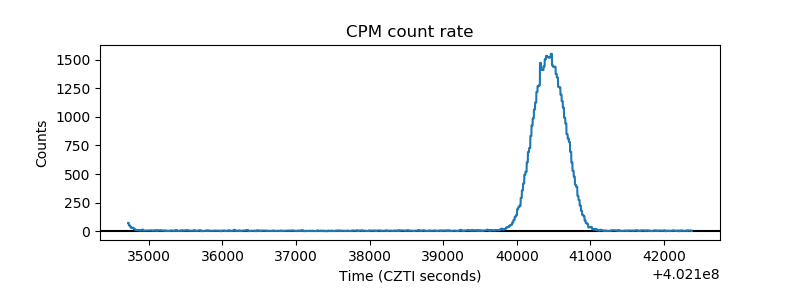 |
| CZT Counter | 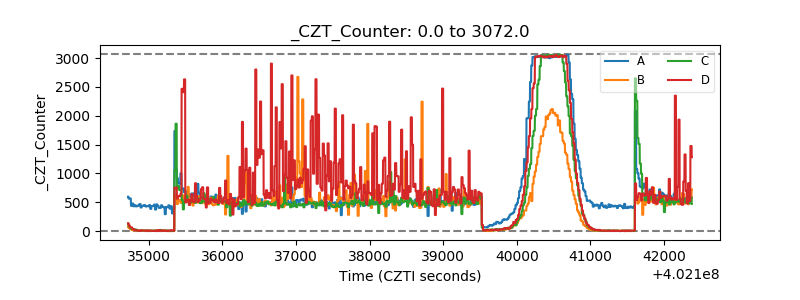 |
| +2.5 Volts monitor | 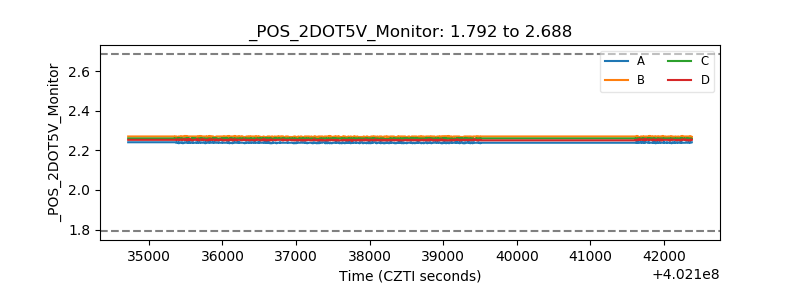 |
| +5 Volts monitor | 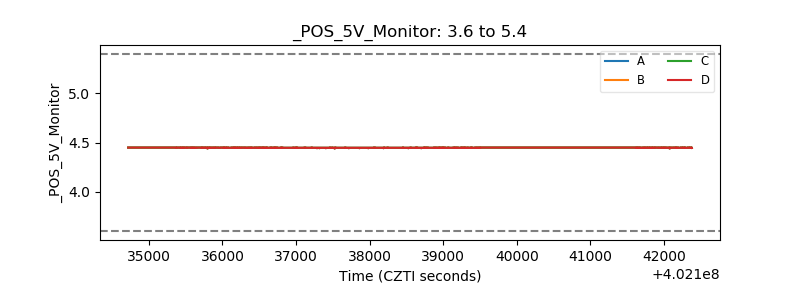 |
| _ROLL_ROT | 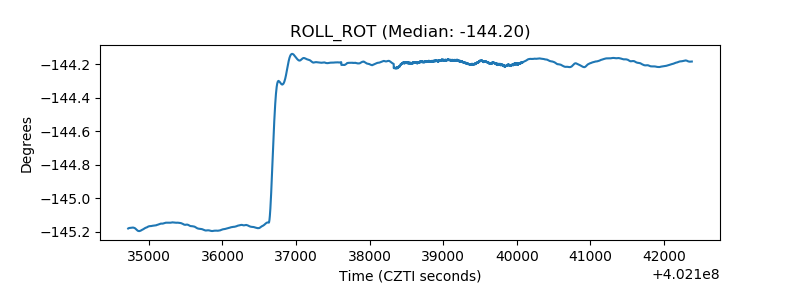 |
| _Roll_DEC | 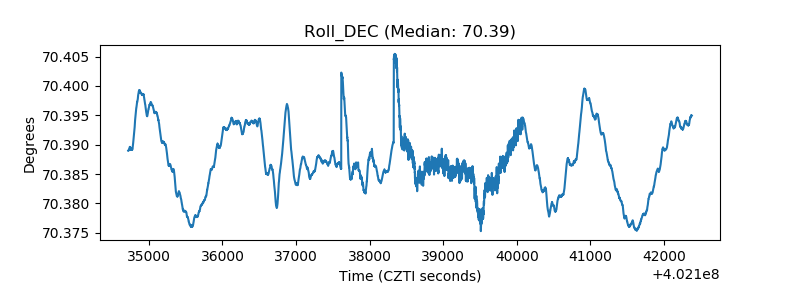 |
| _Roll_RA | 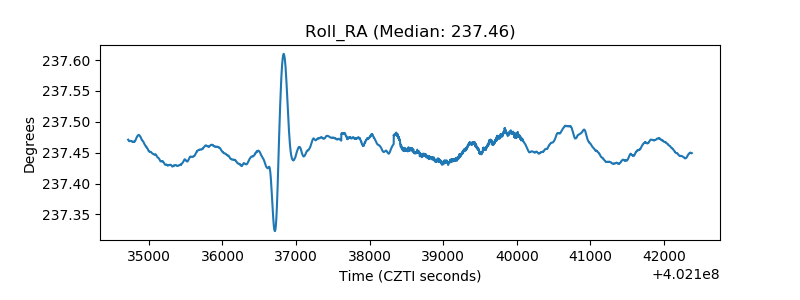 |
| Veto Counter | 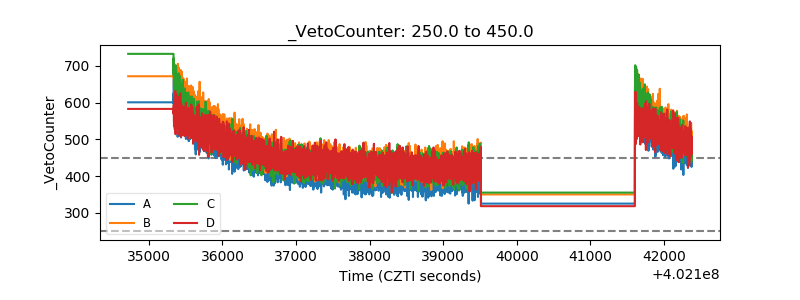 |