| Param | Original file | Final file |
|---|---|---|
| Filename | modeM0/AS1C07_001T12_9000005352_37869cztM0_level2.evt | modeM0/AS1C07_001T12_9000005352_37869cztM0_level2_quad_clean.evt |
| Size (bytes) | 441,645,120 | 85,907,520 |
| Size | 421.2 MB | 81.9 MB |
| Events in quadrant A | 3,074,903 | 591,429 |
| Events in quadrant B | 2,669,386 | 589,595 |
| Events in quadrant C | 2,549,477 | 556,456 |
| Events in quadrant D | 4,750,655 | 521,848 |
| Mode M9 | |||
|---|---|---|---|
| Quadrant | BADHDUFLAG | Total packets | Discarded packets |
| A | 0 | 21 | 0 |
| B | 0 | 21 | 0 |
| C | 0 | 21 | 0 |
| D | 0 | 21 | 0 |
| Mode M0 | |||
|---|---|---|---|
| Quadrant | BADHDUFLAG | Total packets | Discarded packets |
| A | 0 | 12289 | 2 |
| B | 0 | 10810 | 1 |
| C | 0 | 10310 | 1 |
| D | 0 | 17504 | 1 |
| Mode SS | |||
|---|---|---|---|
| Quadrant | BADHDUFLAG | Total packets | Discarded packets |
| A | 0 | 100 | 0 |
| B | 0 | 100 | 0 |
| C | 0 | 100 | 0 |
| D | 0 | 100 | 0 |
| Quadrant | Total seconds | Saturated seconds | Saturation percentage |
|---|---|---|---|
| A | 4874 | 6 | 0.123102% |
| B | 4874 | 33 | 0.677062% |
| C | 4874 | 17 | 0.348789% |
| D | 4874 | 458 | 9.396799% |
Noise dominated data is calculated using 1-second bins in cleaned event files. If a bin has >2000 counts, and if more than 50% of those come from <1% of pixels, then it is considered to be noise-dominated and hence unusable.
| Quadrant | # 1 sec bins | Bins with >0 counts | Bins with >2000 counts | High rate bins dominated by noise | Noise dominated (total time) | Noise dominated (detector-on time) | Marked lightcurve |
|---|---|---|---|---|---|---|---|
| A | 6996 | 4875 | 1 | 1 | 0.01% | 0.02% | 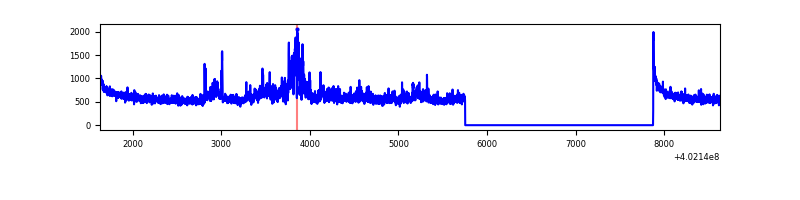 |
| B | 6996 | 4875 | 23 | 23 | 0.33% | 0.47% | 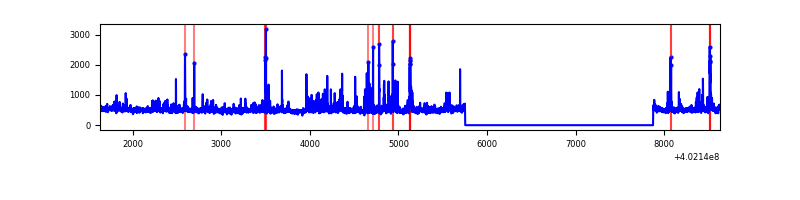 |
| C | 6996 | 4875 | 19 | 19 | 0.27% | 0.39% | 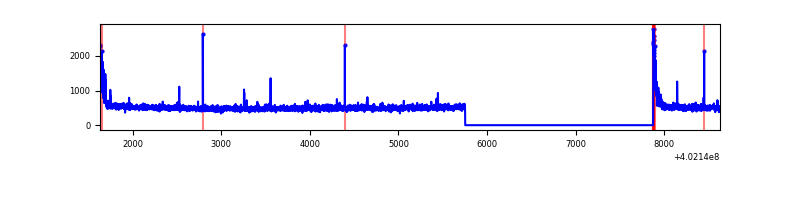 |
| D | 6996 | 4875 | 430 | 430 | 6.15% | 8.82% | 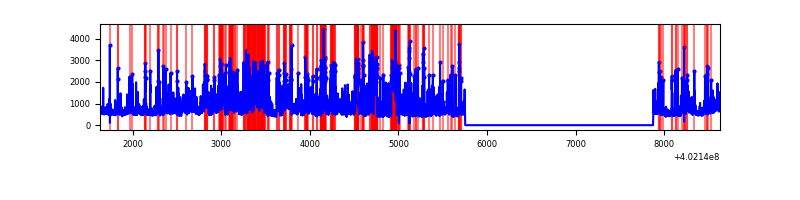 |
Top three noisy pixels from each quadrant. If the there are fewer than three noisy pixels in the level2.evt file, extra rows are filled as -1
| Pixel properties | Quadrant properties | ||||||
|---|---|---|---|---|---|---|---|
| Quadrant | DetID | PixID | Counts | Sigma | Mean | Median | Sigma |
| A | 9 | 143 | 361327 | 3066.18 | 588 | 577 | 117.7 |
| A | 10 | 83 | 324748 | 2755.28 | 588 | 577 | 117.7 |
| A | 15 | 222 | 89245 | 753.63 | 588 | 577 | 117.7 |
| B | 0 | 229 | 167624 | 1549.28 | 575 | 562 | 107.8 |
| B | 5 | 172 | 100124 | 923.3 | 575 | 562 | 107.8 |
| B | 0 | 230 | 40974 | 374.77 | 575 | 562 | 107.8 |
| C | 15 | 214 | 207363 | 1605.66 | 557 | 561 | 128.8 |
| C | 0 | 10 | 129717 | 1002.8 | 557 | 561 | 128.8 |
| C | 14 | 254 | 31573 | 240.79 | 557 | 561 | 128.8 |
| D | 1 | 52 | 936137 | 6977.06 | 552 | 537 | 134.1 |
| D | 2 | 249 | 935131 | 6969.56 | 552 | 537 | 134.1 |
| D | 12 | 235 | 168534 | 1252.81 | 552 | 537 | 134.1 |
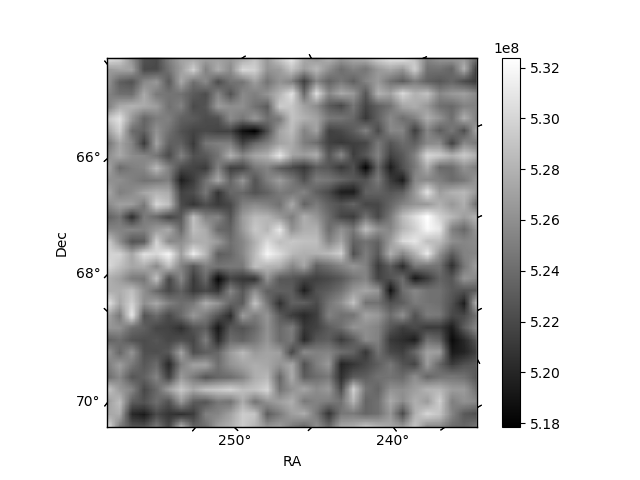
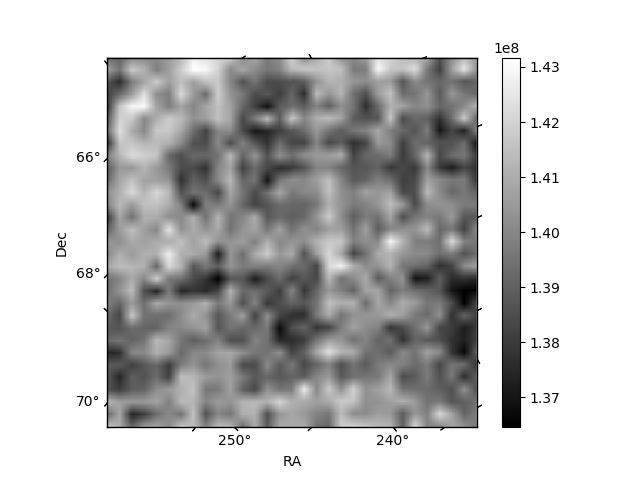
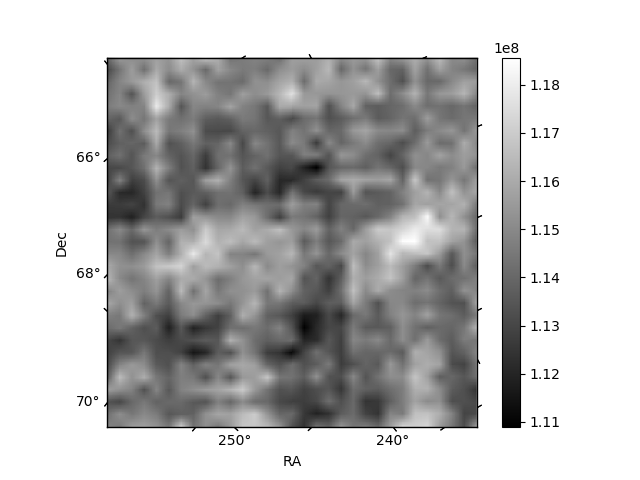
Histogram calculated using DETX and DETY for each event in the final _common_clean file
| Quadrant A | 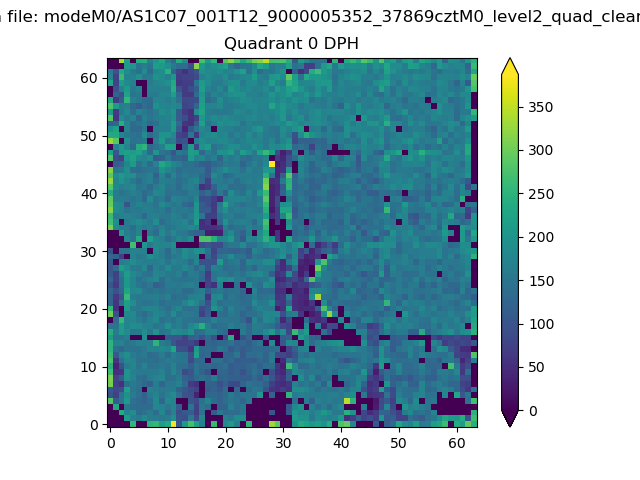 |
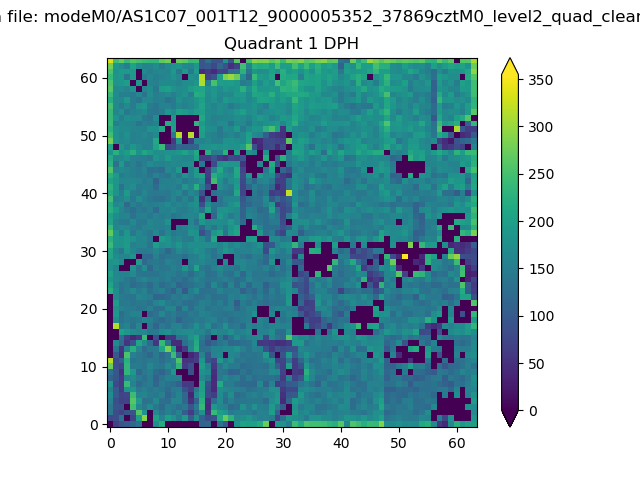 |
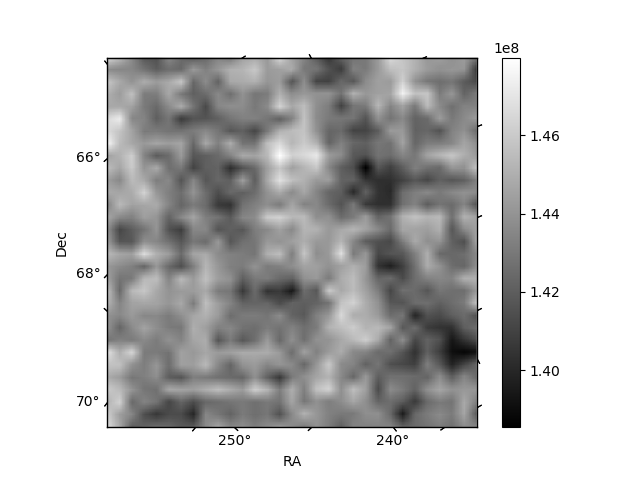
Quadrant B |
|---|---|---|---|
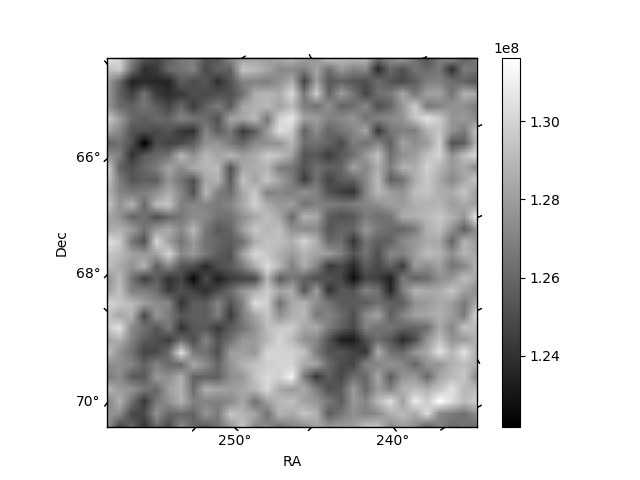
| Quadrant D | 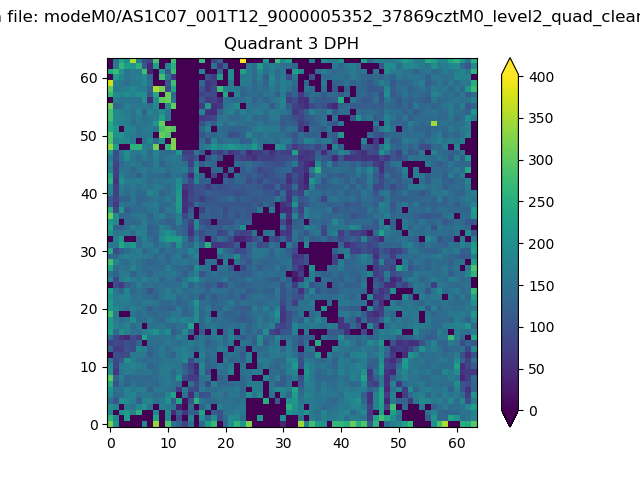 |
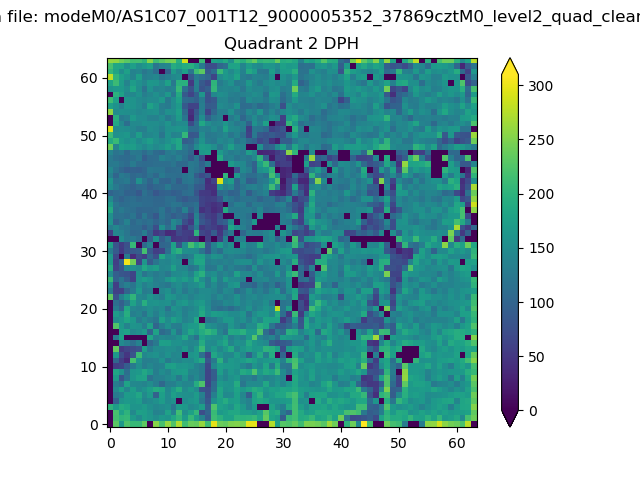 |
Quadrant C |
| Plot type | Count rate plots | Images |
|---|---|---|
| Comparison with Poisson distribution Blue bars denote a histogram of data divided into 1 sec bins. Red curve is a Poisson curve with rate = median count rate of data. |
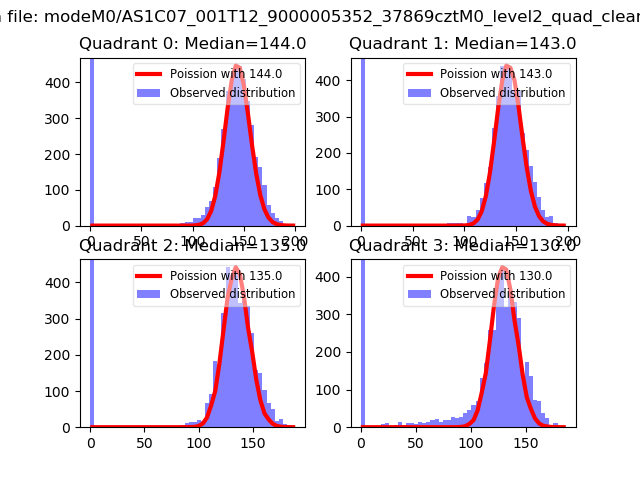 |
 |
| Quadrant-wise count rates Data is divided into 100 sec bins |
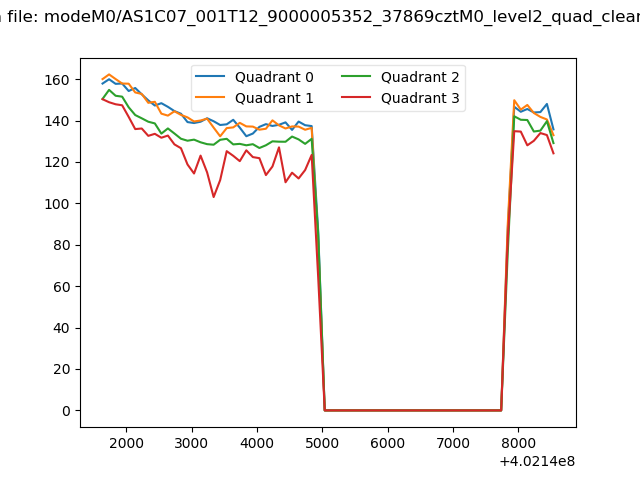 |
|
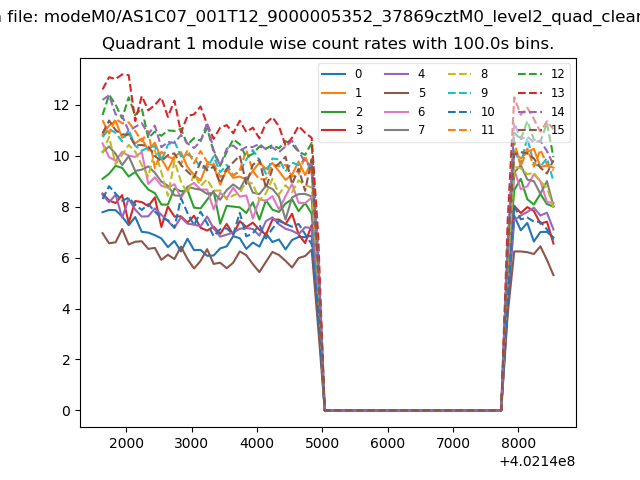
| Module-wise count rates for Quadrant A Data is divided into 100 sec bins |
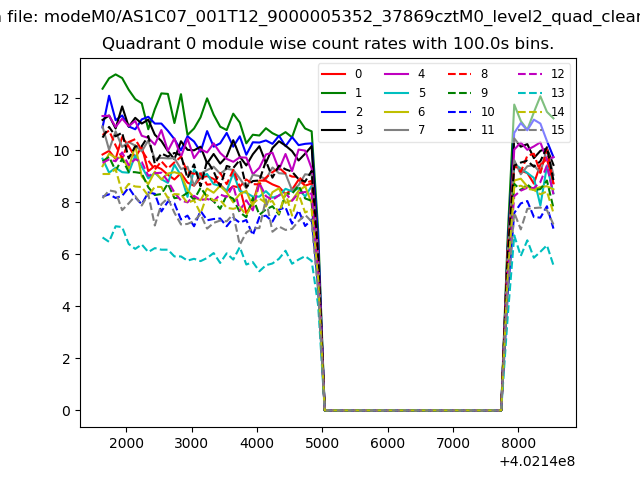 |
 |
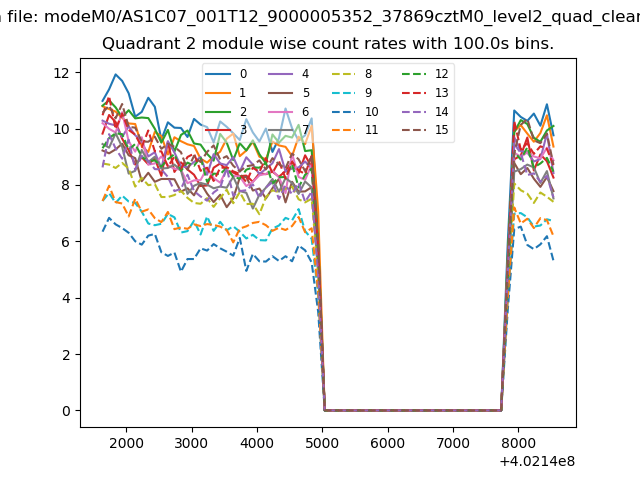
| Module-wise count rates for Quadrant B Data is divided into 100 sec bins |
 |
 |
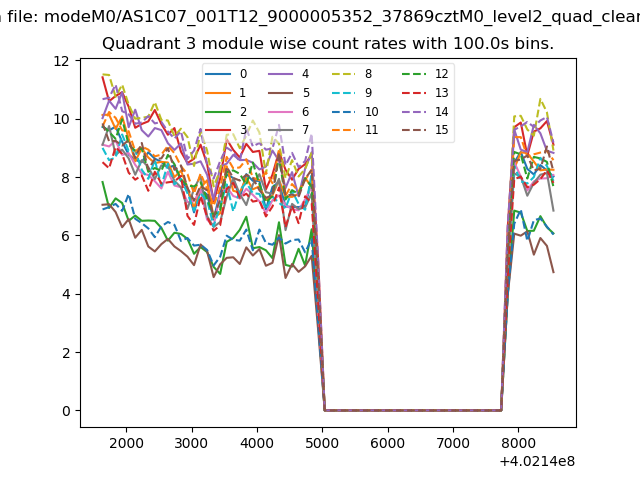
| Module-wise count rates for Quadrant C Data is divided into 100 sec bins |
 |
 |
| Module-wise count rates for Quadrant D Data is divided into 100 sec bins |
 |
 |
| Parameter | Plot |
|---|---|
| CZT HV Monitor | 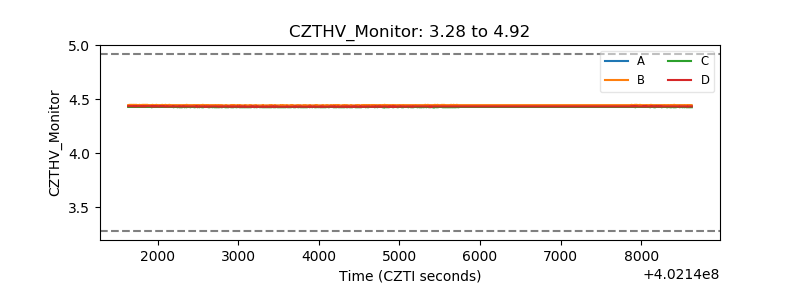 |
| D_VDD | 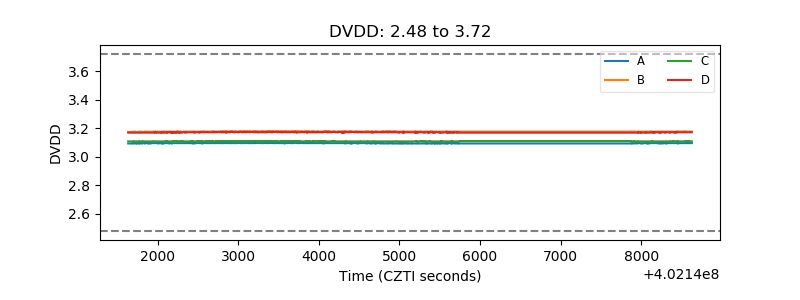 |
| Temperature 1 | 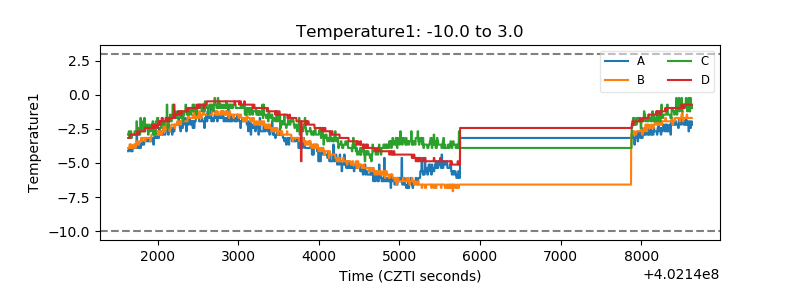 |
| Veto HV Monitor | 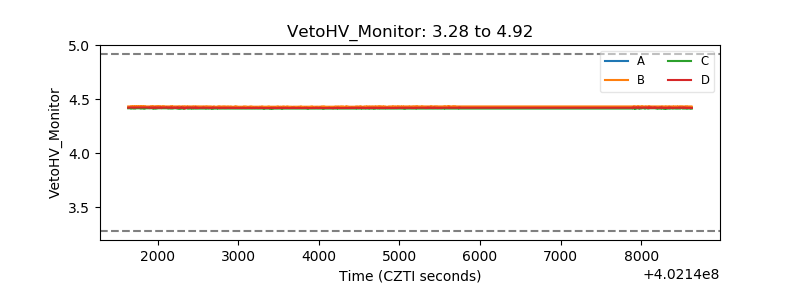 |
| Veto LLD | 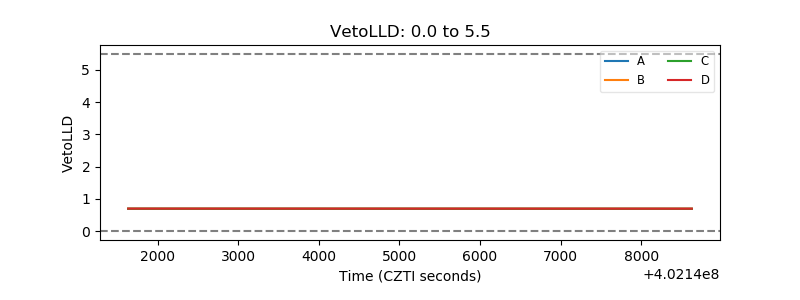 |
| Alpha Counter | 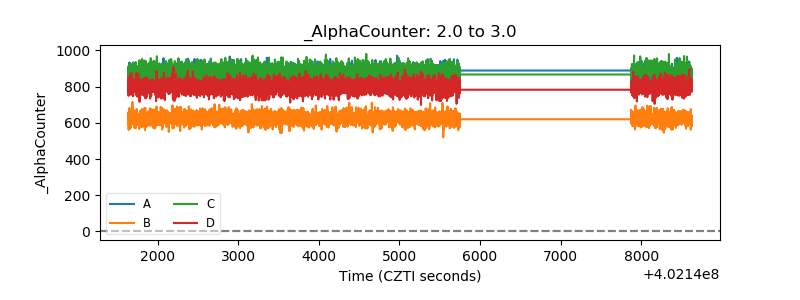 |
| _CPM_Rate | 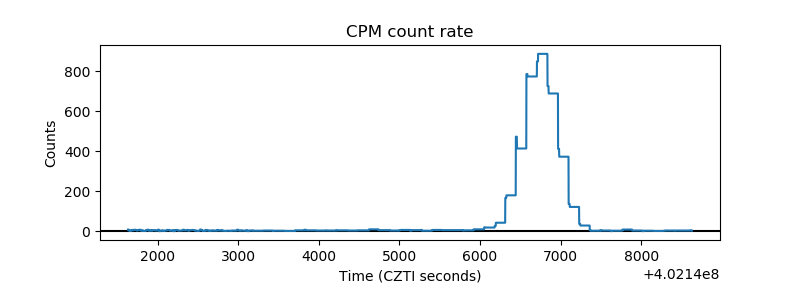 |
| CZT Counter | 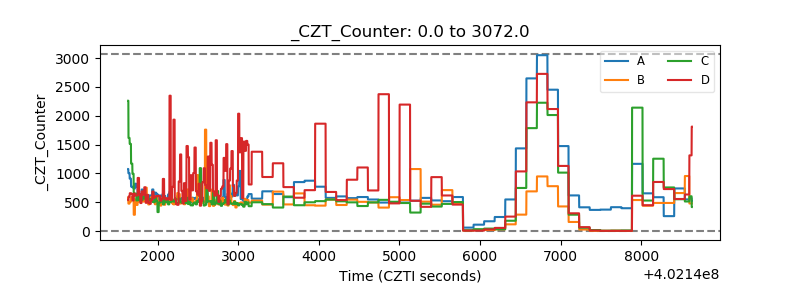 |
| +2.5 Volts monitor | 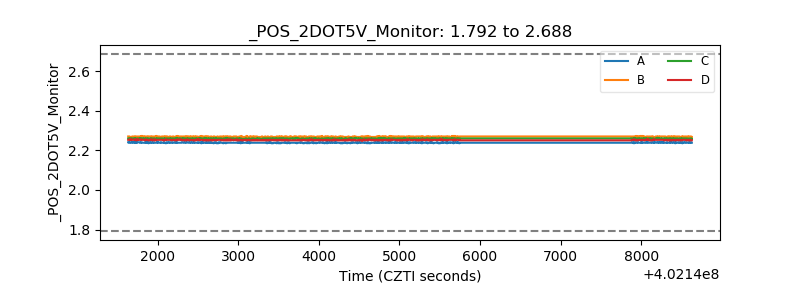 |
| +5 Volts monitor | 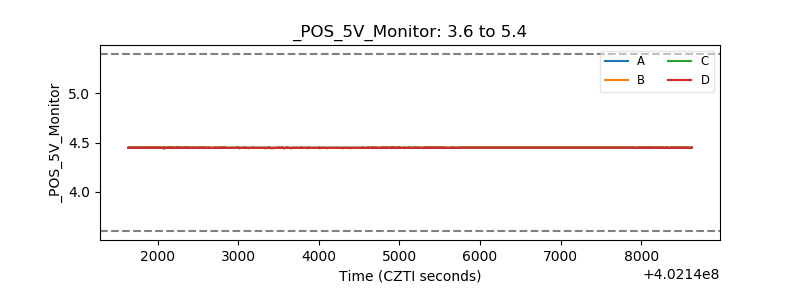 |
| _ROLL_ROT | 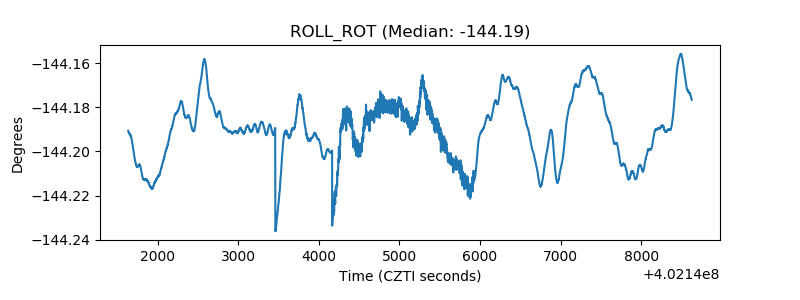 |
| _Roll_DEC | 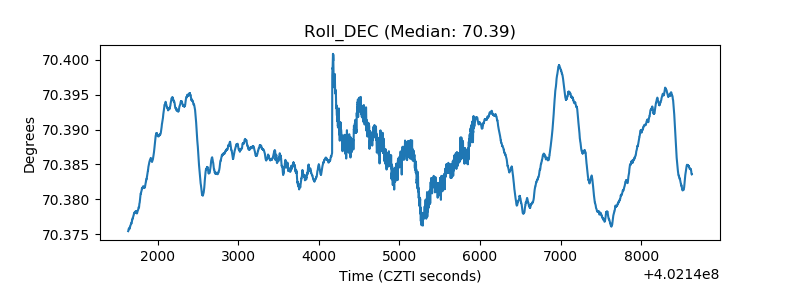 |
| _Roll_RA | 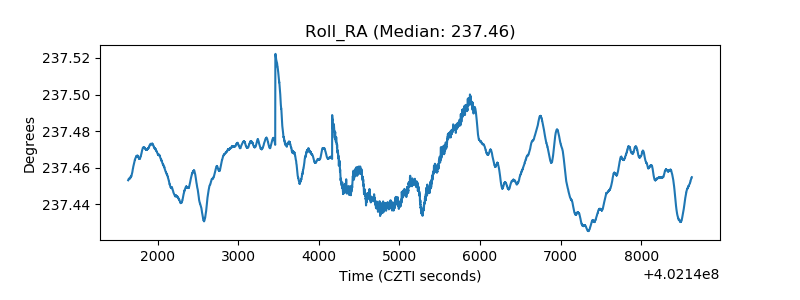 |
| Veto Counter | 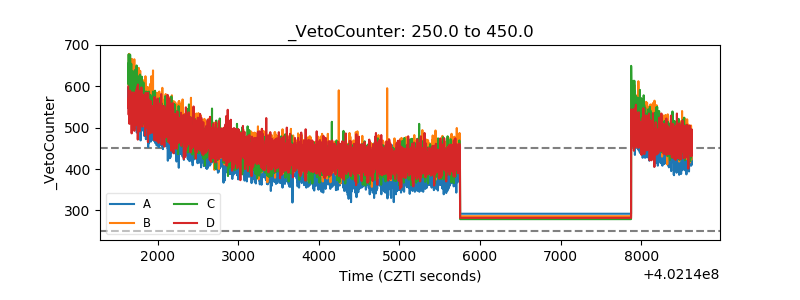 |