| Param | Original file | Final file |
|---|---|---|
| Filename | modeM0/AS1C07_001T12_9000005352_37870cztM0_level2.evt | modeM0/AS1C07_001T12_9000005352_37870cztM0_level2_quad_clean.evt |
| Size (bytes) | 432,236,160 | 75,430,080 |
| Size | 412.2 MB | 71.9 MB |
| Events in quadrant A | 2,636,290 | 509,126 |
| Events in quadrant B | 2,754,262 | 505,461 |
| Events in quadrant C | 2,564,442 | 481,055 |
| Events in quadrant D | 4,799,313 | 441,383 |
| Mode M9 | |||
|---|---|---|---|
| Quadrant | BADHDUFLAG | Total packets | Discarded packets |
| A | 0 | 22 | 0 |
| B | 0 | 22 | 0 |
| C | 0 | 22 | 0 |
| D | 0 | 23 | 0 |
| Mode M0 | |||
|---|---|---|---|
| Quadrant | BADHDUFLAG | Total packets | Discarded packets |
| A | 0 | 10773 | 3 |
| B | 0 | 11284 | 2 |
| C | 0 | 10527 | 2 |
| D | 0 | 17602 | 2 |
| Mode SS | |||
|---|---|---|---|
| Quadrant | BADHDUFLAG | Total packets | Discarded packets |
| A | 0 | 100 | 0 |
| B | 0 | 100 | 0 |
| C | 0 | 100 | 0 |
| D | 0 | 100 | 0 |
| Quadrant | Total seconds | Saturated seconds | Saturation percentage |
|---|---|---|---|
| A | 4950 | 8 | 0.161616% |
| B | 4950 | 74 | 1.494949% |
| C | 4950 | 39 | 0.787879% |
| D | 4950 | 514 | 10.383838% |
Noise dominated data is calculated using 1-second bins in cleaned event files. If a bin has >2000 counts, and if more than 50% of those come from <1% of pixels, then it is considered to be noise-dominated and hence unusable.
| Quadrant | # 1 sec bins | Bins with >0 counts | Bins with >2000 counts | High rate bins dominated by noise | Noise dominated (total time) | Noise dominated (detector-on time) | Marked lightcurve |
|---|---|---|---|---|---|---|---|
| A | 7042 | 4951 | 1 | 1 | 0.01% | 0.02% | 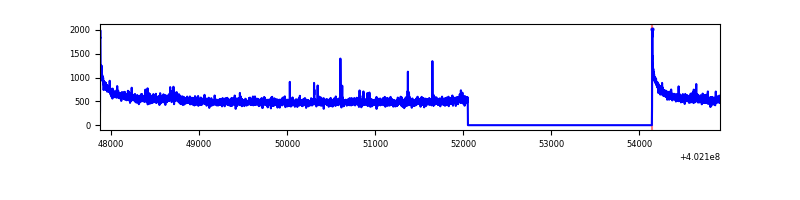 |
| B | 7042 | 4951 | 54 | 54 | 0.77% | 1.09% | 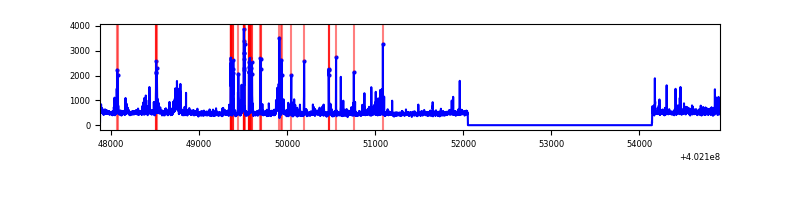 |
| C | 7042 | 4951 | 36 | 36 | 0.51% | 0.73% | 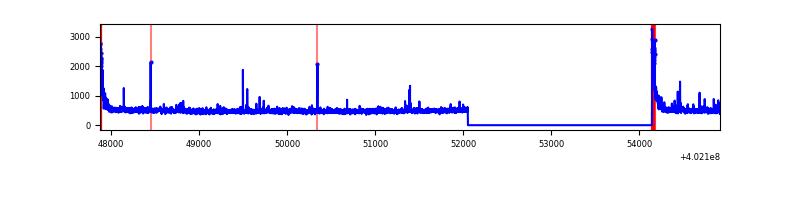 |
| D | 7042 | 4951 | 468 | 468 | 6.65% | 9.45% | 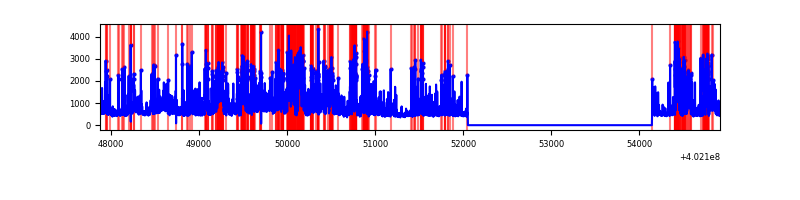 |
Top three noisy pixels from each quadrant. If the there are fewer than three noisy pixels in the level2.evt file, extra rows are filled as -1
| Pixel properties | Quadrant properties | ||||||
|---|---|---|---|---|---|---|---|
| Quadrant | DetID | PixID | Counts | Sigma | Mean | Median | Sigma |
| A | 10 | 83 | 340974 | 2934.28 | 574 | 564 | 116.0 |
| A | 15 | 222 | 37621 | 319.42 | 574 | 564 | 116.0 |
| A | 12 | 189 | 16733 | 139.37 | 574 | 564 | 116.0 |
| B | 5 | 172 | 264551 | 2514.69 | 560 | 548 | 105.0 |
| B | 0 | 229 | 91996 | 871.06 | 560 | 548 | 105.0 |
| B | 0 | 189 | 48212 | 454.01 | 560 | 548 | 105.0 |
| C | 15 | 214 | 210844 | 1644.84 | 551 | 554 | 127.8 |
| C | 0 | 10 | 148528 | 1157.42 | 551 | 554 | 127.8 |
| C | 14 | 254 | 49835 | 385.47 | 551 | 554 | 127.8 |
| D | 1 | 52 | 1285561 | 9858.58 | 539 | 524 | 130.3 |
| D | 2 | 249 | 796264 | 6104.78 | 539 | 524 | 130.3 |
| D | 1 | 47 | 163402 | 1249.57 | 539 | 524 | 130.3 |
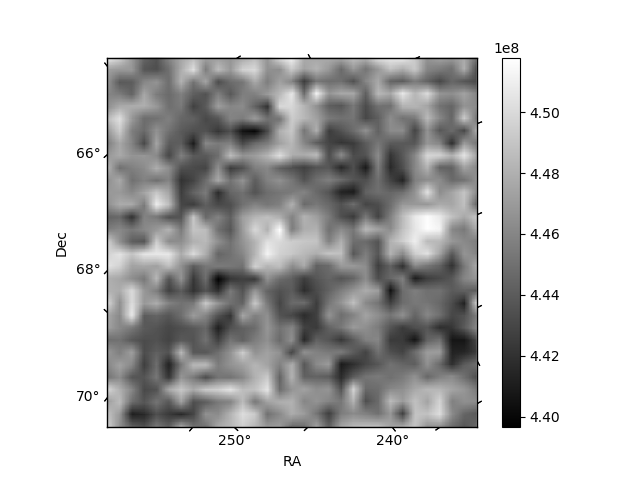
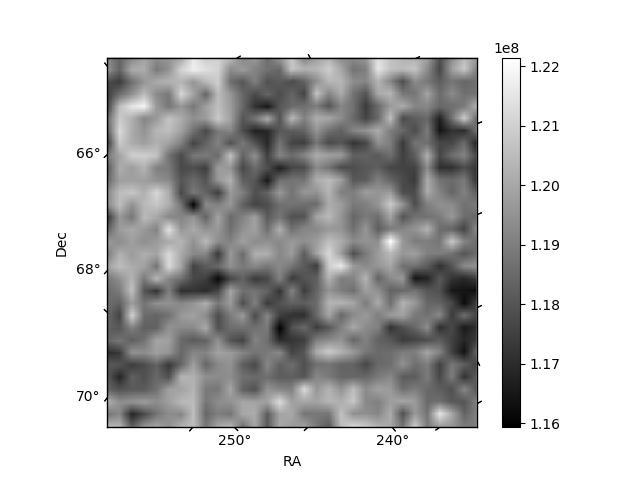
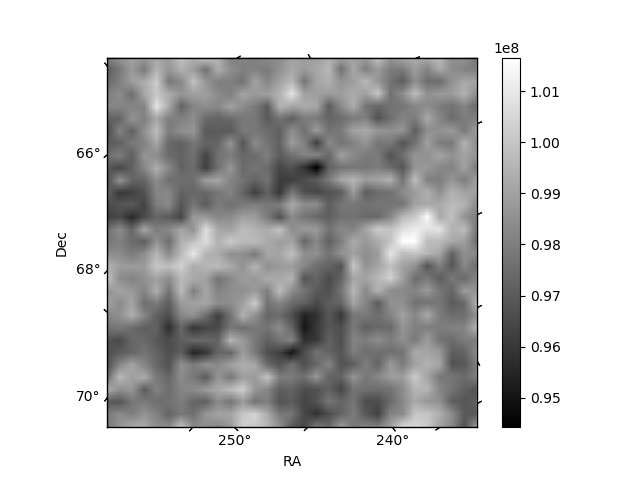
Histogram calculated using DETX and DETY for each event in the final _common_clean file
| Quadrant A | 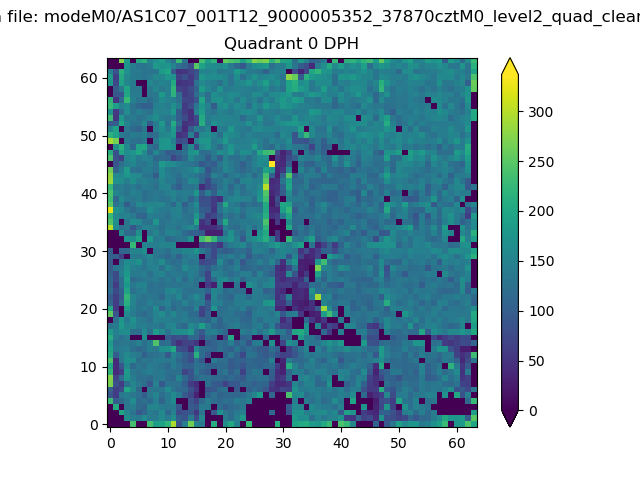 |
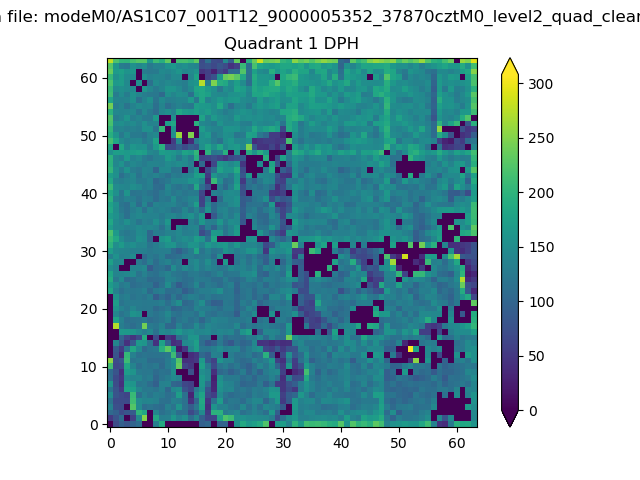 |
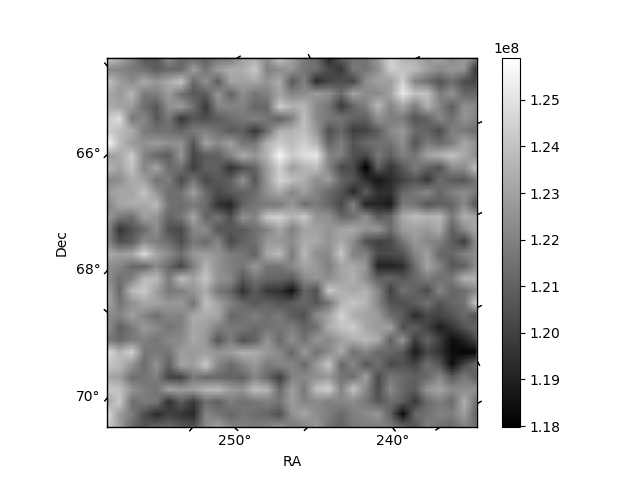
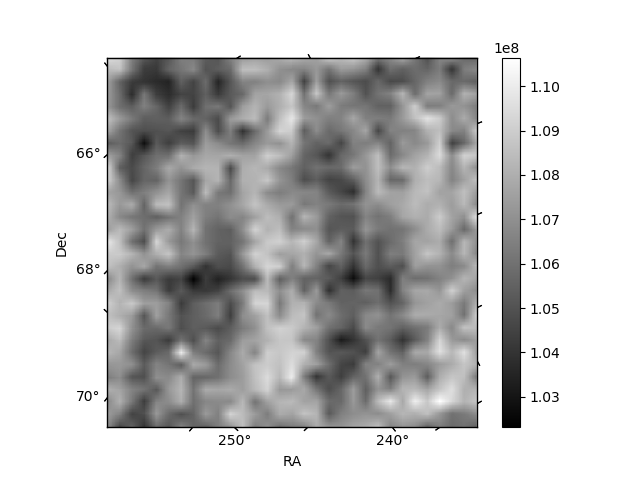
Quadrant B |
|---|---|---|---|
| Quadrant D | 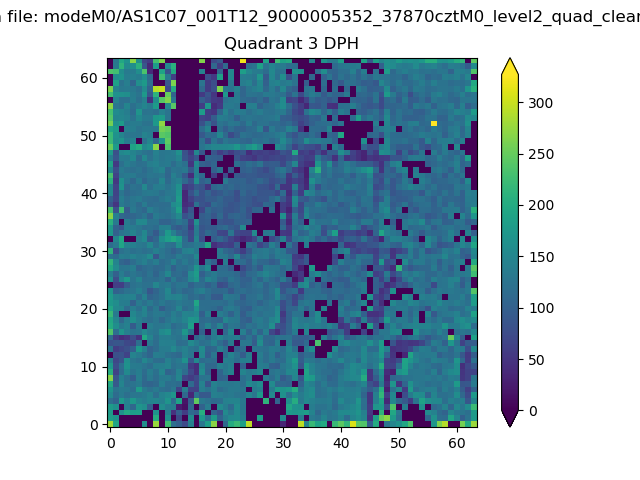 |
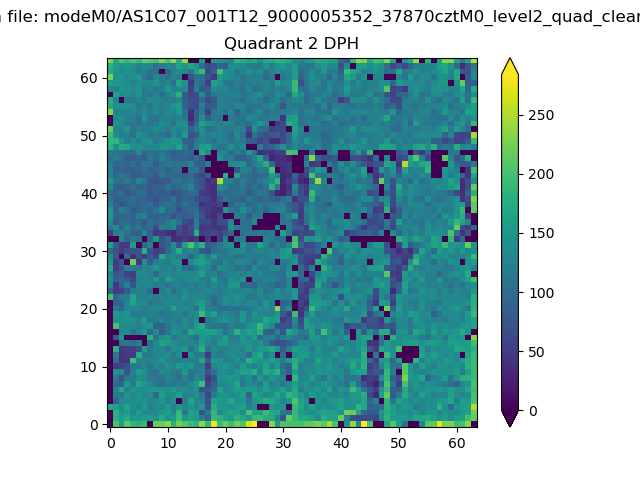 |
Quadrant C |
| Plot type | Count rate plots | Images |
|---|---|---|
| Comparison with Poisson distribution Blue bars denote a histogram of data divided into 1 sec bins. Red curve is a Poisson curve with rate = median count rate of data. |
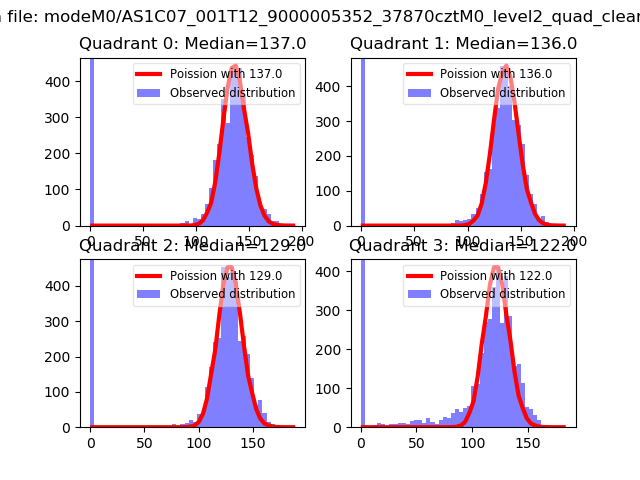 |
 |
| Quadrant-wise count rates Data is divided into 100 sec bins |
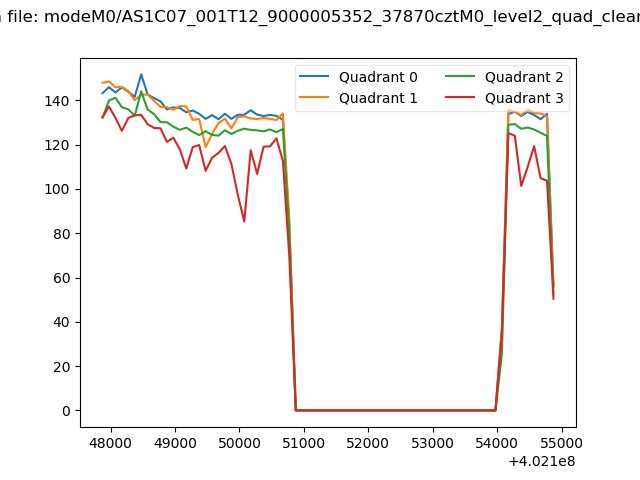 |
|
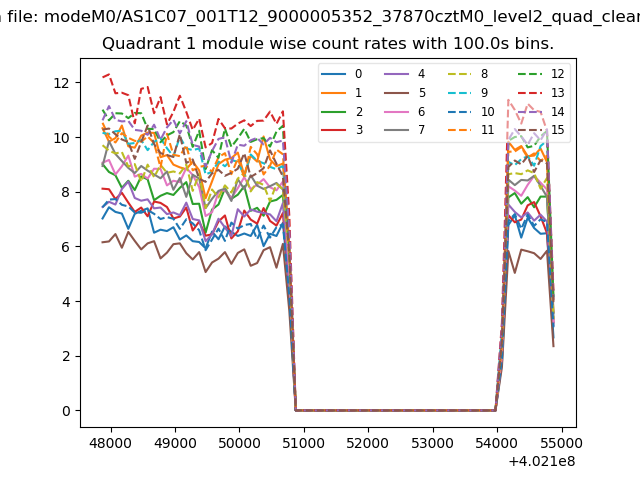
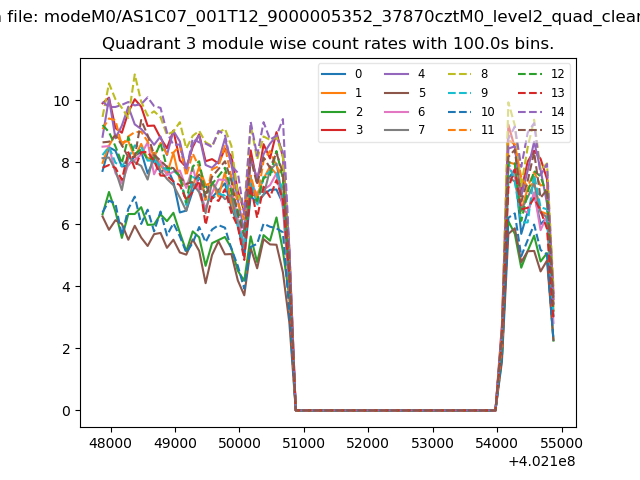
| Module-wise count rates for Quadrant A Data is divided into 100 sec bins |
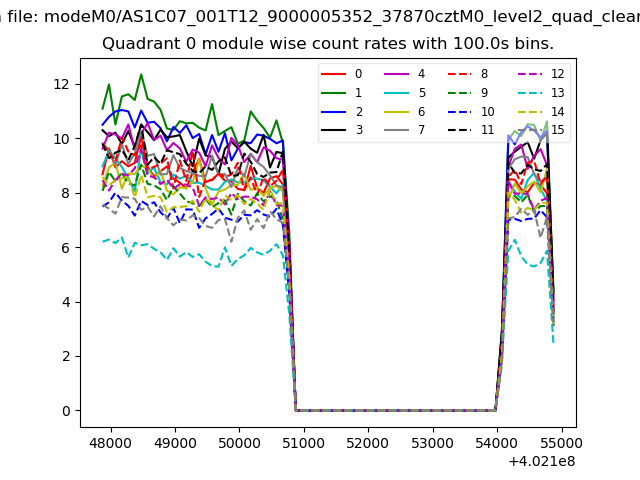 |
 |
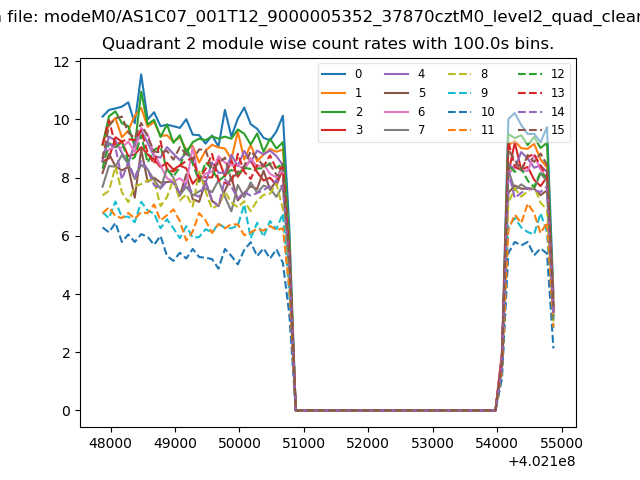
| Module-wise count rates for Quadrant B Data is divided into 100 sec bins |
 |
 |
| Module-wise count rates for Quadrant C Data is divided into 100 sec bins |
 |
 |
| Module-wise count rates for Quadrant D Data is divided into 100 sec bins |
 |
 |
| Parameter | Plot |
|---|---|
| CZT HV Monitor | 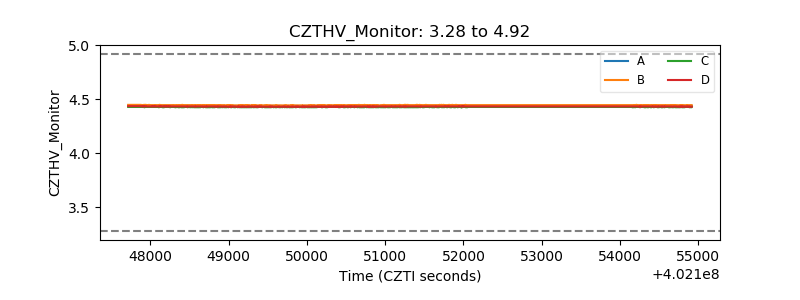 |
| D_VDD | 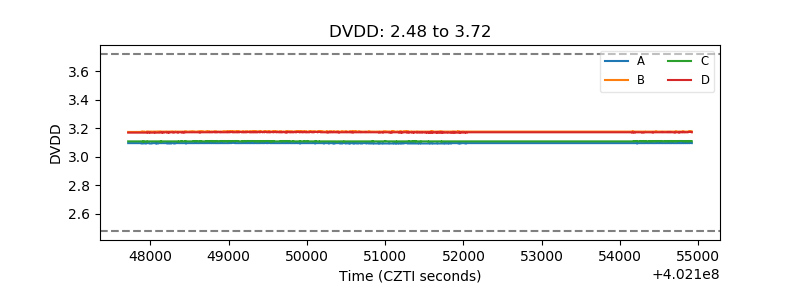 |
| Temperature 1 | 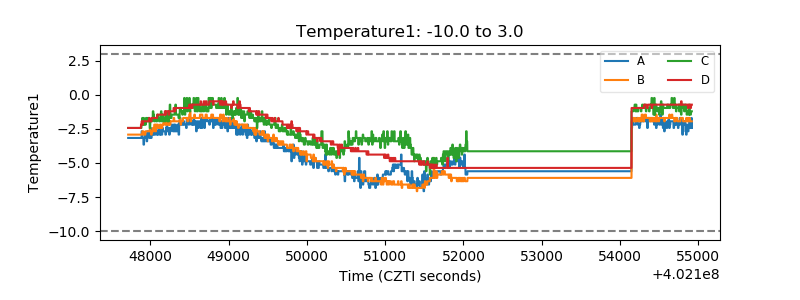 |
| Veto HV Monitor | 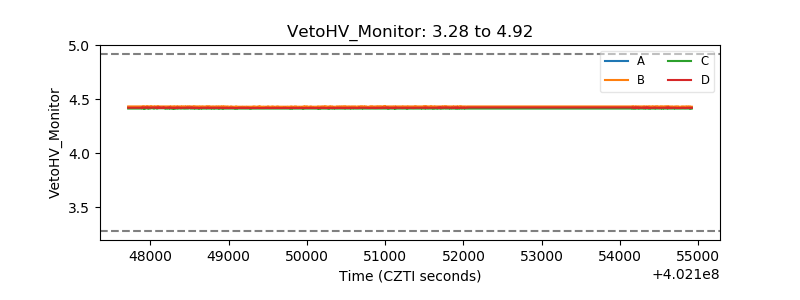 |
| Veto LLD | 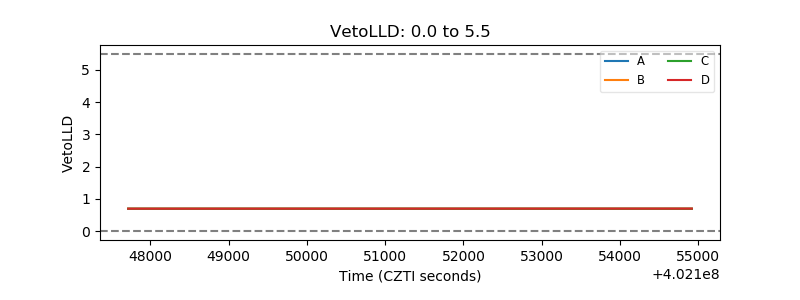 |
| Alpha Counter | 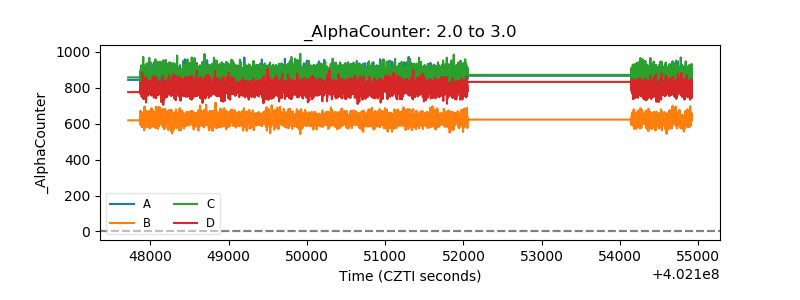 |
| _CPM_Rate | 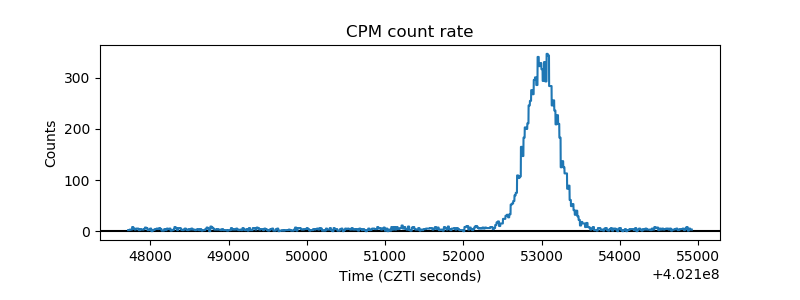 |
| CZT Counter | 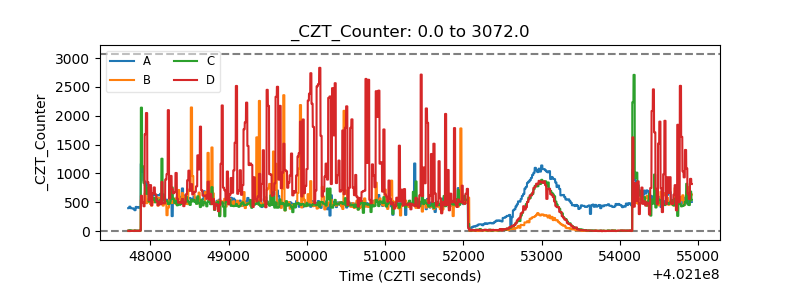 |
| +2.5 Volts monitor | 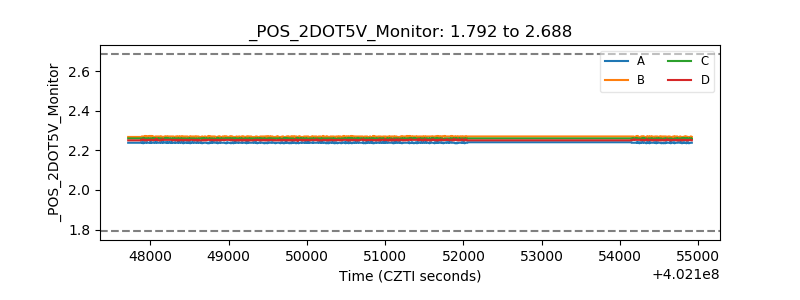 |
| +5 Volts monitor | 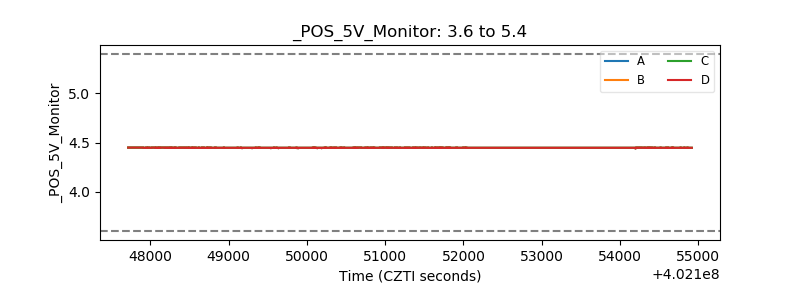 |
| _ROLL_ROT | 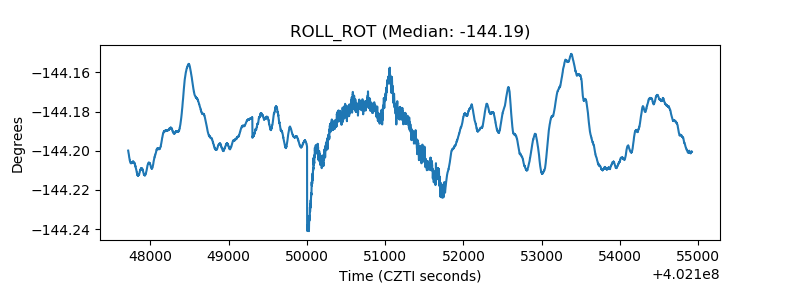 |
| _Roll_DEC | 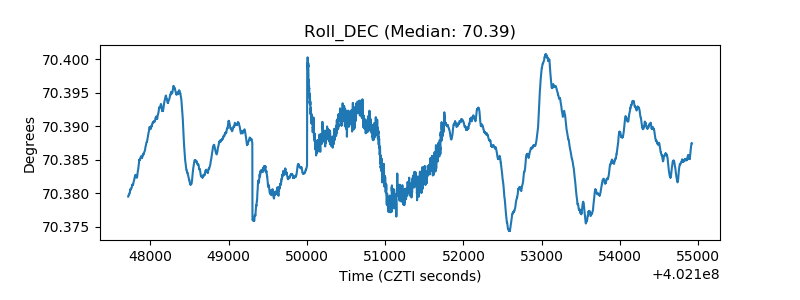 |
| _Roll_RA | 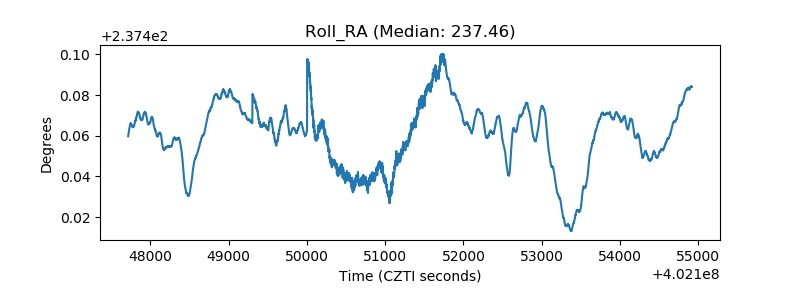 |
| Veto Counter | 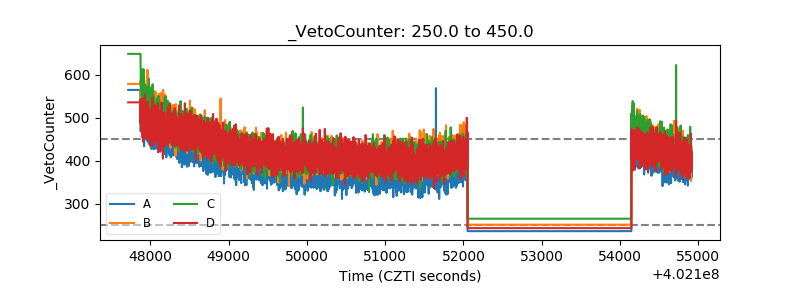 |