| Param | Original file | Final file |
|---|---|---|
| Filename | modeM0/AS1C07_001T12_9000005352_37871cztM0_level2.evt | modeM0/AS1C07_001T12_9000005352_37871cztM0_level2_quad_clean.evt |
| Size (bytes) | 414,152,640 | 71,026,560 |
| Size | 395.0 MB | 67.7 MB |
| Events in quadrant A | 2,846,895 | 470,823 |
| Events in quadrant B | 3,003,995 | 469,141 |
| Events in quadrant C | 2,751,143 | 439,897 |
| Events in quadrant D | 3,581,154 | 400,317 |
| Mode M9 | |||
|---|---|---|---|
| Quadrant | BADHDUFLAG | Total packets | Discarded packets |
| A | 0 | 22 | 0 |
| B | 0 | 22 | 0 |
| C | 0 | 22 | 0 |
| D | 0 | 23 | 0 |
| Mode M0 | |||
|---|---|---|---|
| Quadrant | BADHDUFLAG | Total packets | Discarded packets |
| A | 0 | 11498 | 3 |
| B | 0 | 12314 | 2 |
| C | 0 | 11380 | 2 |
| D | 0 | 14164 | 2 |
| Mode SS | |||
|---|---|---|---|
| Quadrant | BADHDUFLAG | Total packets | Discarded packets |
| A | 0 | 108 | 0 |
| B | 0 | 108 | 0 |
| C | 0 | 108 | 0 |
| D | 0 | 108 | 0 |
| Quadrant | Total seconds | Saturated seconds | Saturation percentage |
|---|---|---|---|
| A | 5288 | 18 | 0.340393% |
| B | 5288 | 97 | 1.834342% |
| C | 5288 | 51 | 0.964448% |
| D | 5288 | 215 | 4.065809% |
Noise dominated data is calculated using 1-second bins in cleaned event files. If a bin has >2000 counts, and if more than 50% of those come from <1% of pixels, then it is considered to be noise-dominated and hence unusable.
| Quadrant | # 1 sec bins | Bins with >0 counts | Bins with >2000 counts | High rate bins dominated by noise | Noise dominated (total time) | Noise dominated (detector-on time) | Marked lightcurve |
|---|---|---|---|---|---|---|---|
| A | 7170 | 5289 | 11 | 11 | 0.15% | 0.21% | 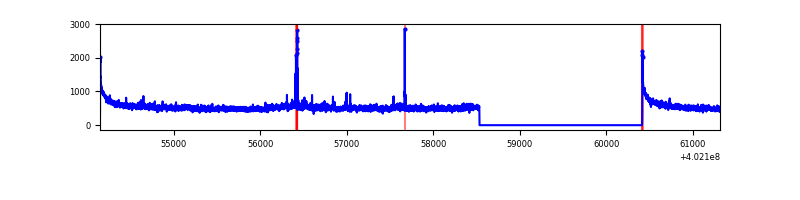 |
| B | 7170 | 5289 | 74 | 74 | 1.03% | 1.40% | 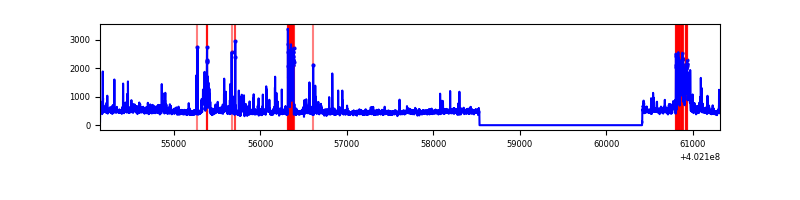 |
| C | 7170 | 5289 | 49 | 49 | 0.68% | 0.93% | 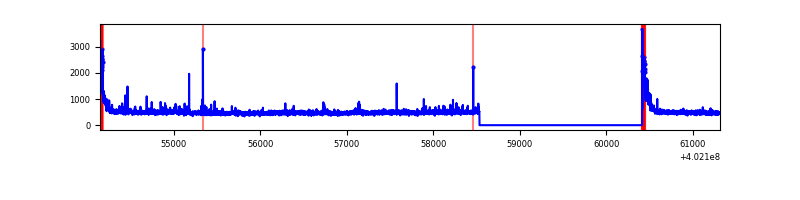 |
| D | 7170 | 5289 | 182 | 182 | 2.54% | 3.44% | 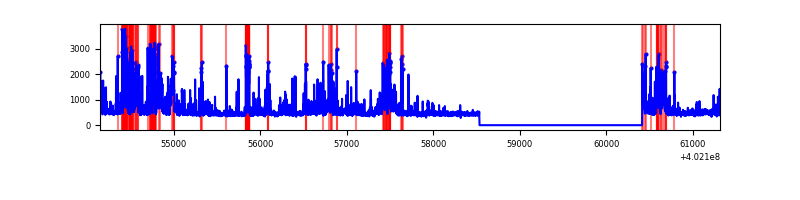 |
Top three noisy pixels from each quadrant. If the there are fewer than three noisy pixels in the level2.evt file, extra rows are filled as -1
| Pixel properties | Quadrant properties | ||||||
|---|---|---|---|---|---|---|---|
| Quadrant | DetID | PixID | Counts | Sigma | Mean | Median | Sigma |
| A | 10 | 83 | 360255 | 2991.52 | 590 | 578 | 120.2 |
| A | 15 | 222 | 133542 | 1105.89 | 590 | 578 | 120.2 |
| A | 9 | 143 | 32842 | 268.35 | 590 | 578 | 120.2 |
| B | 5 | 172 | 418317 | 3794.15 | 582 | 567 | 110.1 |
| B | 0 | 229 | 117468 | 1061.73 | 582 | 567 | 110.1 |
| B | 0 | 189 | 45639 | 409.36 | 582 | 567 | 110.1 |
| C | 15 | 214 | 224582 | 1692.31 | 572 | 576 | 132.4 |
| C | 0 | 10 | 195945 | 1475.97 | 572 | 576 | 132.4 |
| C | 14 | 254 | 67424 | 505.02 | 572 | 576 | 132.4 |
| D | 1 | 52 | 482367 | 3466.67 | 570 | 555 | 139.0 |
| D | 1 | 47 | 279048 | 2003.78 | 570 | 555 | 139.0 |
| D | 2 | 249 | 248176 | 1781.65 | 570 | 555 | 139.0 |
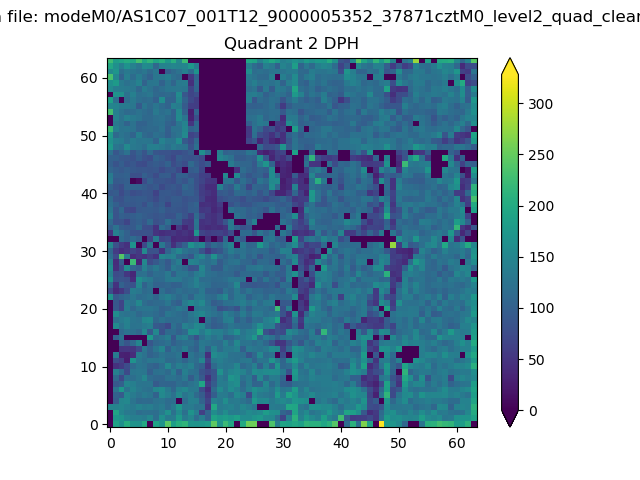
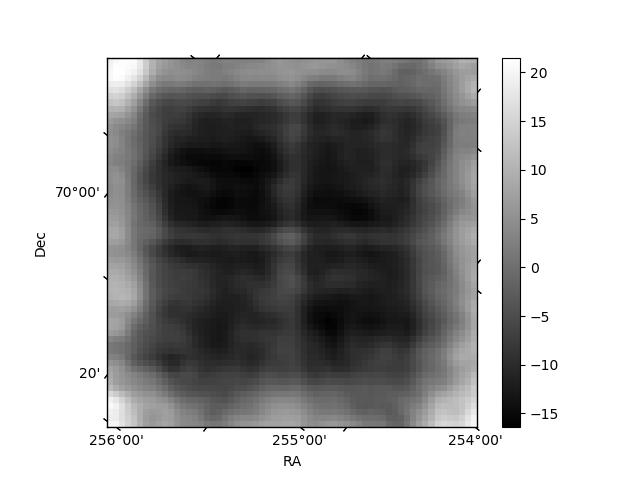
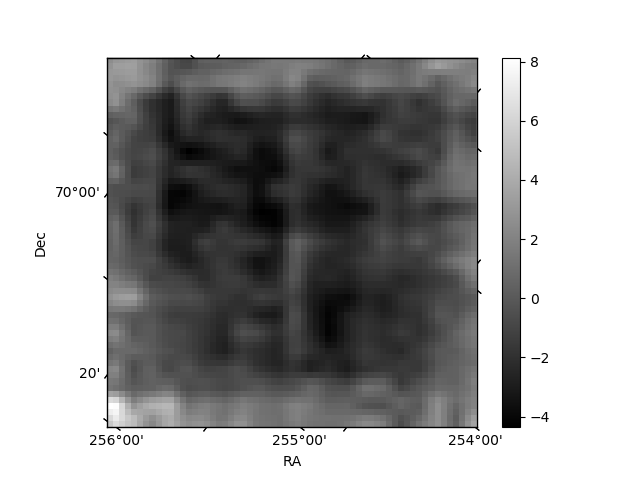
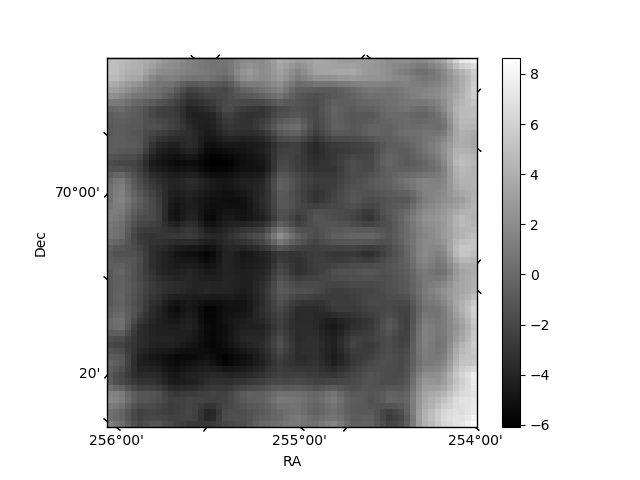
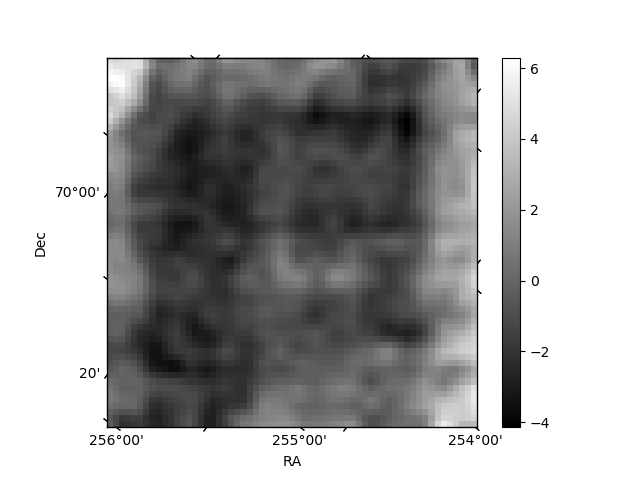
Histogram calculated using DETX and DETY for each event in the final _common_clean file
| Quadrant A | 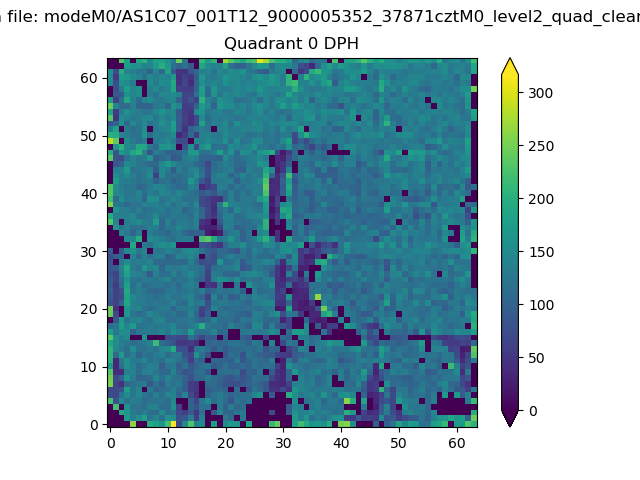 |
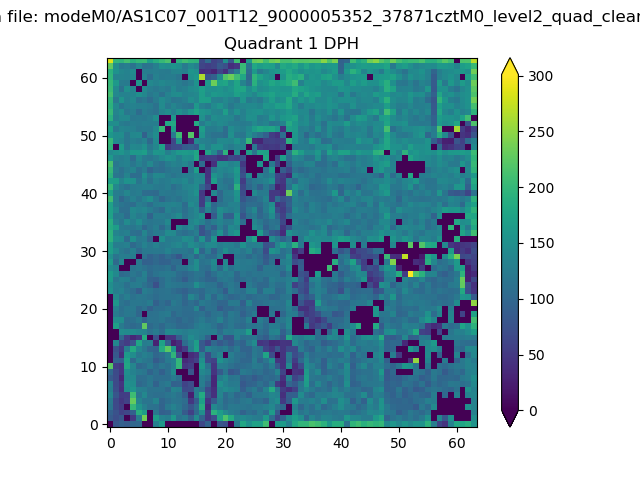 |
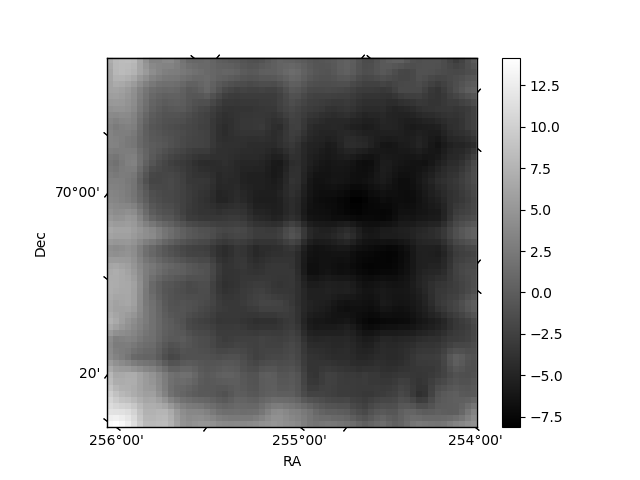
Quadrant B |
|---|---|---|---|
| Quadrant D | 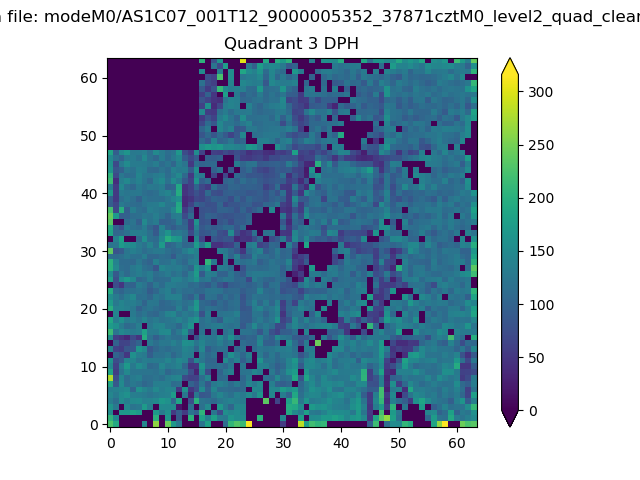 |
 |
Quadrant C |
| Plot type | Count rate plots | Images |
|---|---|---|
| Comparison with Poisson distribution Blue bars denote a histogram of data divided into 1 sec bins. Red curve is a Poisson curve with rate = median count rate of data. |
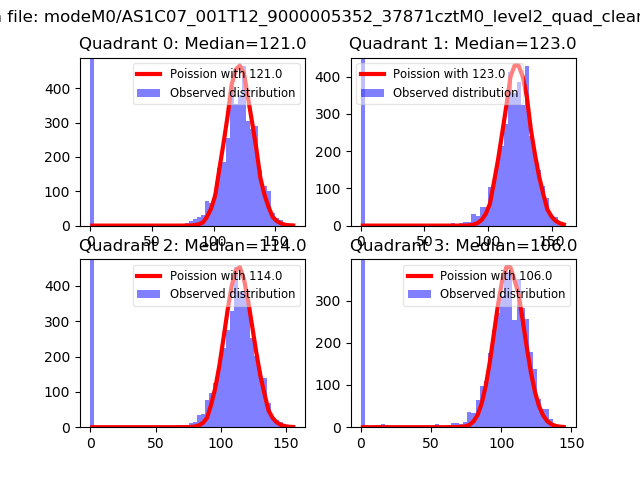 |
 |
| Quadrant-wise count rates Data is divided into 100 sec bins |
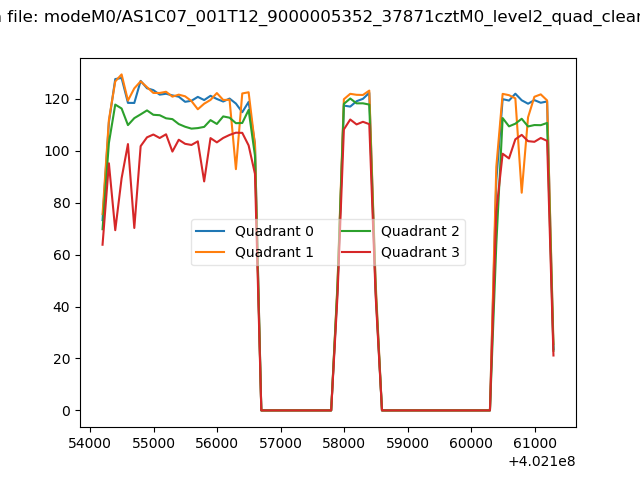 |
|
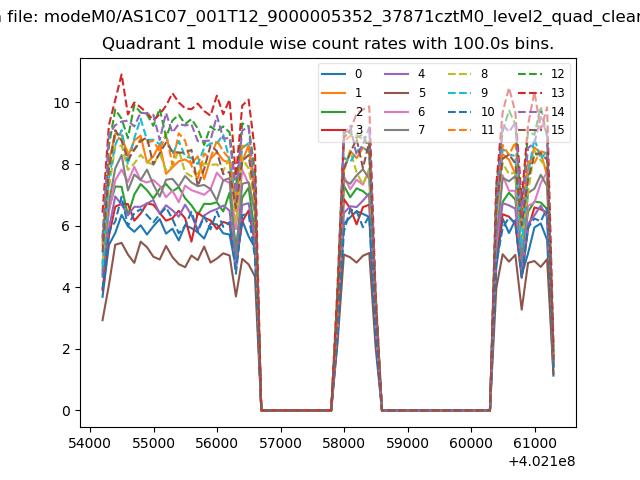
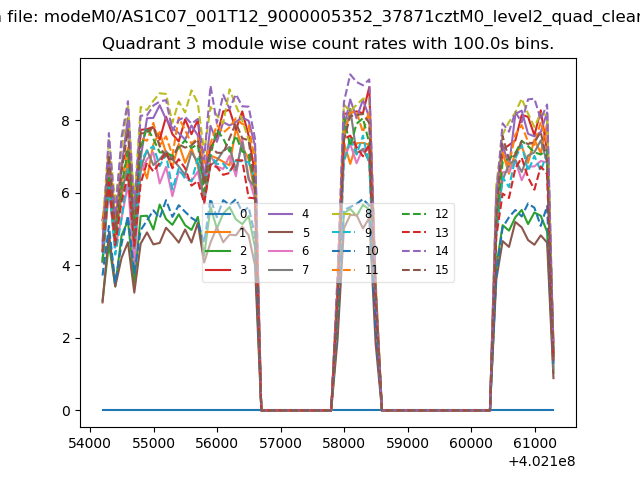
| Module-wise count rates for Quadrant A Data is divided into 100 sec bins |
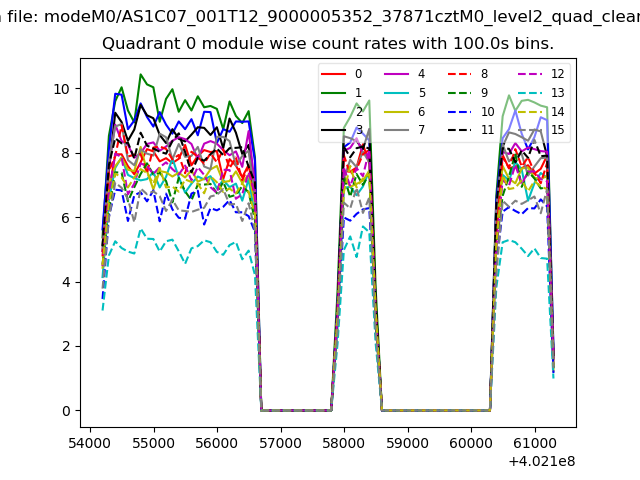 |
 |
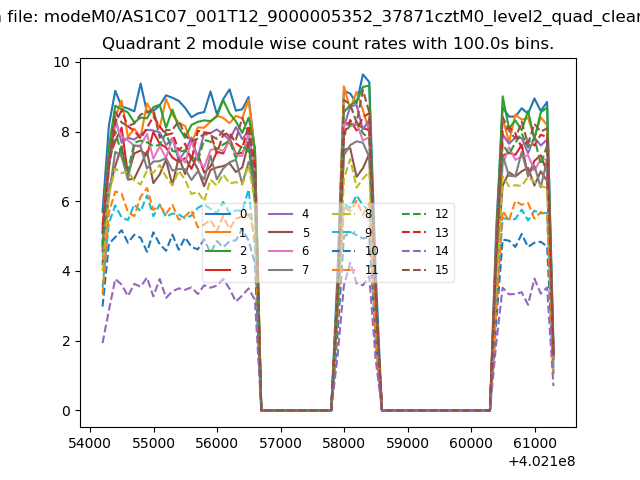
| Module-wise count rates for Quadrant B Data is divided into 100 sec bins |
 |
 |
| Module-wise count rates for Quadrant C Data is divided into 100 sec bins |
 |
 |
| Module-wise count rates for Quadrant D Data is divided into 100 sec bins |
 |
 |
| Parameter | Plot |
|---|---|
| CZT HV Monitor |  |
| D_VDD | 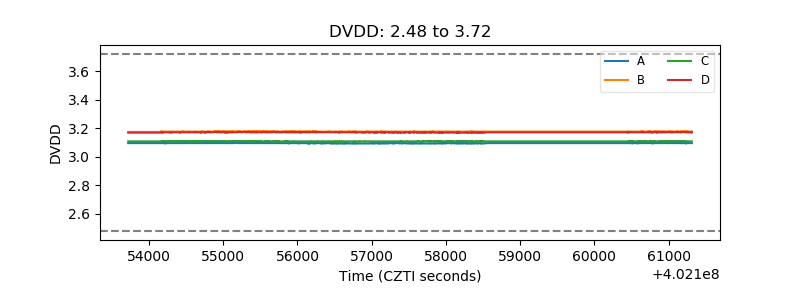 |
| Temperature 1 | 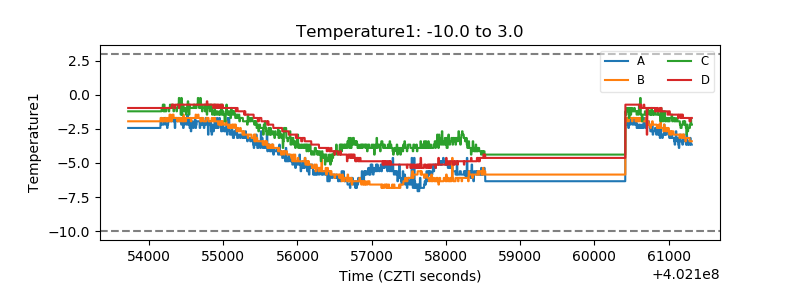 |
| Veto HV Monitor | 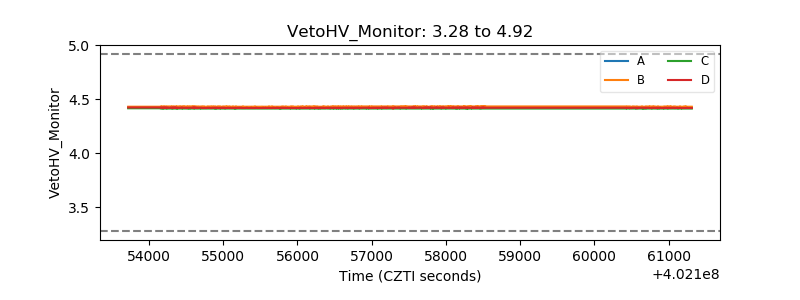 |
| Veto LLD | 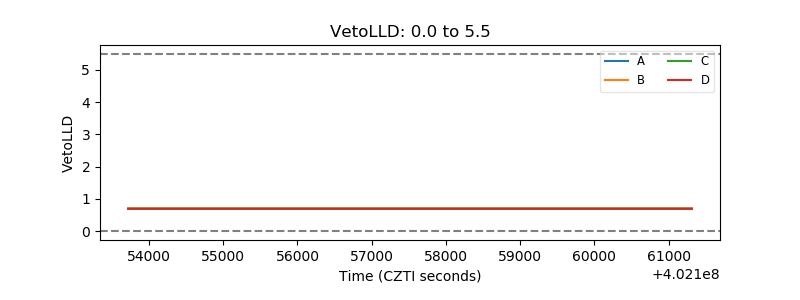 |
| Alpha Counter | 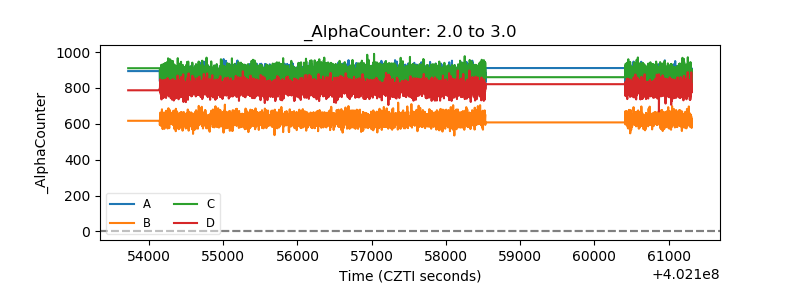 |
| _CPM_Rate |  |
| CZT Counter | 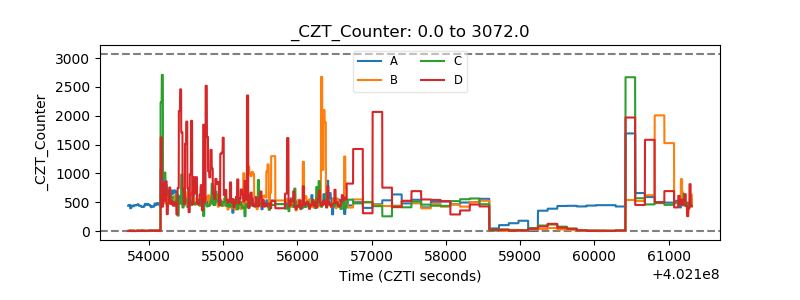 |
| +2.5 Volts monitor | 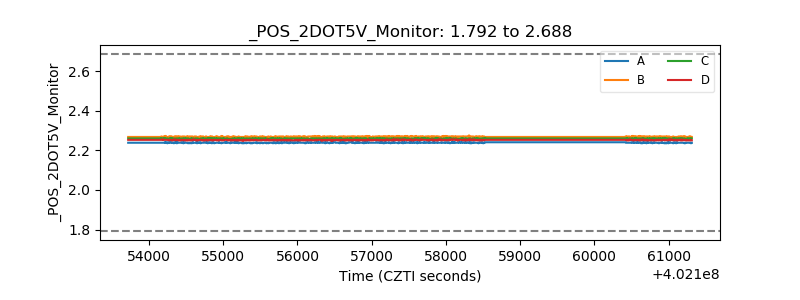 |
| +5 Volts monitor | 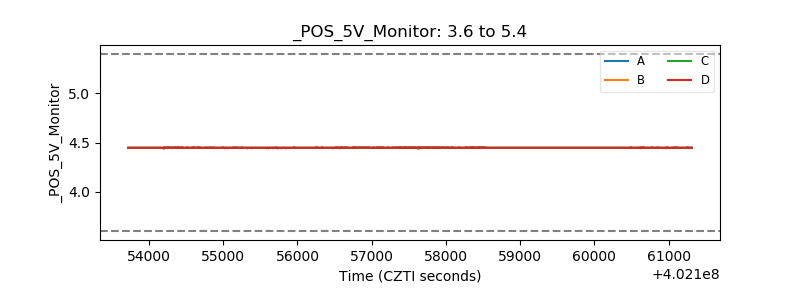 |
| _ROLL_ROT | 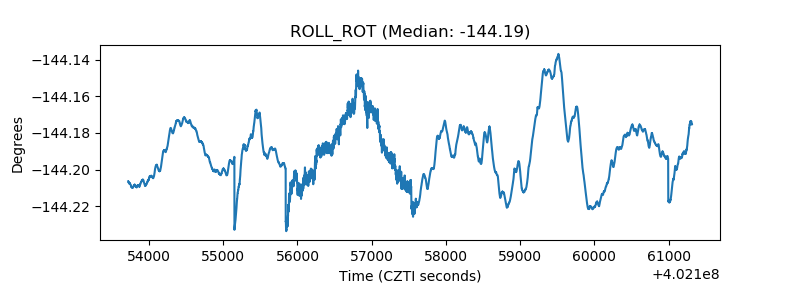 |
| _Roll_DEC | 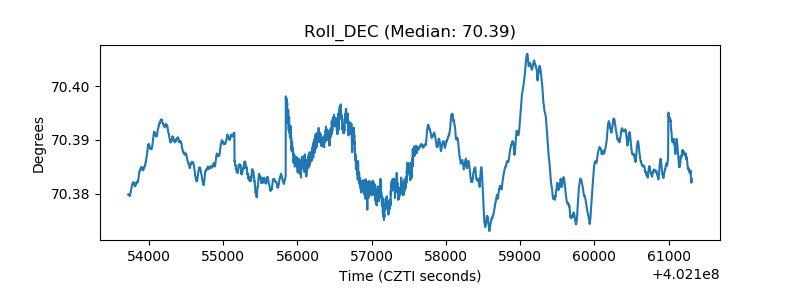 |
| _Roll_RA | 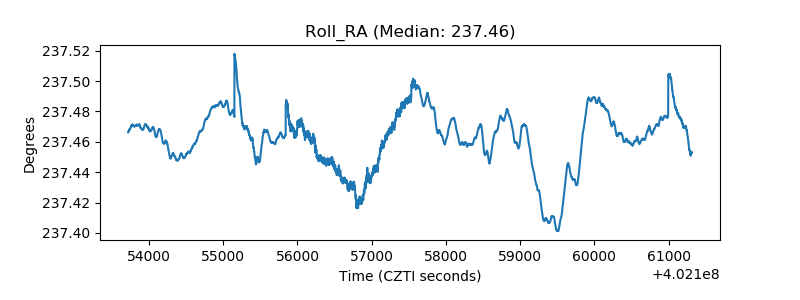 |
| Veto Counter | 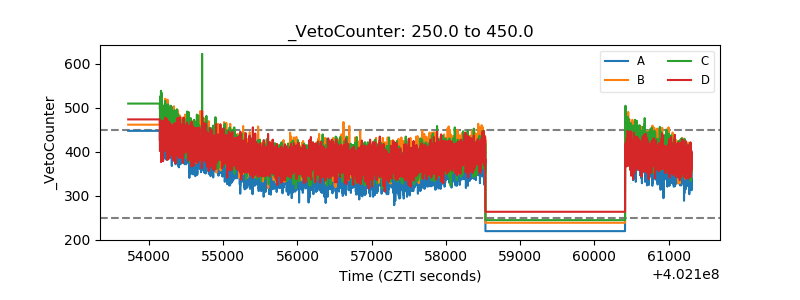 |